Downloaded 492 times
![that occur. Collaboration diagrams demonstrate how objects are statically connected. Both
diagrams are relatively simple to draw and contain similar elements. 1
Sequence diagrams:
Sequence diagrams demonstrate the behavior of objects in a use case by describing the objects
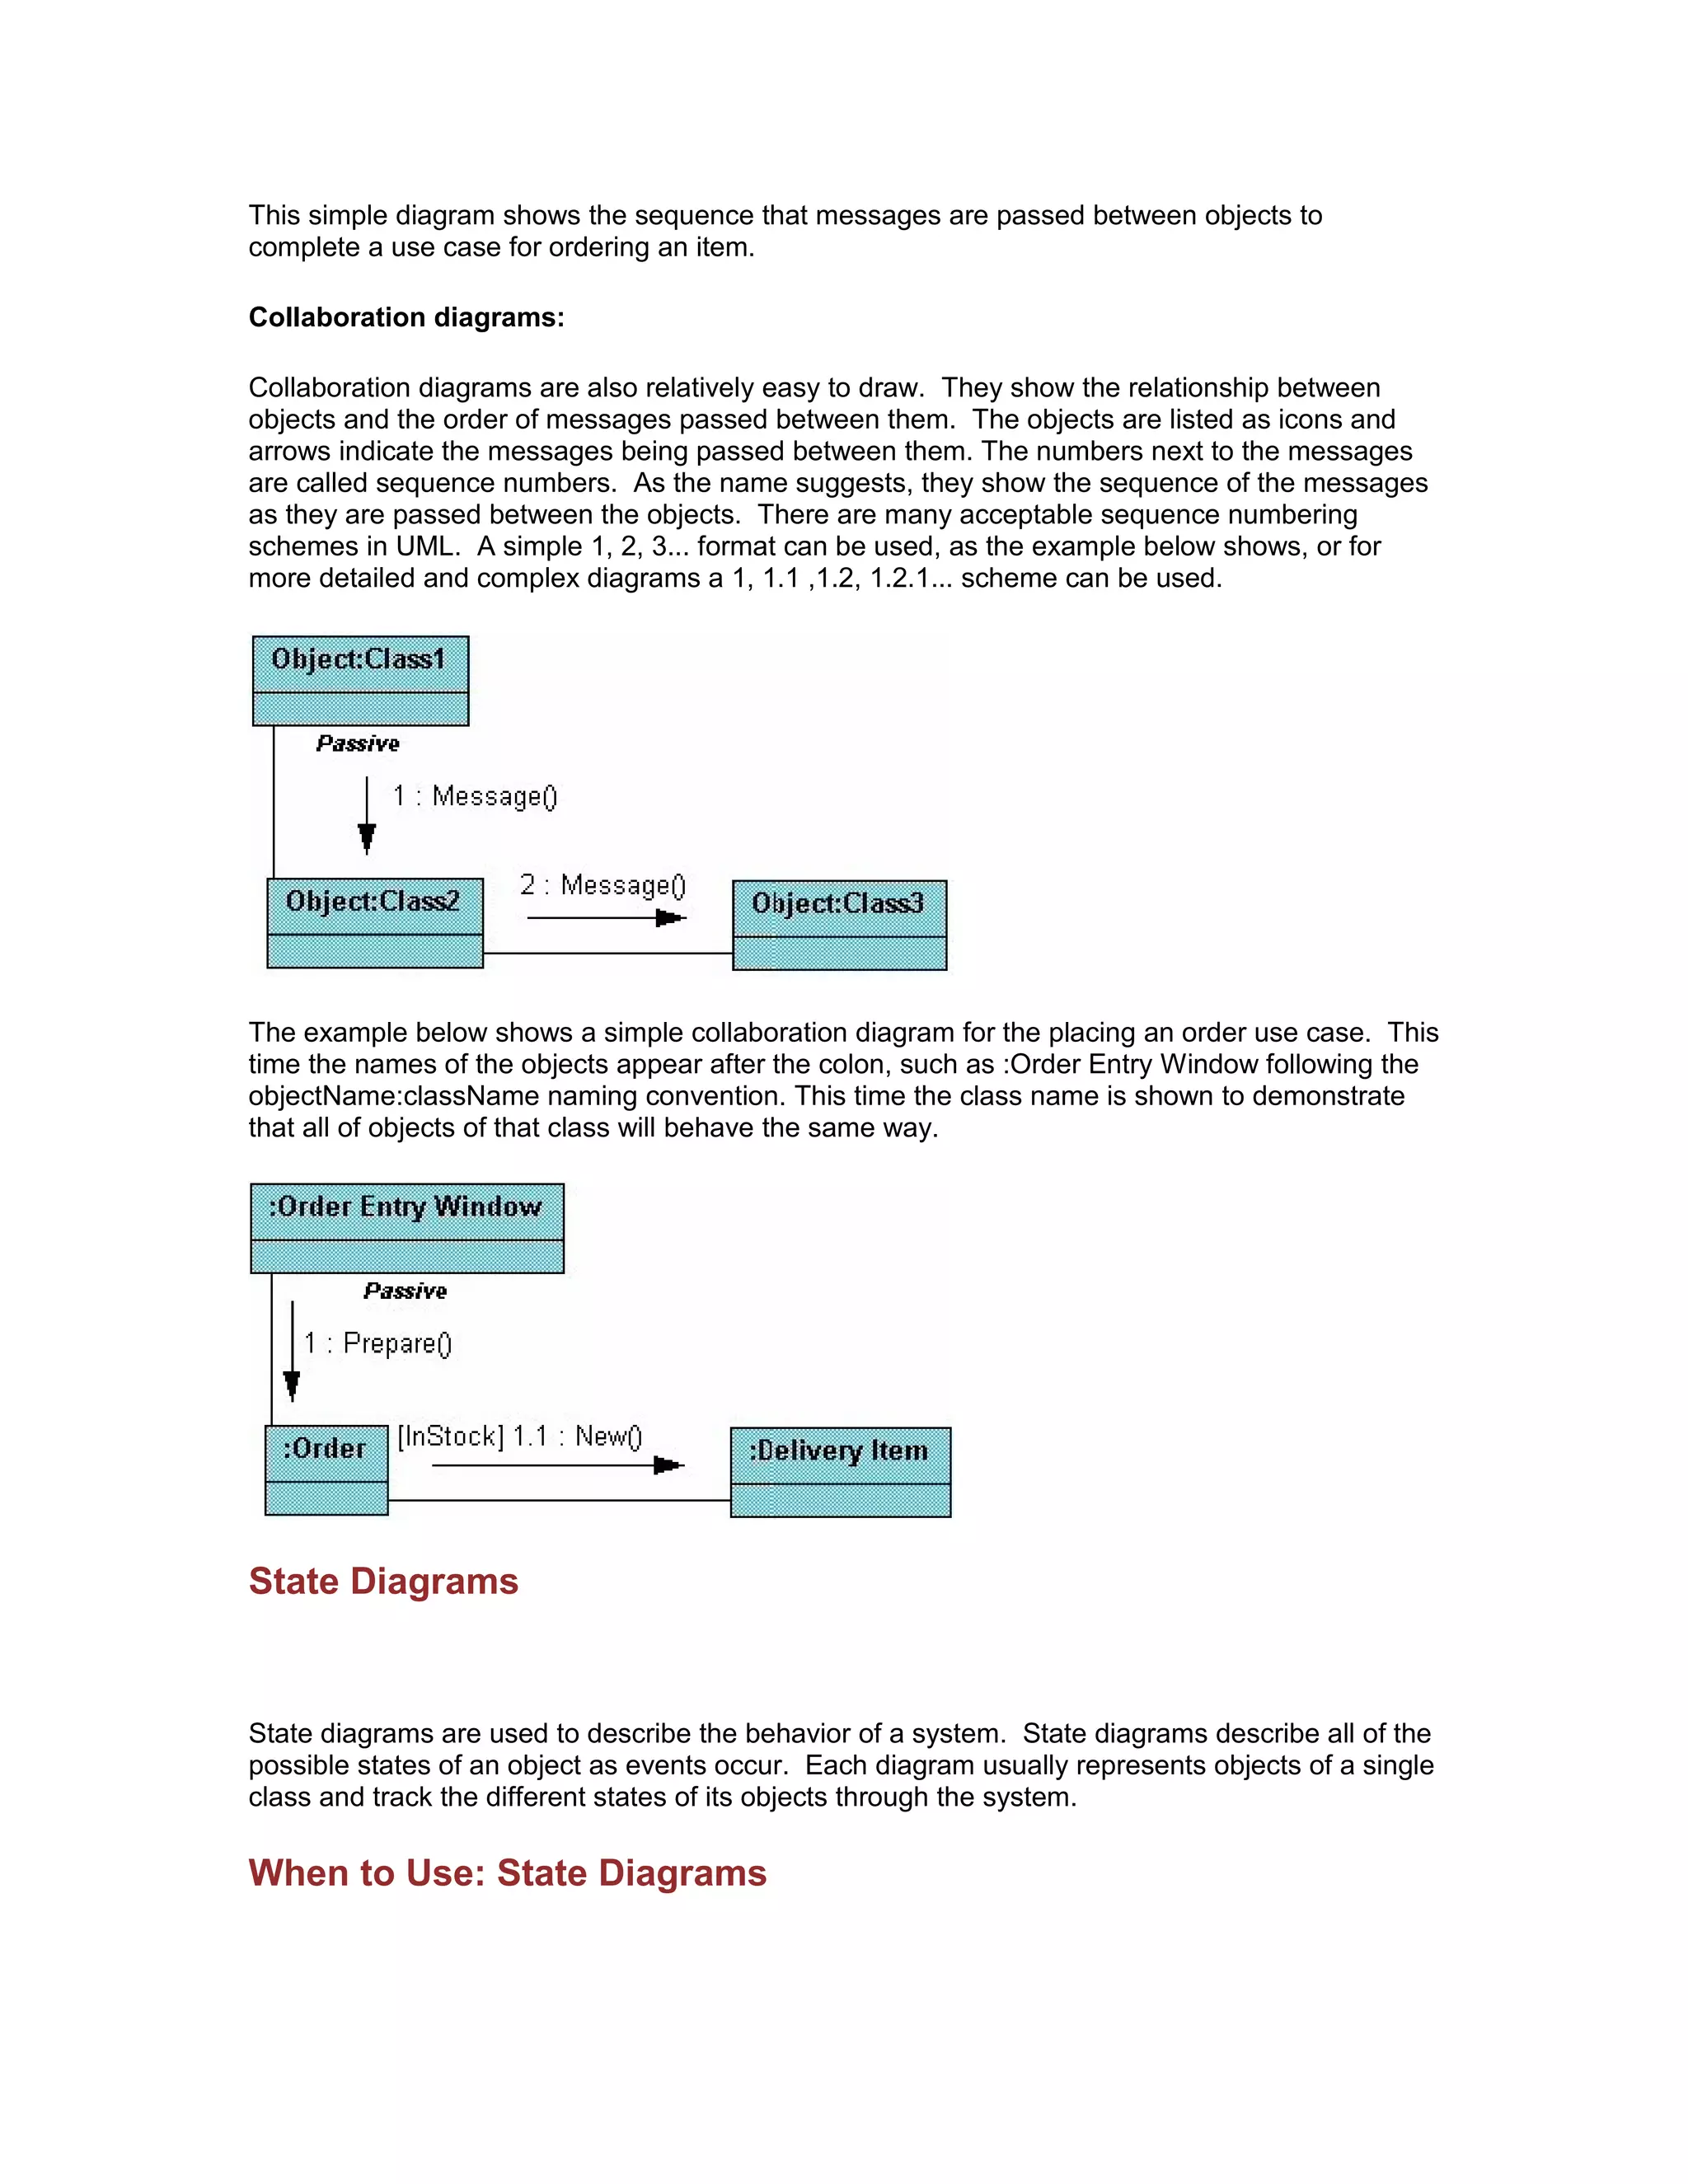
and the messages they pass. the diagrams are read left to right and descending. The example
below shows an object of class 1 start the behavior by sending a message to an object of class
2. Messages pass between the different objects until the object of class 1 receives the final
message.
Below is a slightly more complex example. The light blue vertical recrtangles the objects
activation while the green vertical dashed lines represent the life of the object. The green vertical
rectangles represent when a particular object has control. The represents when the object is
destroyed. This diagrams also shows conditions for messages to be sent to other object. The
condition is listed between brackets next to the message. For example, a [condition] has to be
met before the object of class 2 can send a message() to the object of class 3.
The next diagram shows the beginning of a sequence diagram for placing an order. The object
an Order Entry Window is created and sends a message to an Order object to prepare the order.](https://image.slidesharecdn.com/theunifiedmodelinglanguage-101231053711-phpapp02/75/Design-UML-diagrams-7-2048.jpg)
![Notice the the names of the objects are followed by a colon. The names of the classes the
objects belong to do not have to be listed. However the colon is required to denote that it is the
name of an object following the objectName:className naming system.
Next the Order object checks to see if the item is in stock and if the [InStock] condition is met it
sends a message to create an new Delivery Item object.
The next diagrams adds another conditional message to the Order object. If the item is
[OutOfStock] it sends a message back to the Order Entry Window object stating that the object is
out of stack.](https://image.slidesharecdn.com/theunifiedmodelinglanguage-101231053711-phpapp02/75/Design-UML-diagrams-8-2048.jpg)
![Use state diagrams to demonstrate the behavior of an object through many use cases of the
system. Only use state diagrams for classes where it is necessary to understand the behavior of
the object through the entire system. Not all classes will require a state diagram and state
diagrams are not useful for describing the collaboration of all objects in a use case. State
diagrams are other combined with other diagrams such as interaction diagrams and activity
diagrams.
How to Draw: State Diagrams
State diagrams have very few elements. The basic elements are rounded boxes representing the
state of the object and arrows indicting the transition to the next state. The activity section of the
state symbol depicts what activities the object will be doing while it is in that state.
All state diagrams being with an initial state of the object. This is the state of the object when it is
created. After the initial state the object begins changing states. Conditions based on the
activities can determine what the next state the object transitions to.
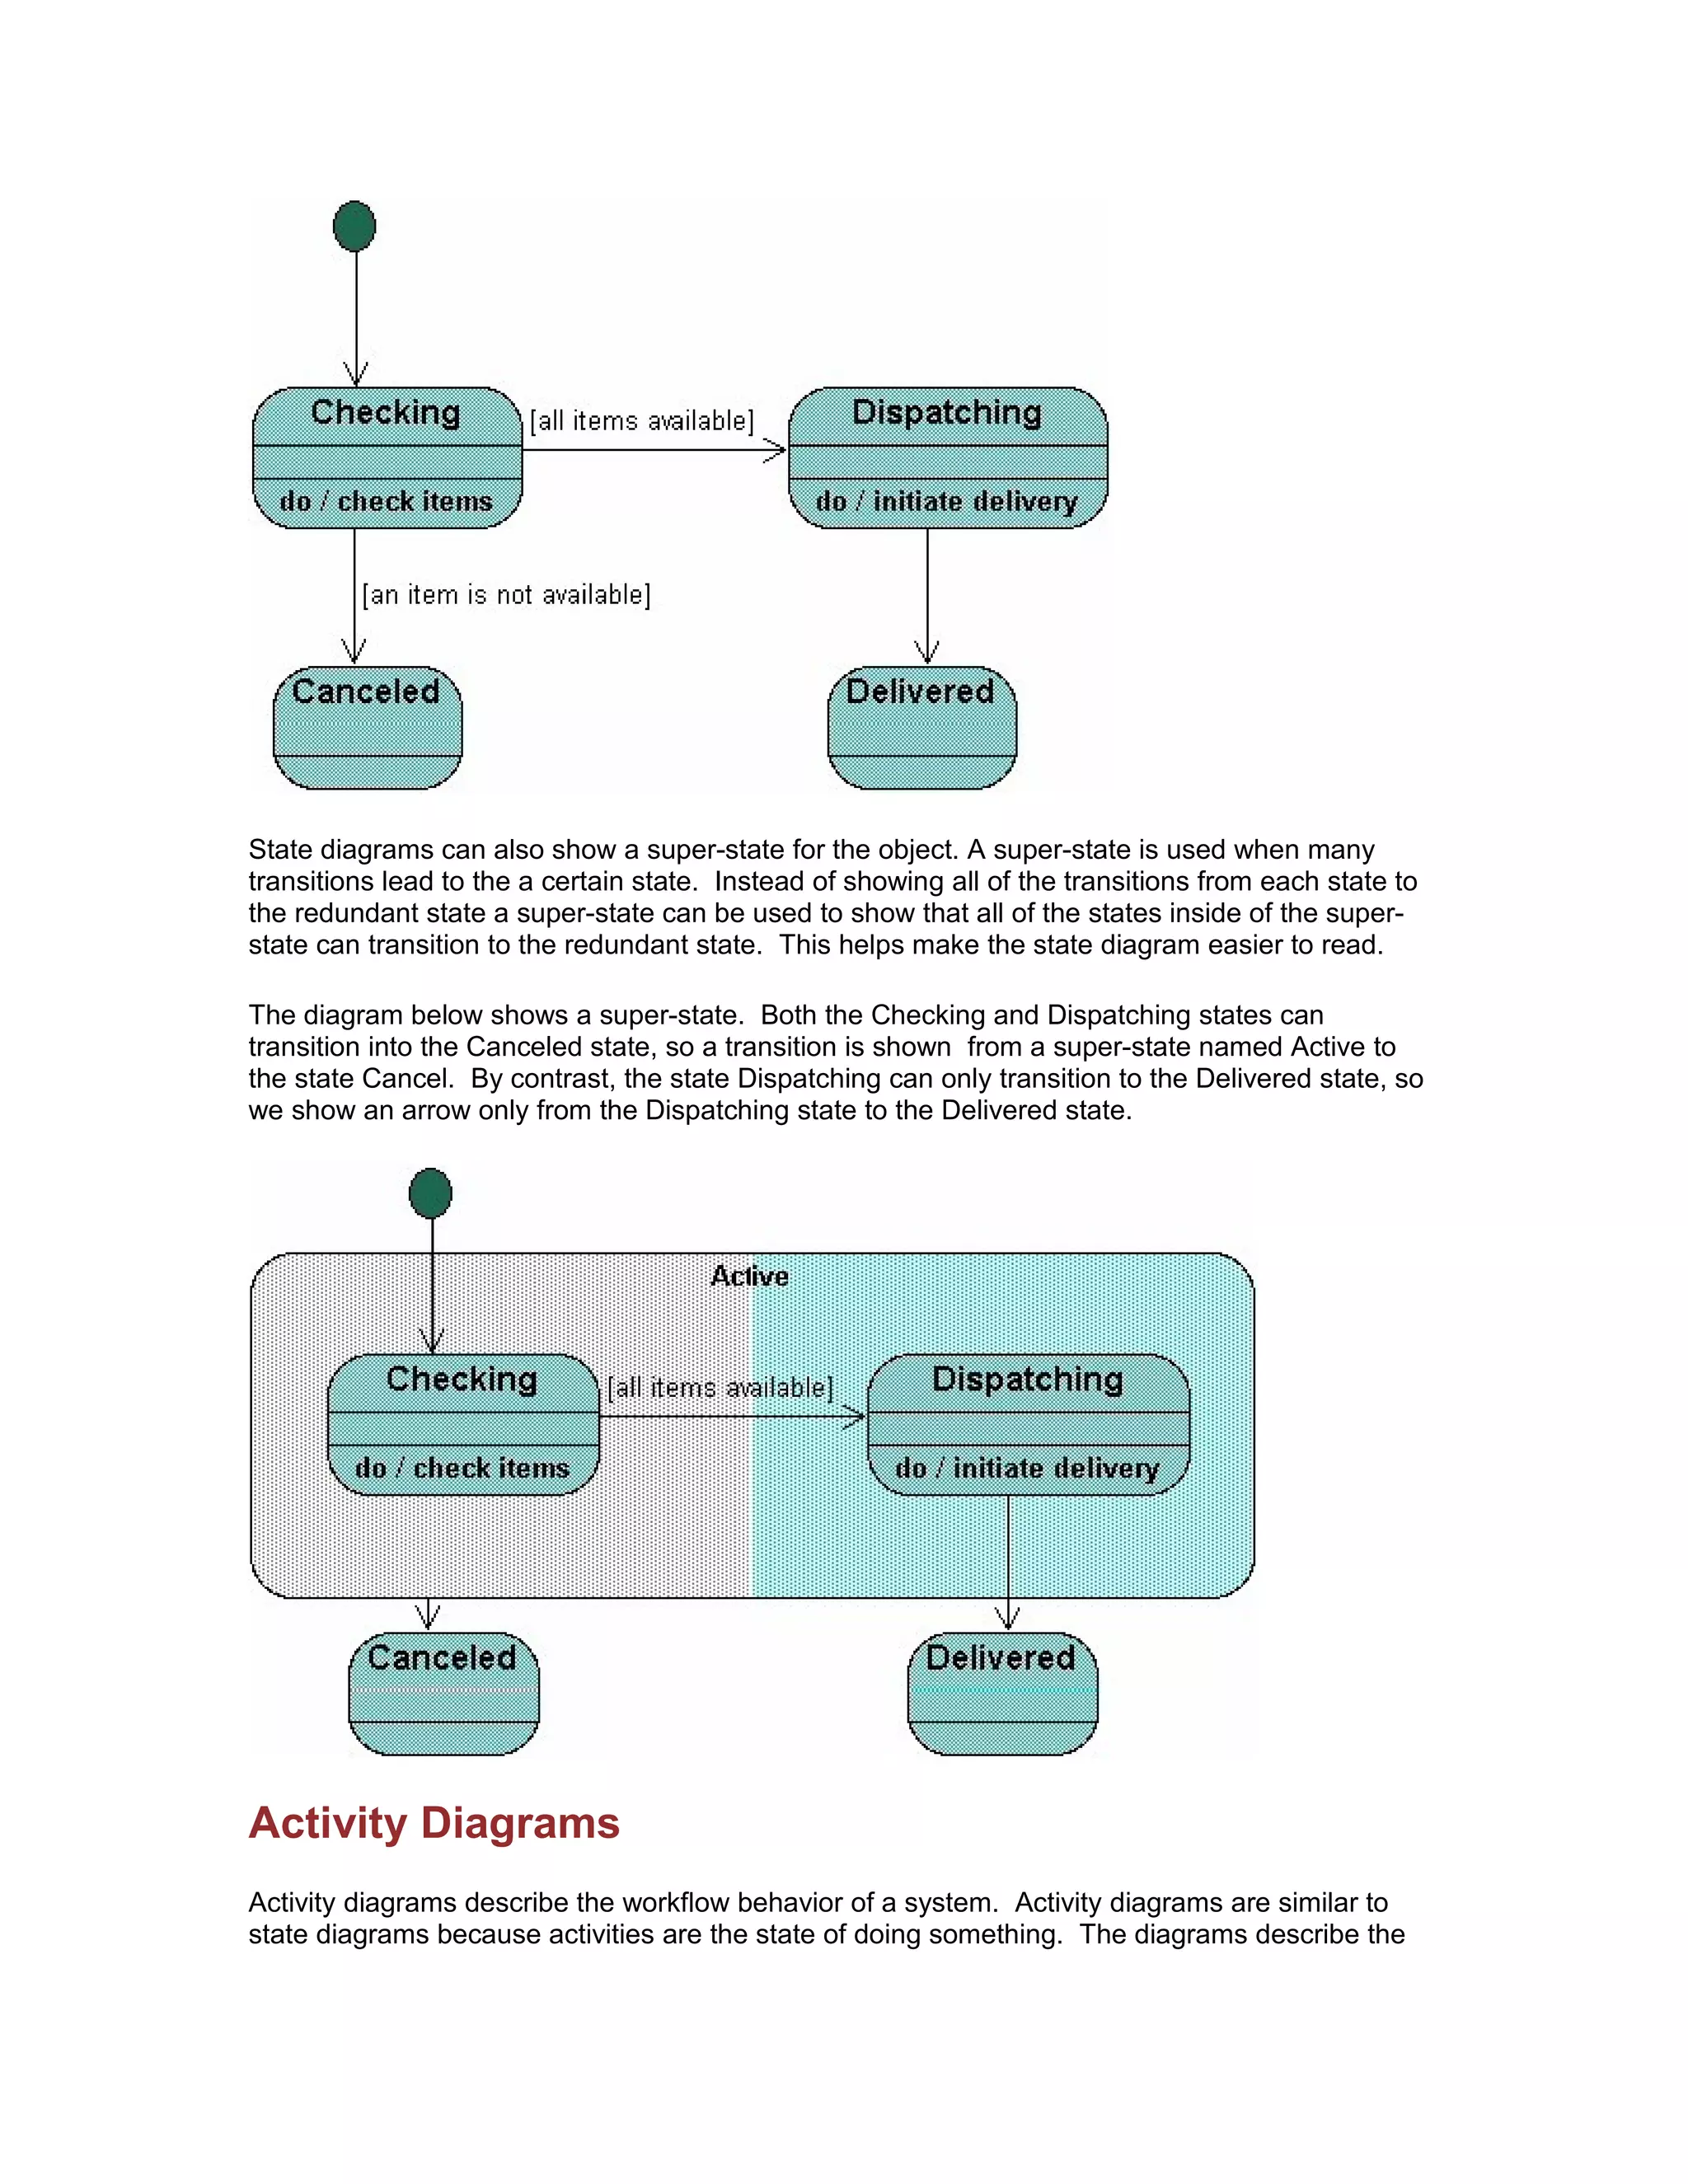
Below is an example of a state diagram might look like for an Order object. When the object
enters the Checking state it performs the activity "check items." After the activity is completed the
object transitions to the next state based on the conditions [all items available] or [an item is not
available]. If an item is not available the order is canceled. If all items are available then the
order is dispatched. When the object transitions to the Dispatching state the activity "initiate
delivery" is performed. After this activity is complete the object transitions again to the Delivered
state.](https://image.slidesharecdn.com/theunifiedmodelinglanguage-101231053711-phpapp02/75/Design-UML-diagrams-10-2048.jpg)
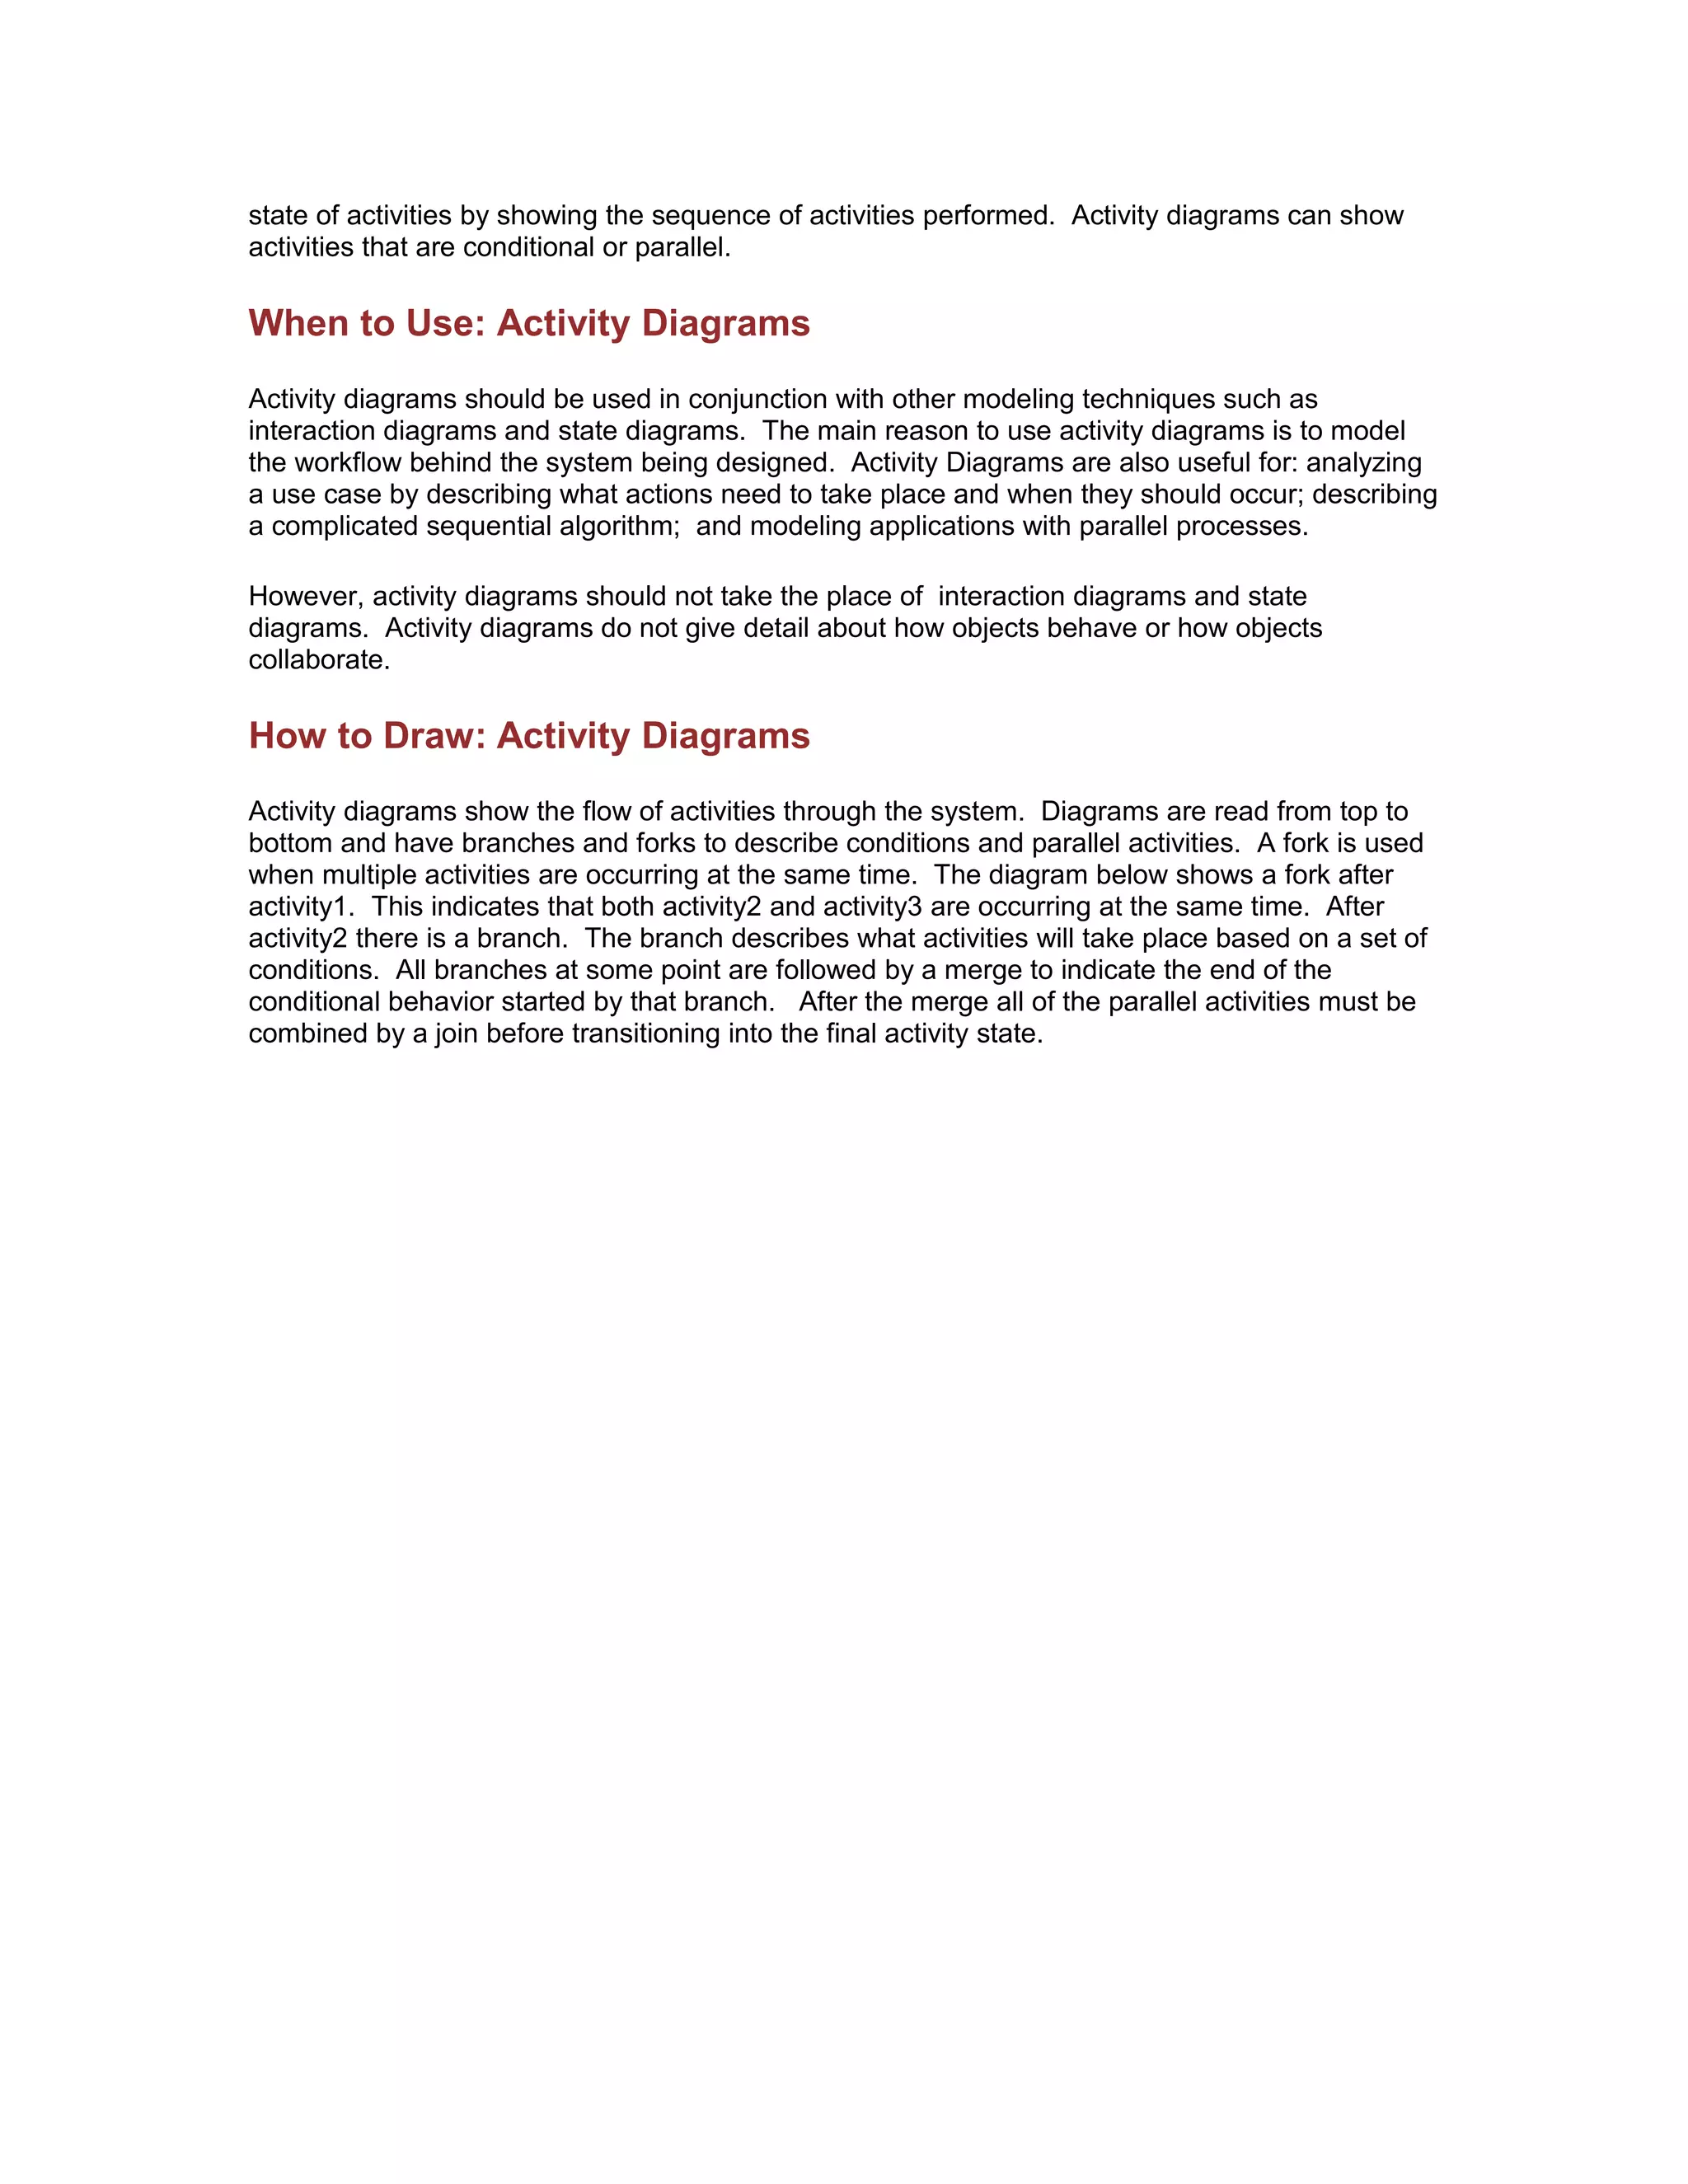
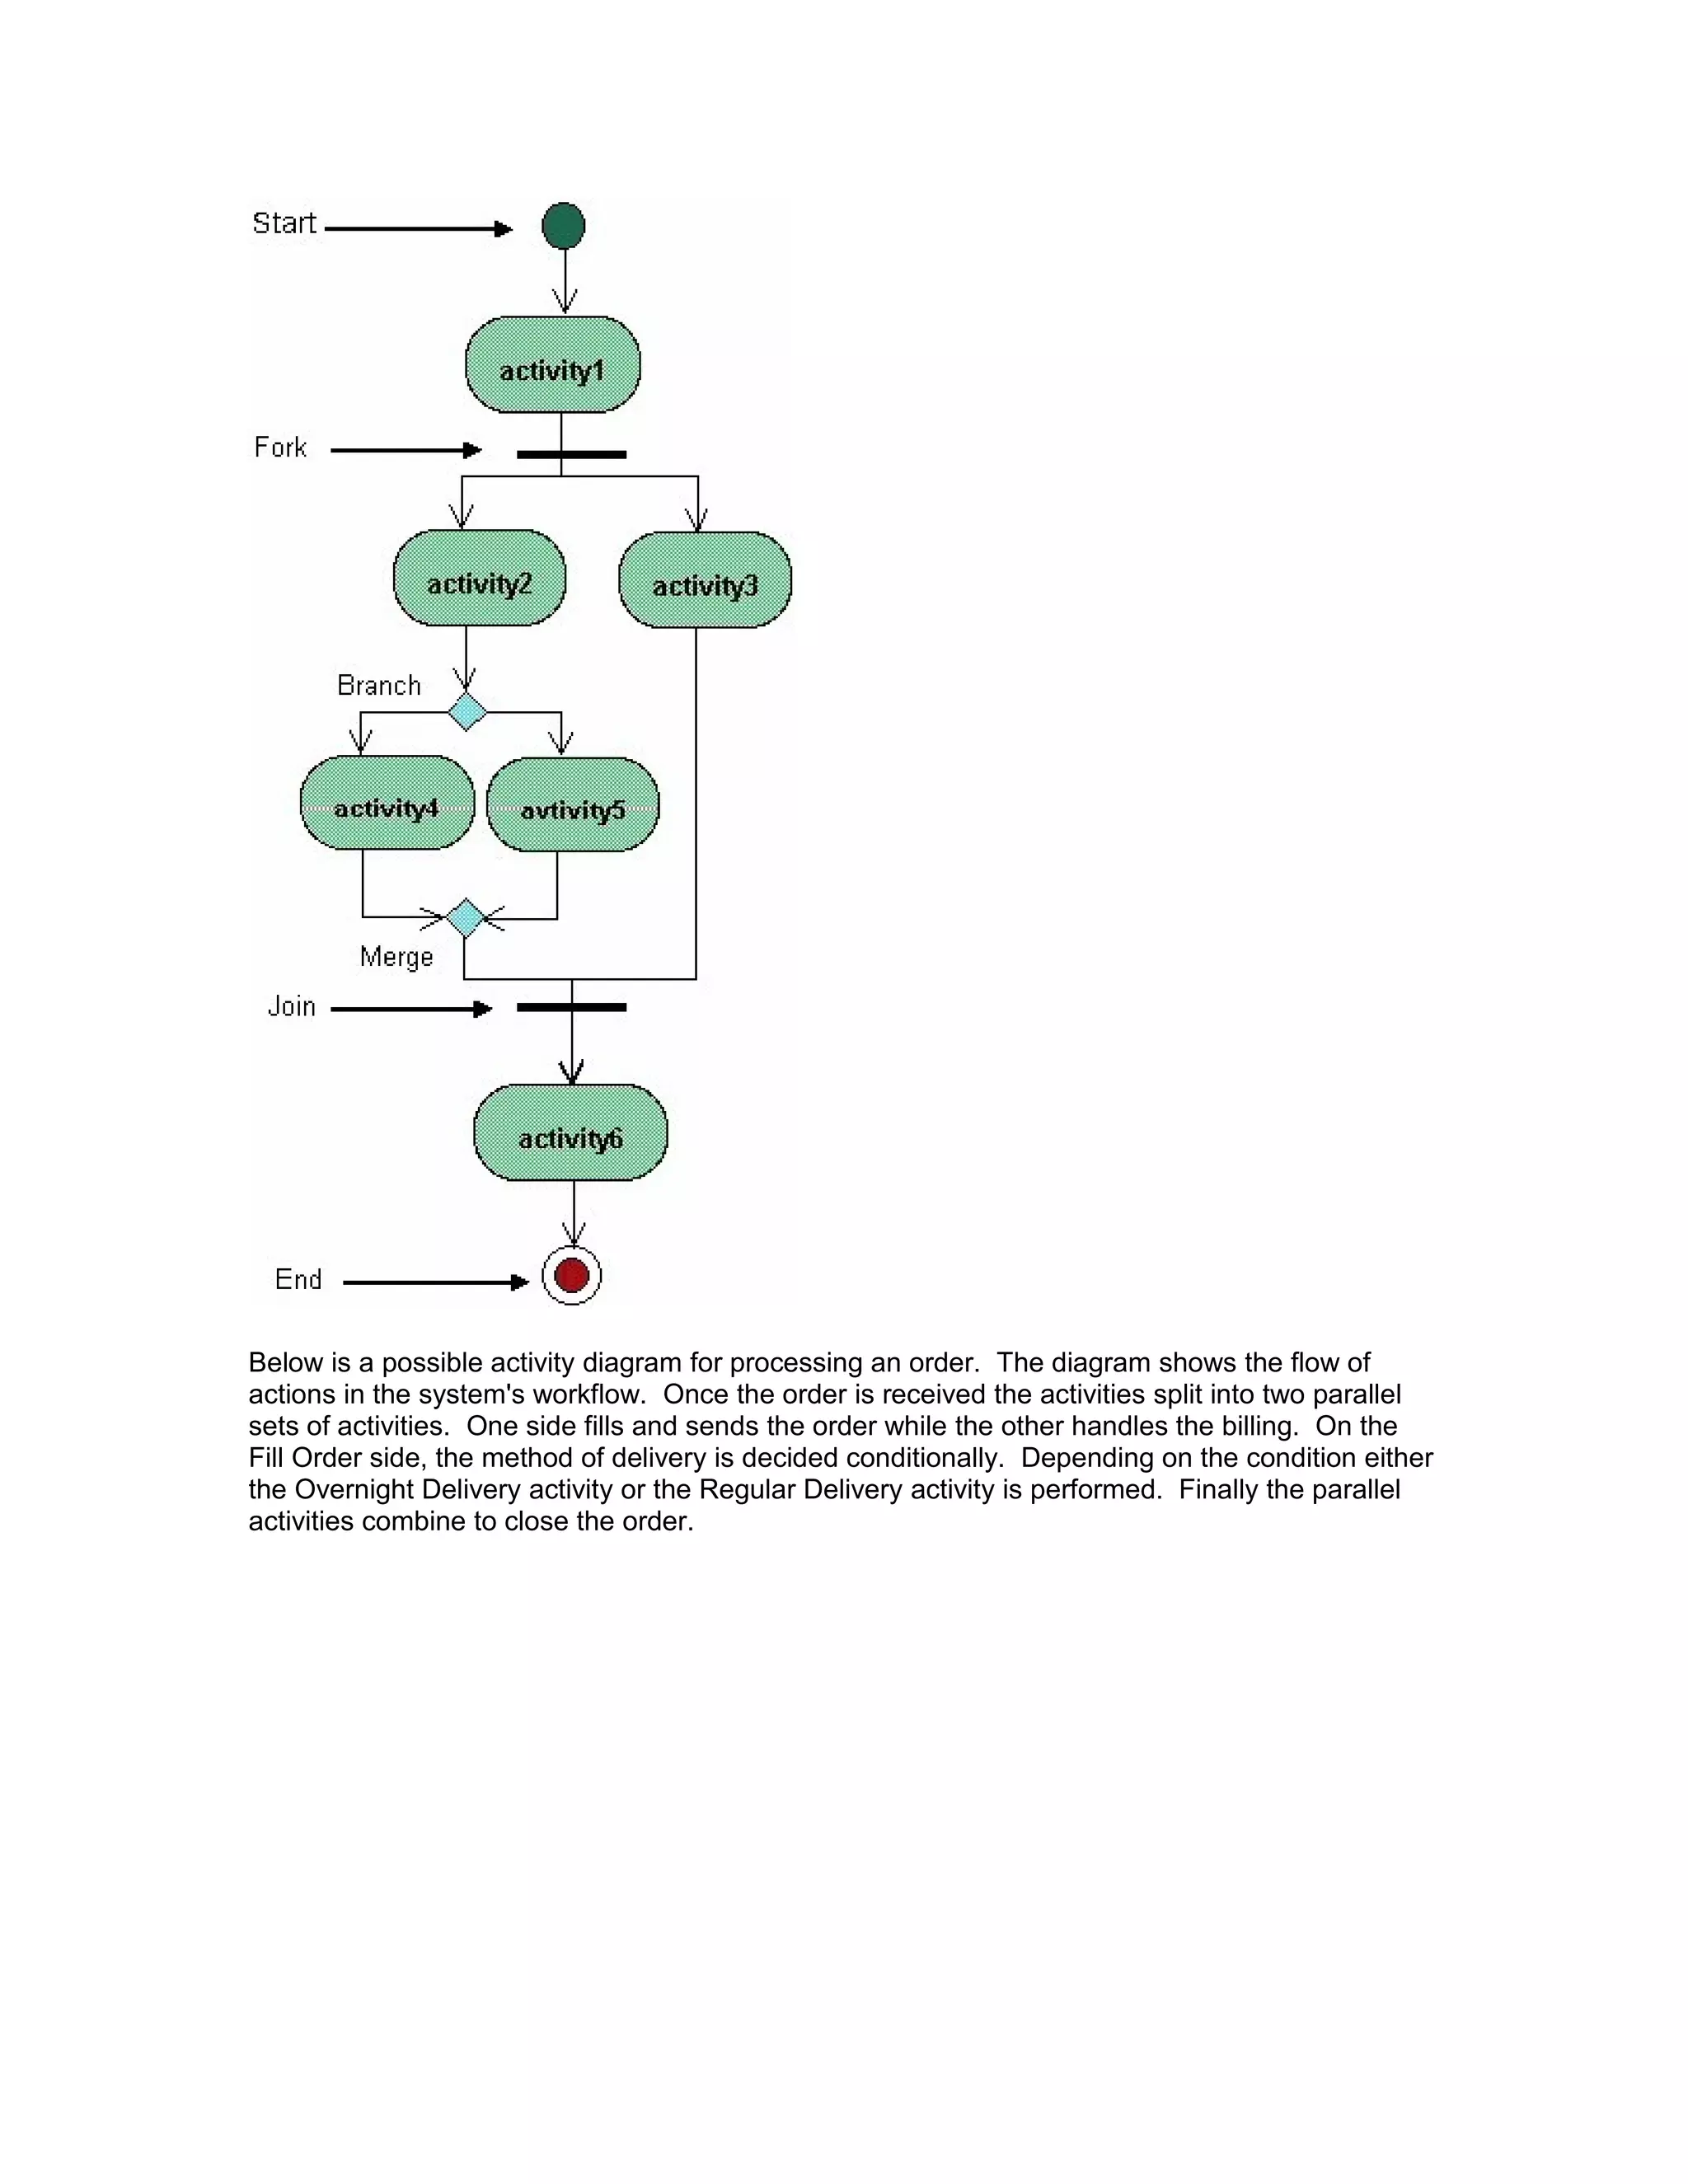
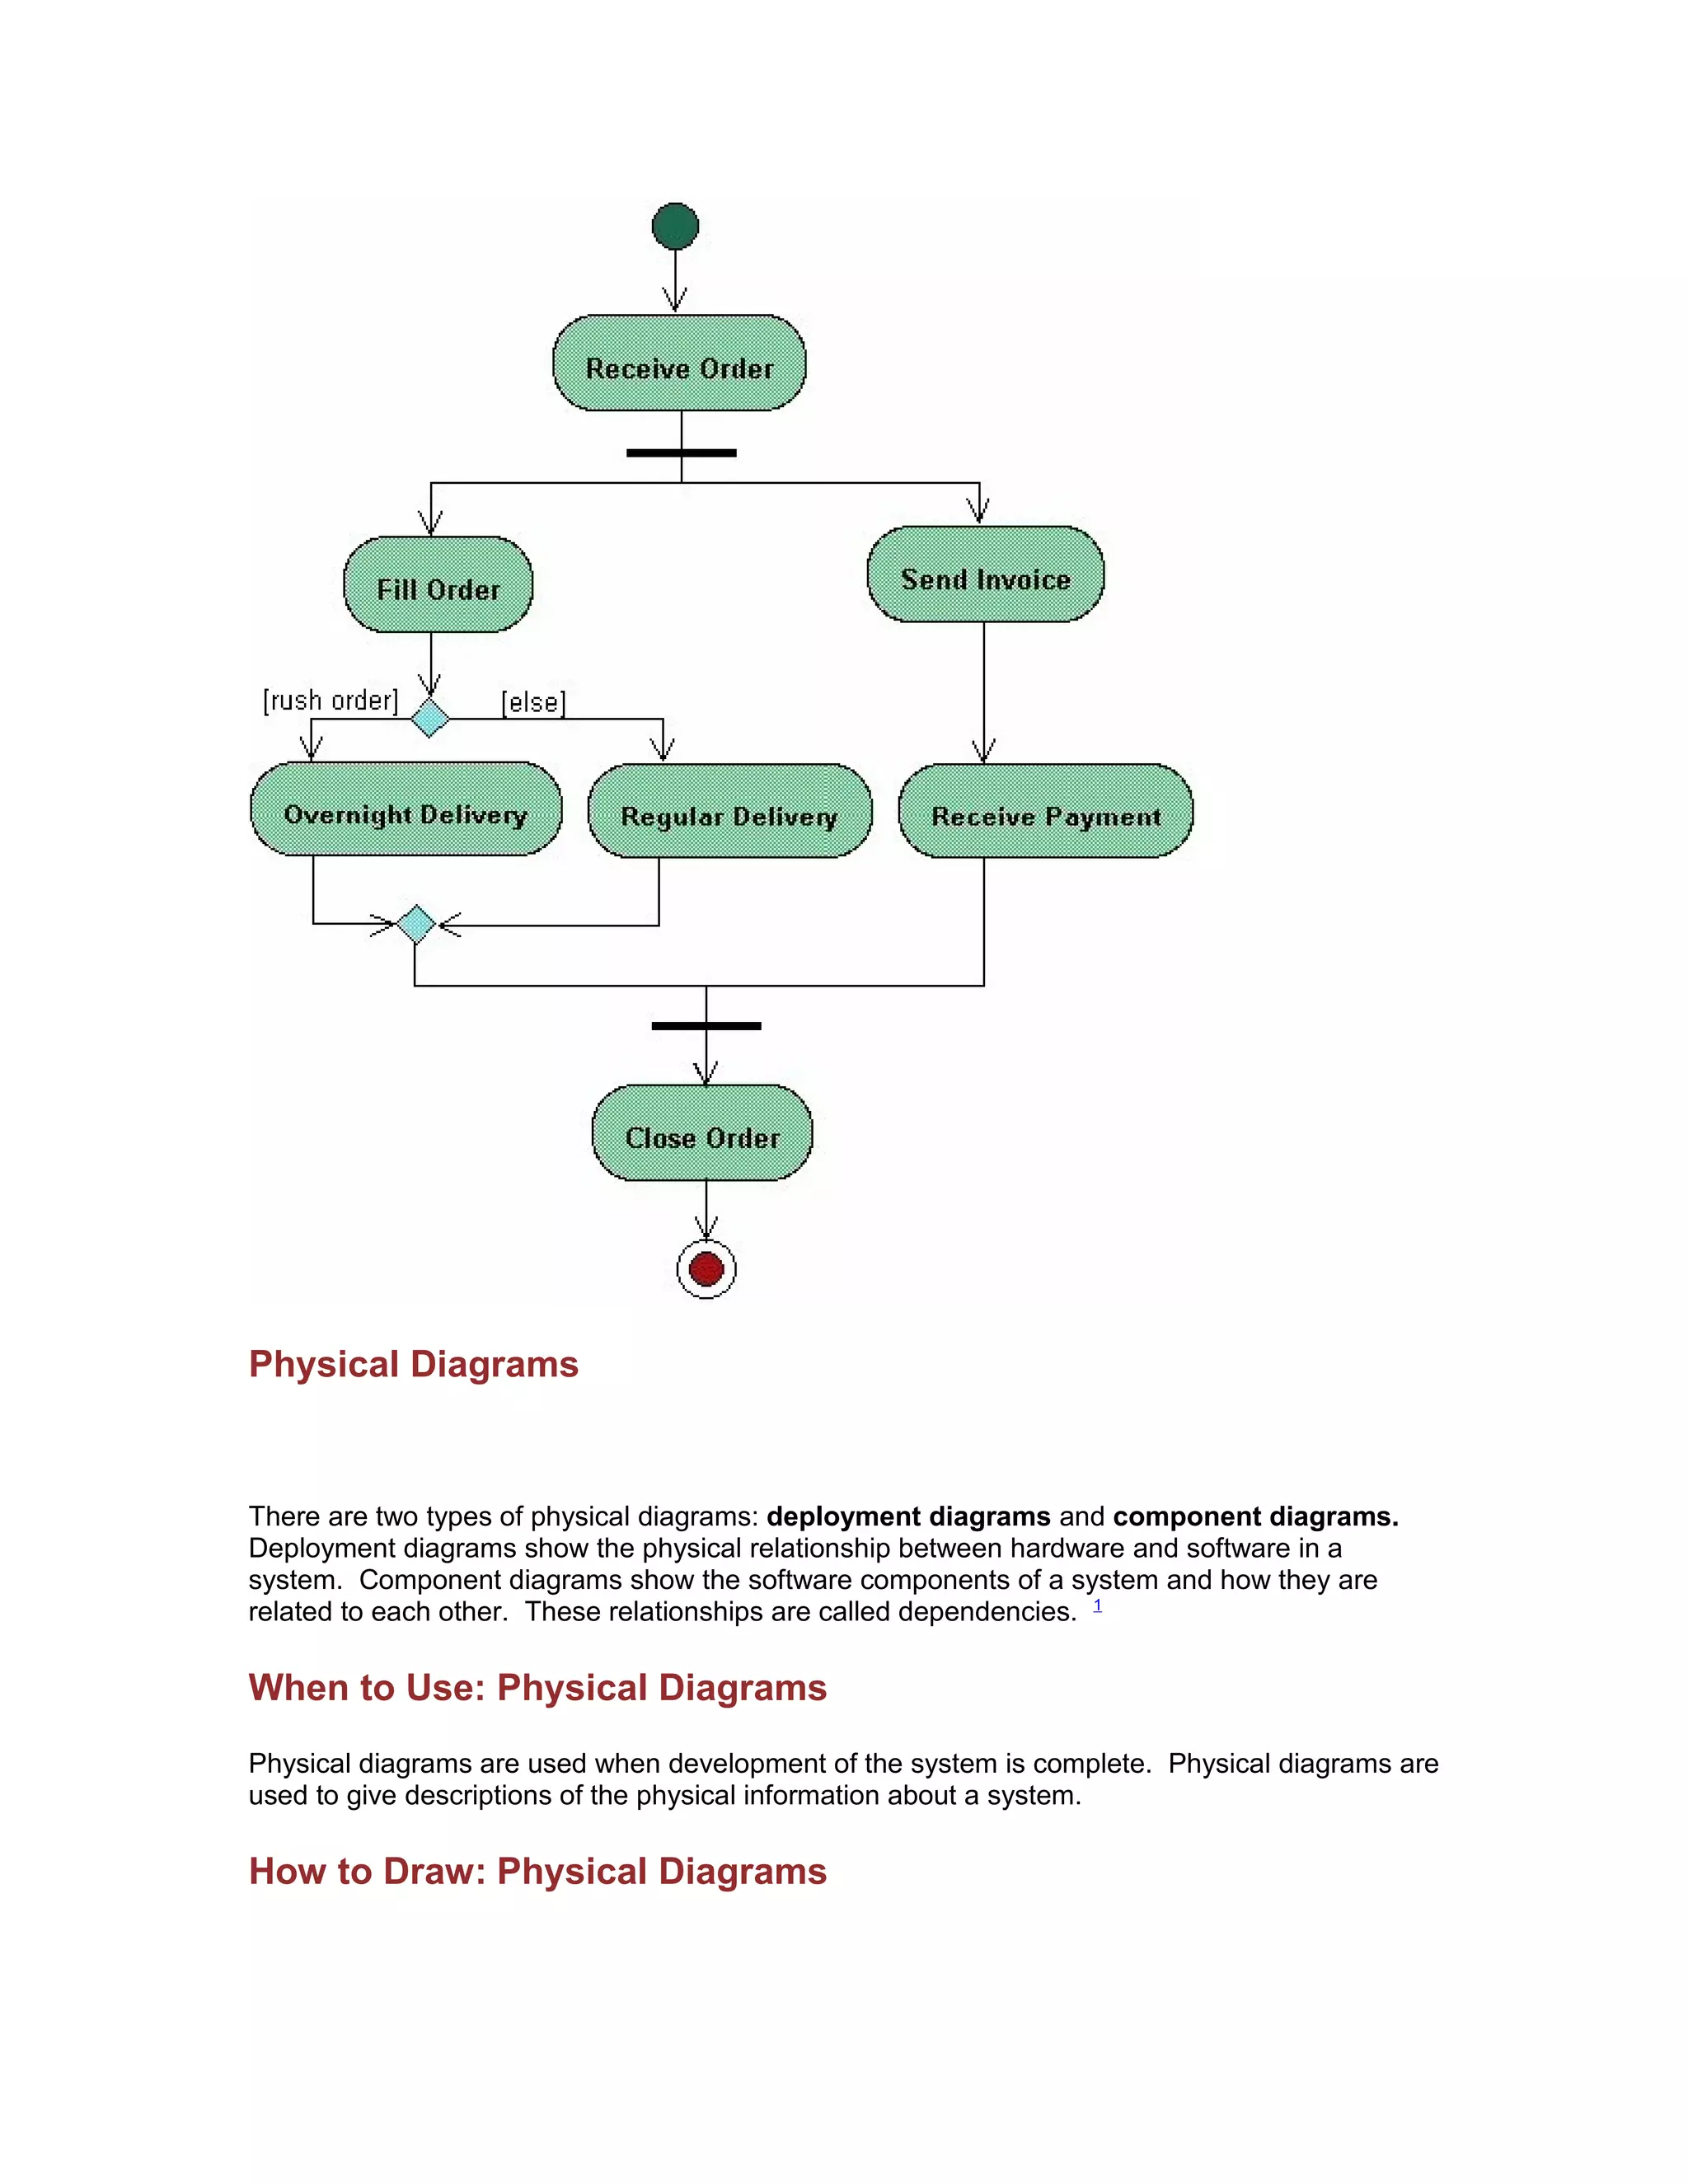
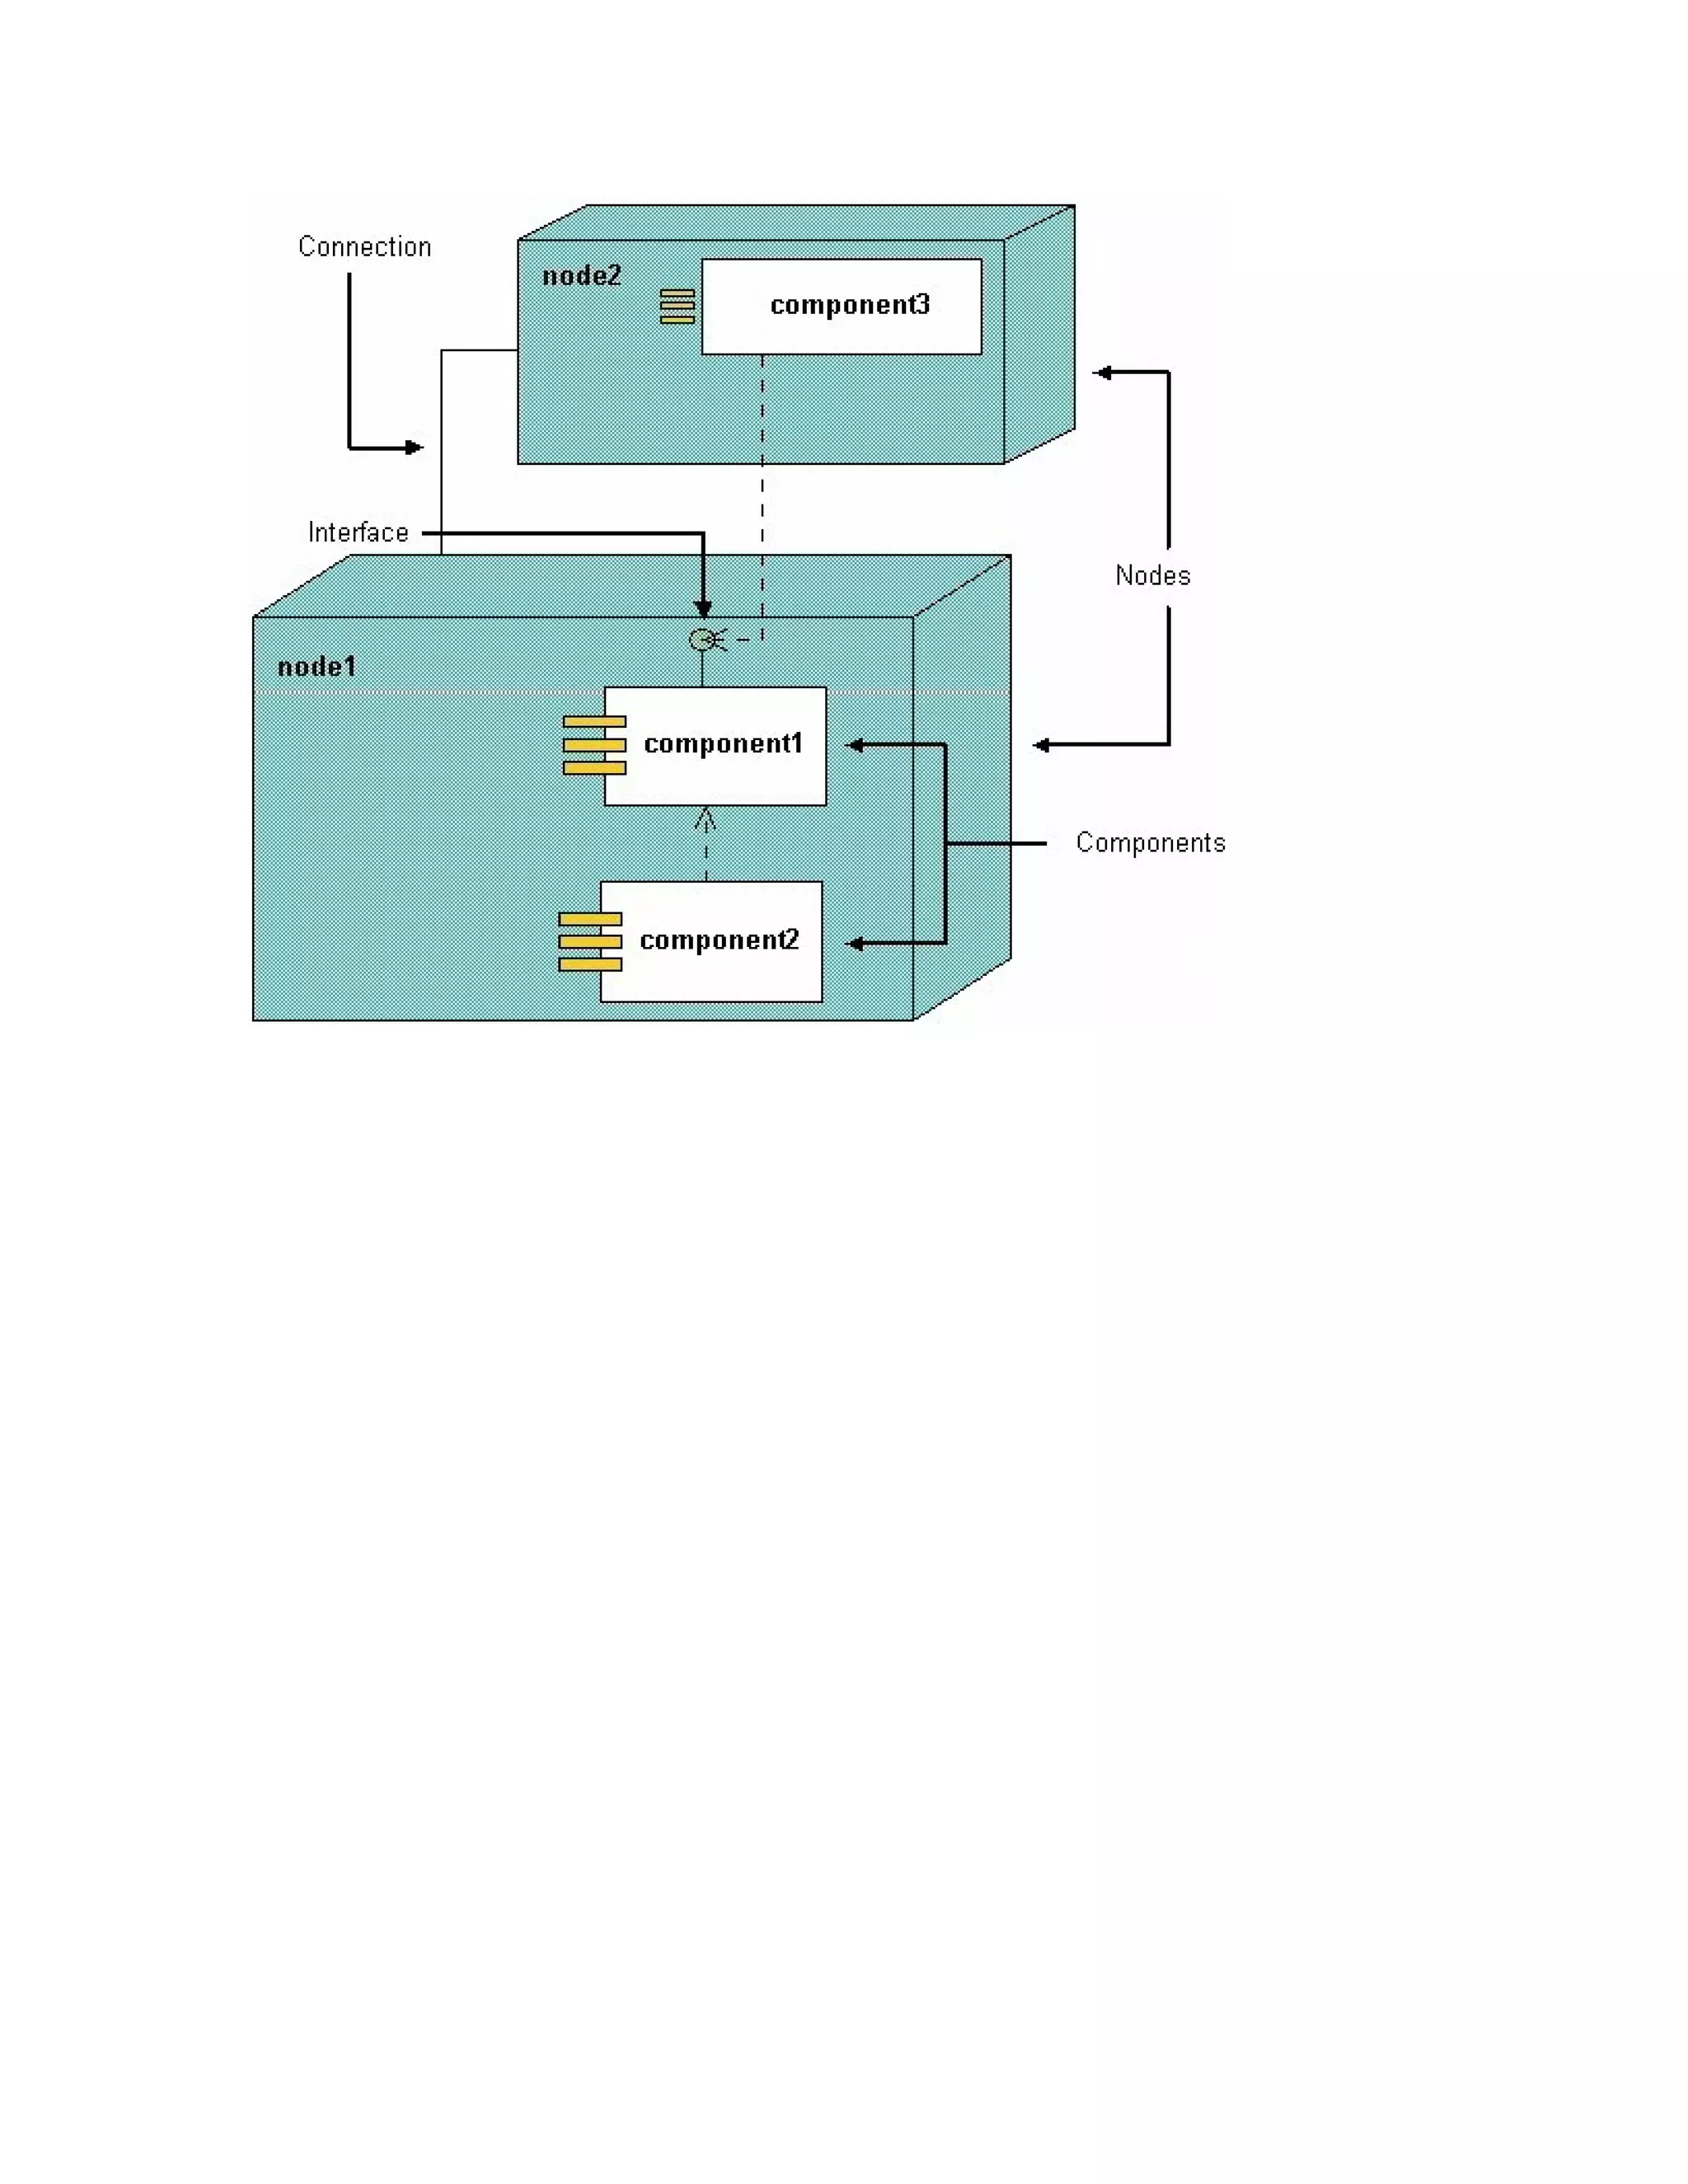

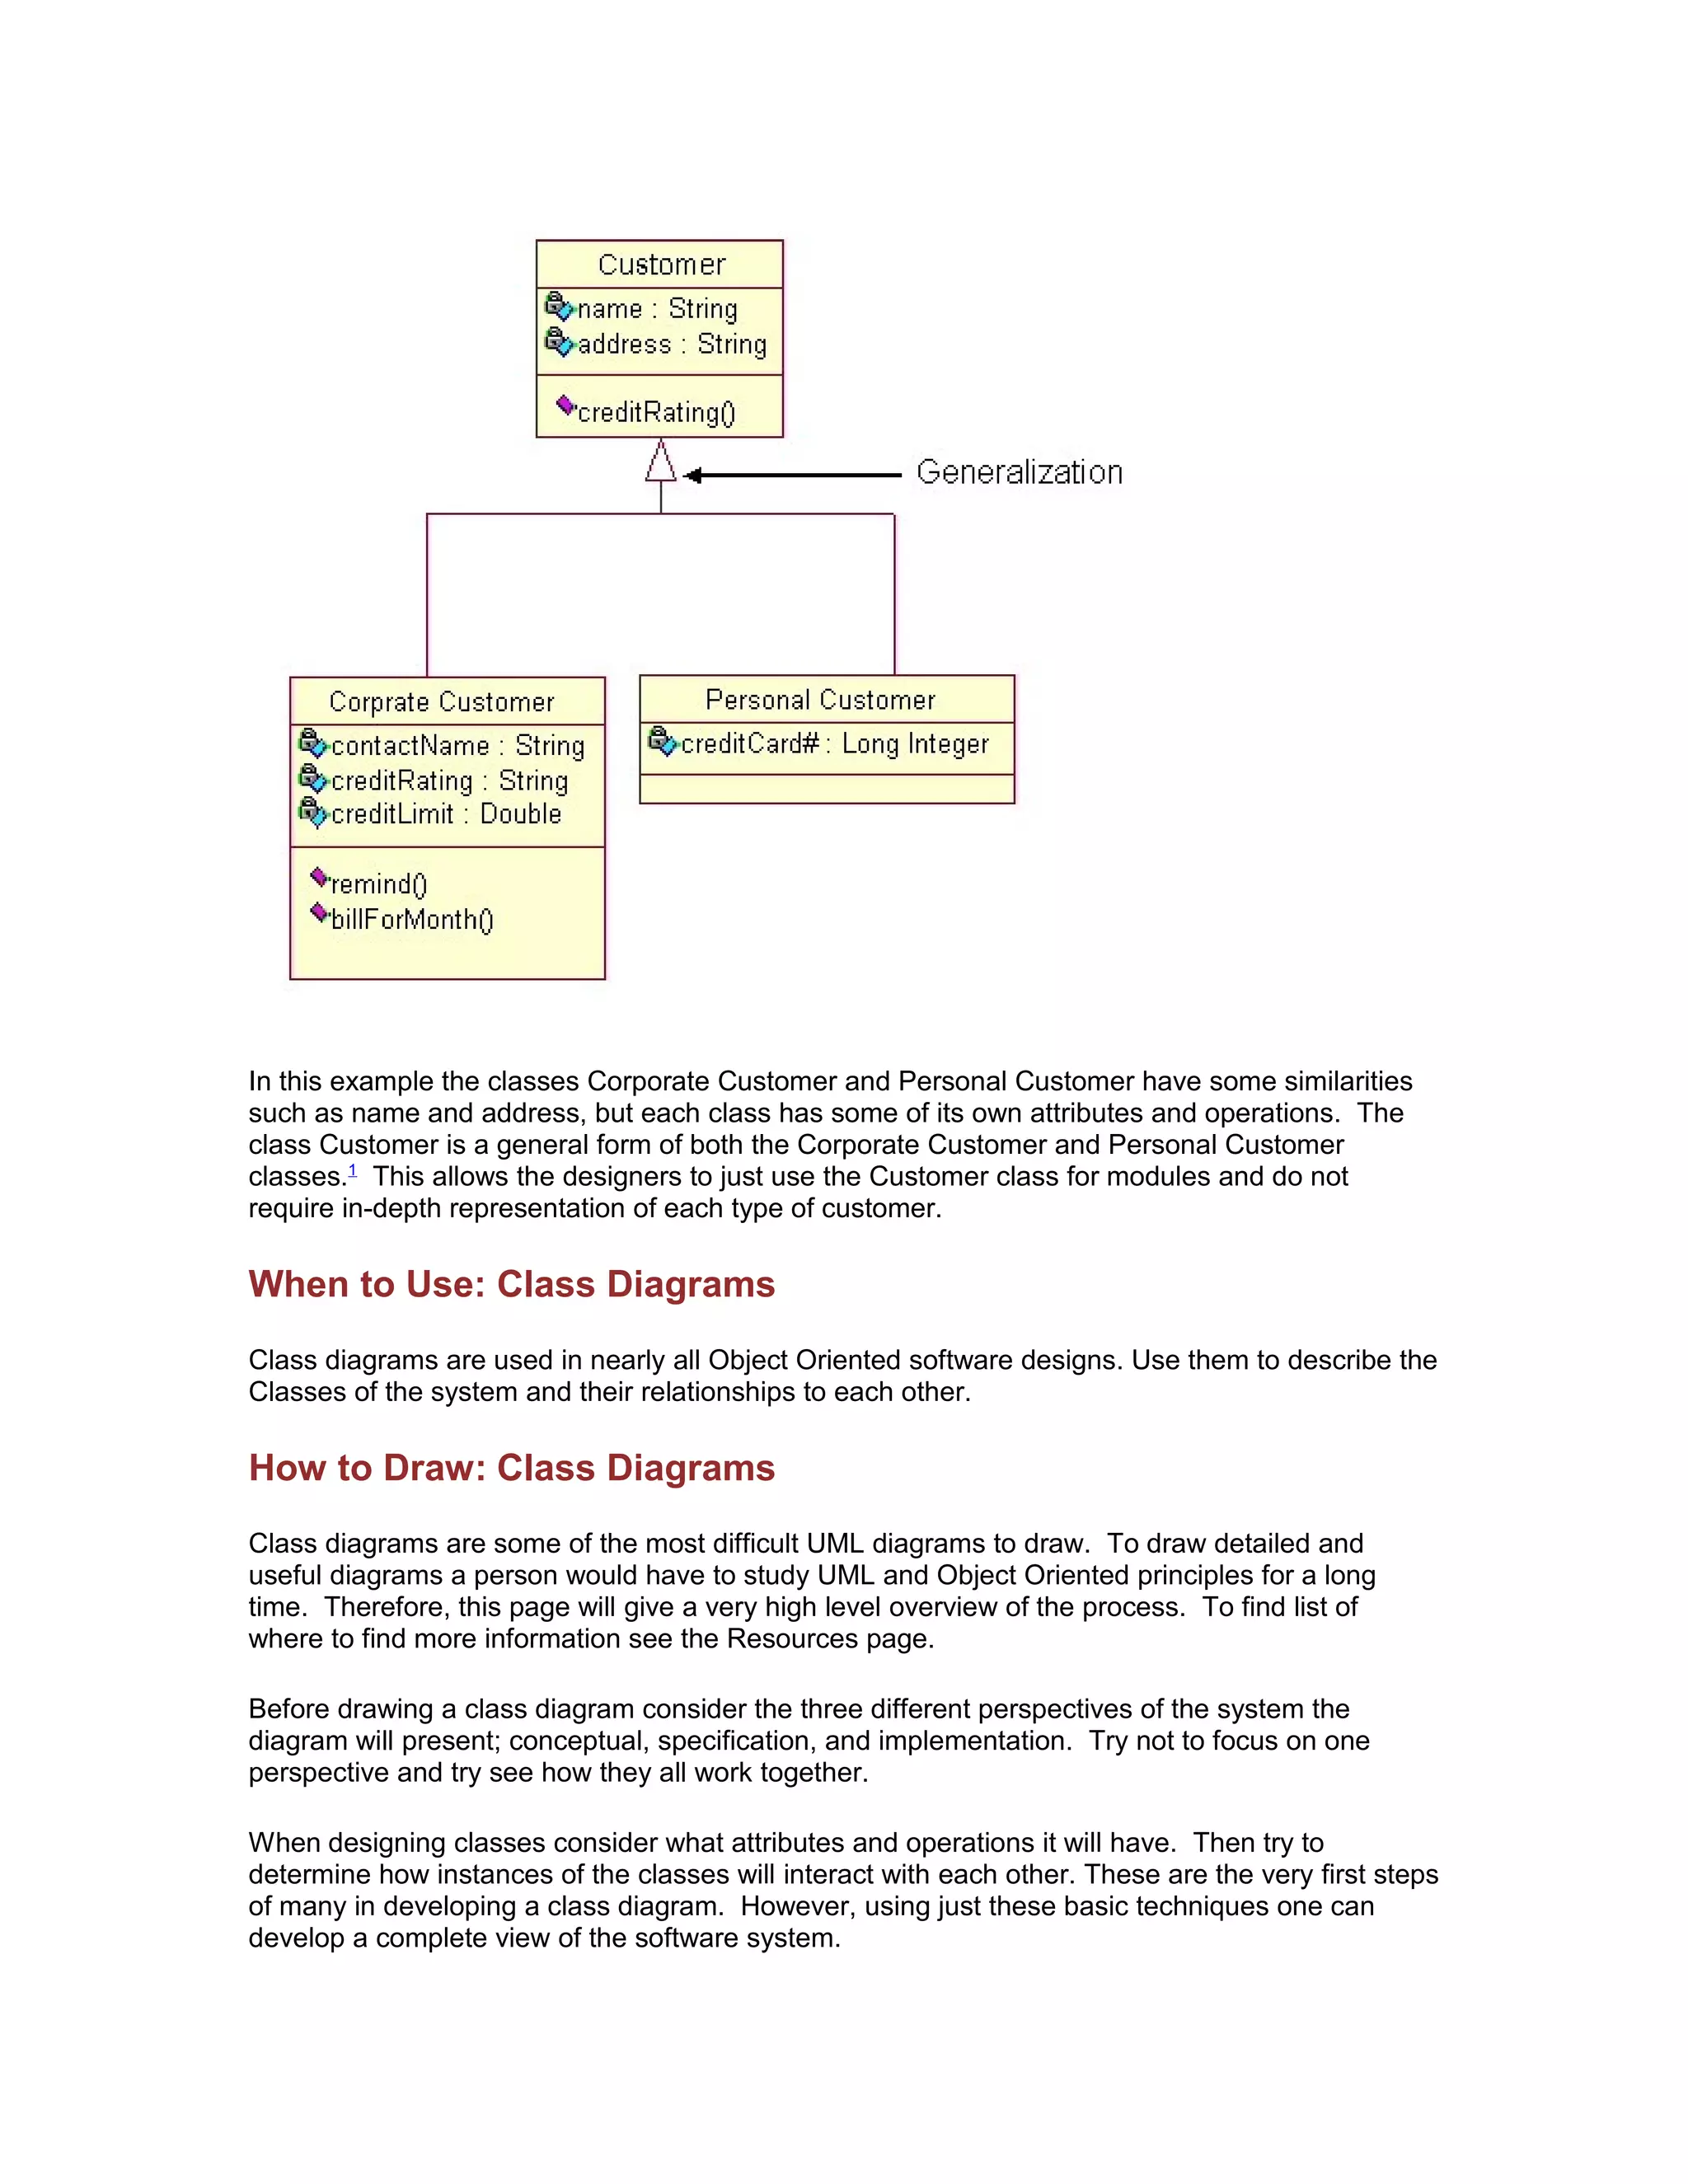
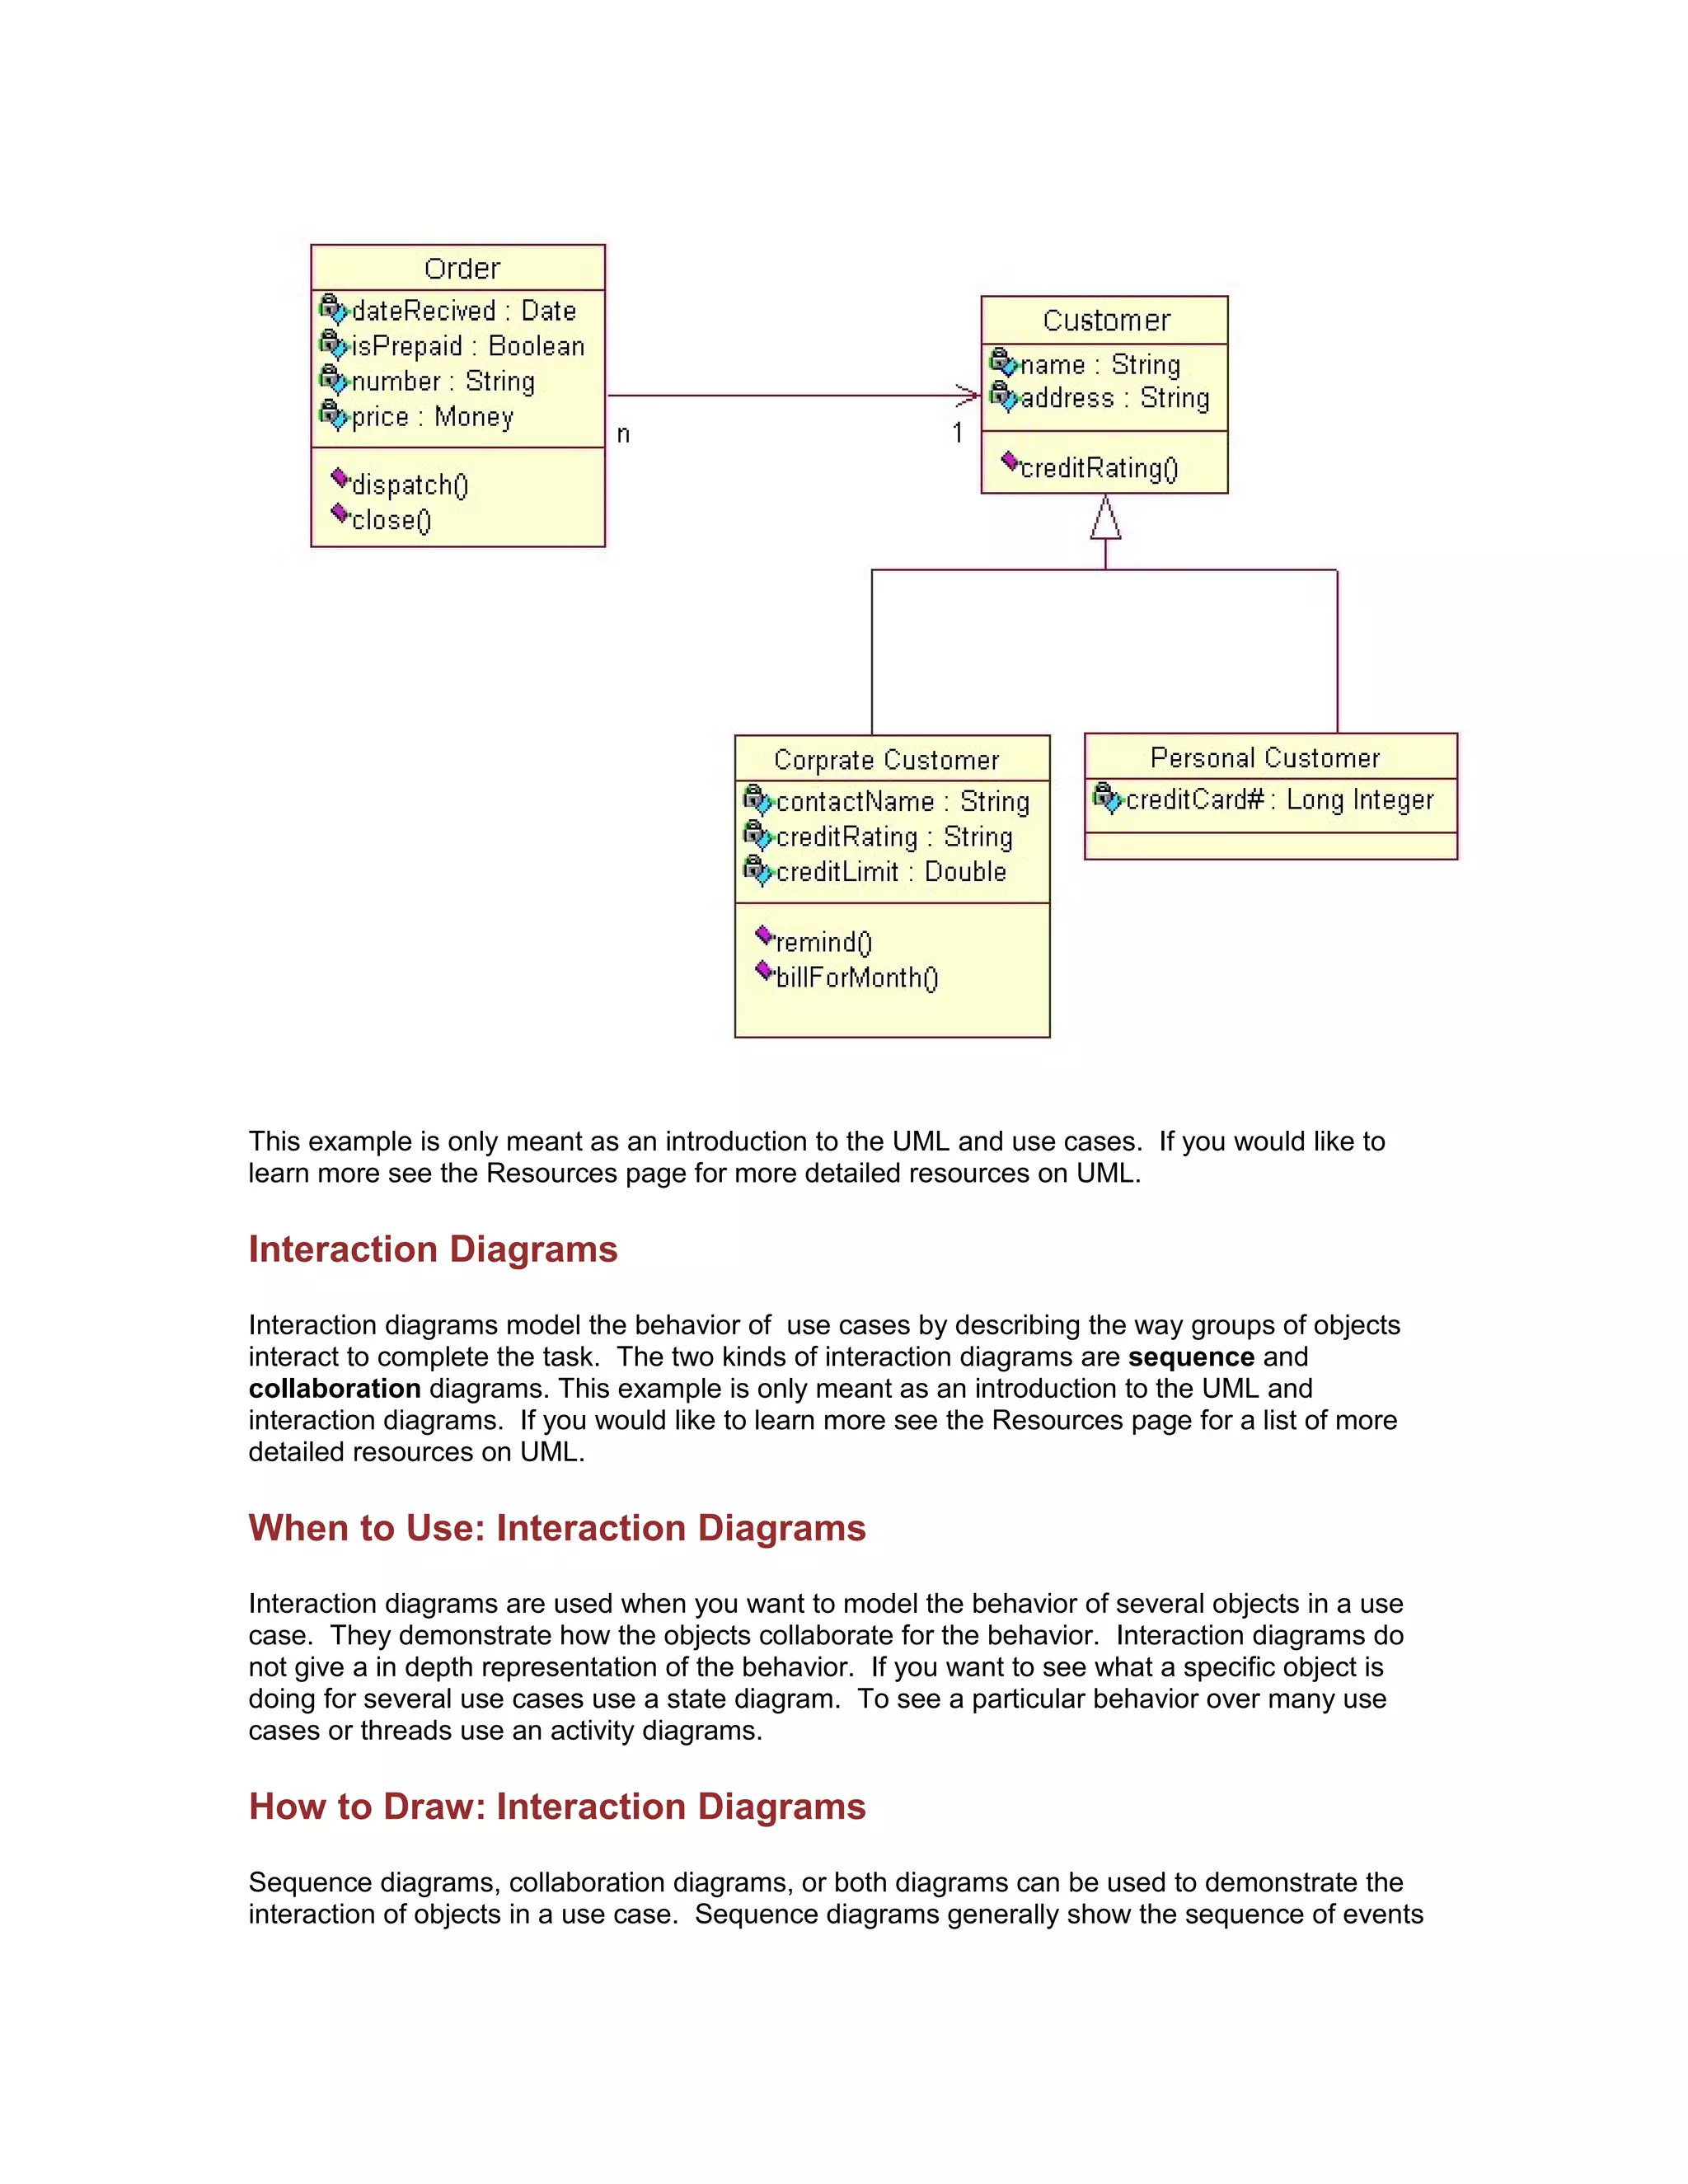
The document provides information about UML (Unified Modeling Language), including its goals, why it is used, and common diagram types. UML is a standard language for specifying, visualizing, and documenting software systems and other non-software systems. It uses mostly graphical notations to express the design of software projects. Common UML diagram types include use case diagrams, class diagrams, interaction diagrams, state diagrams, activity diagrams, component diagrams, and deployment diagrams. Each diagram type displays different aspects of a system and can be used at various stages of development.


![Vibe Coding vs. Spec-Driven Development [Free Meetup]](https://cdn.slidesharecdn.com/ss_thumbnails/vibecodingvsspecdrivendevelopment-251209105622-43f455e7-thumbnail.jpg?width=640&height=640&fit=bounds)


