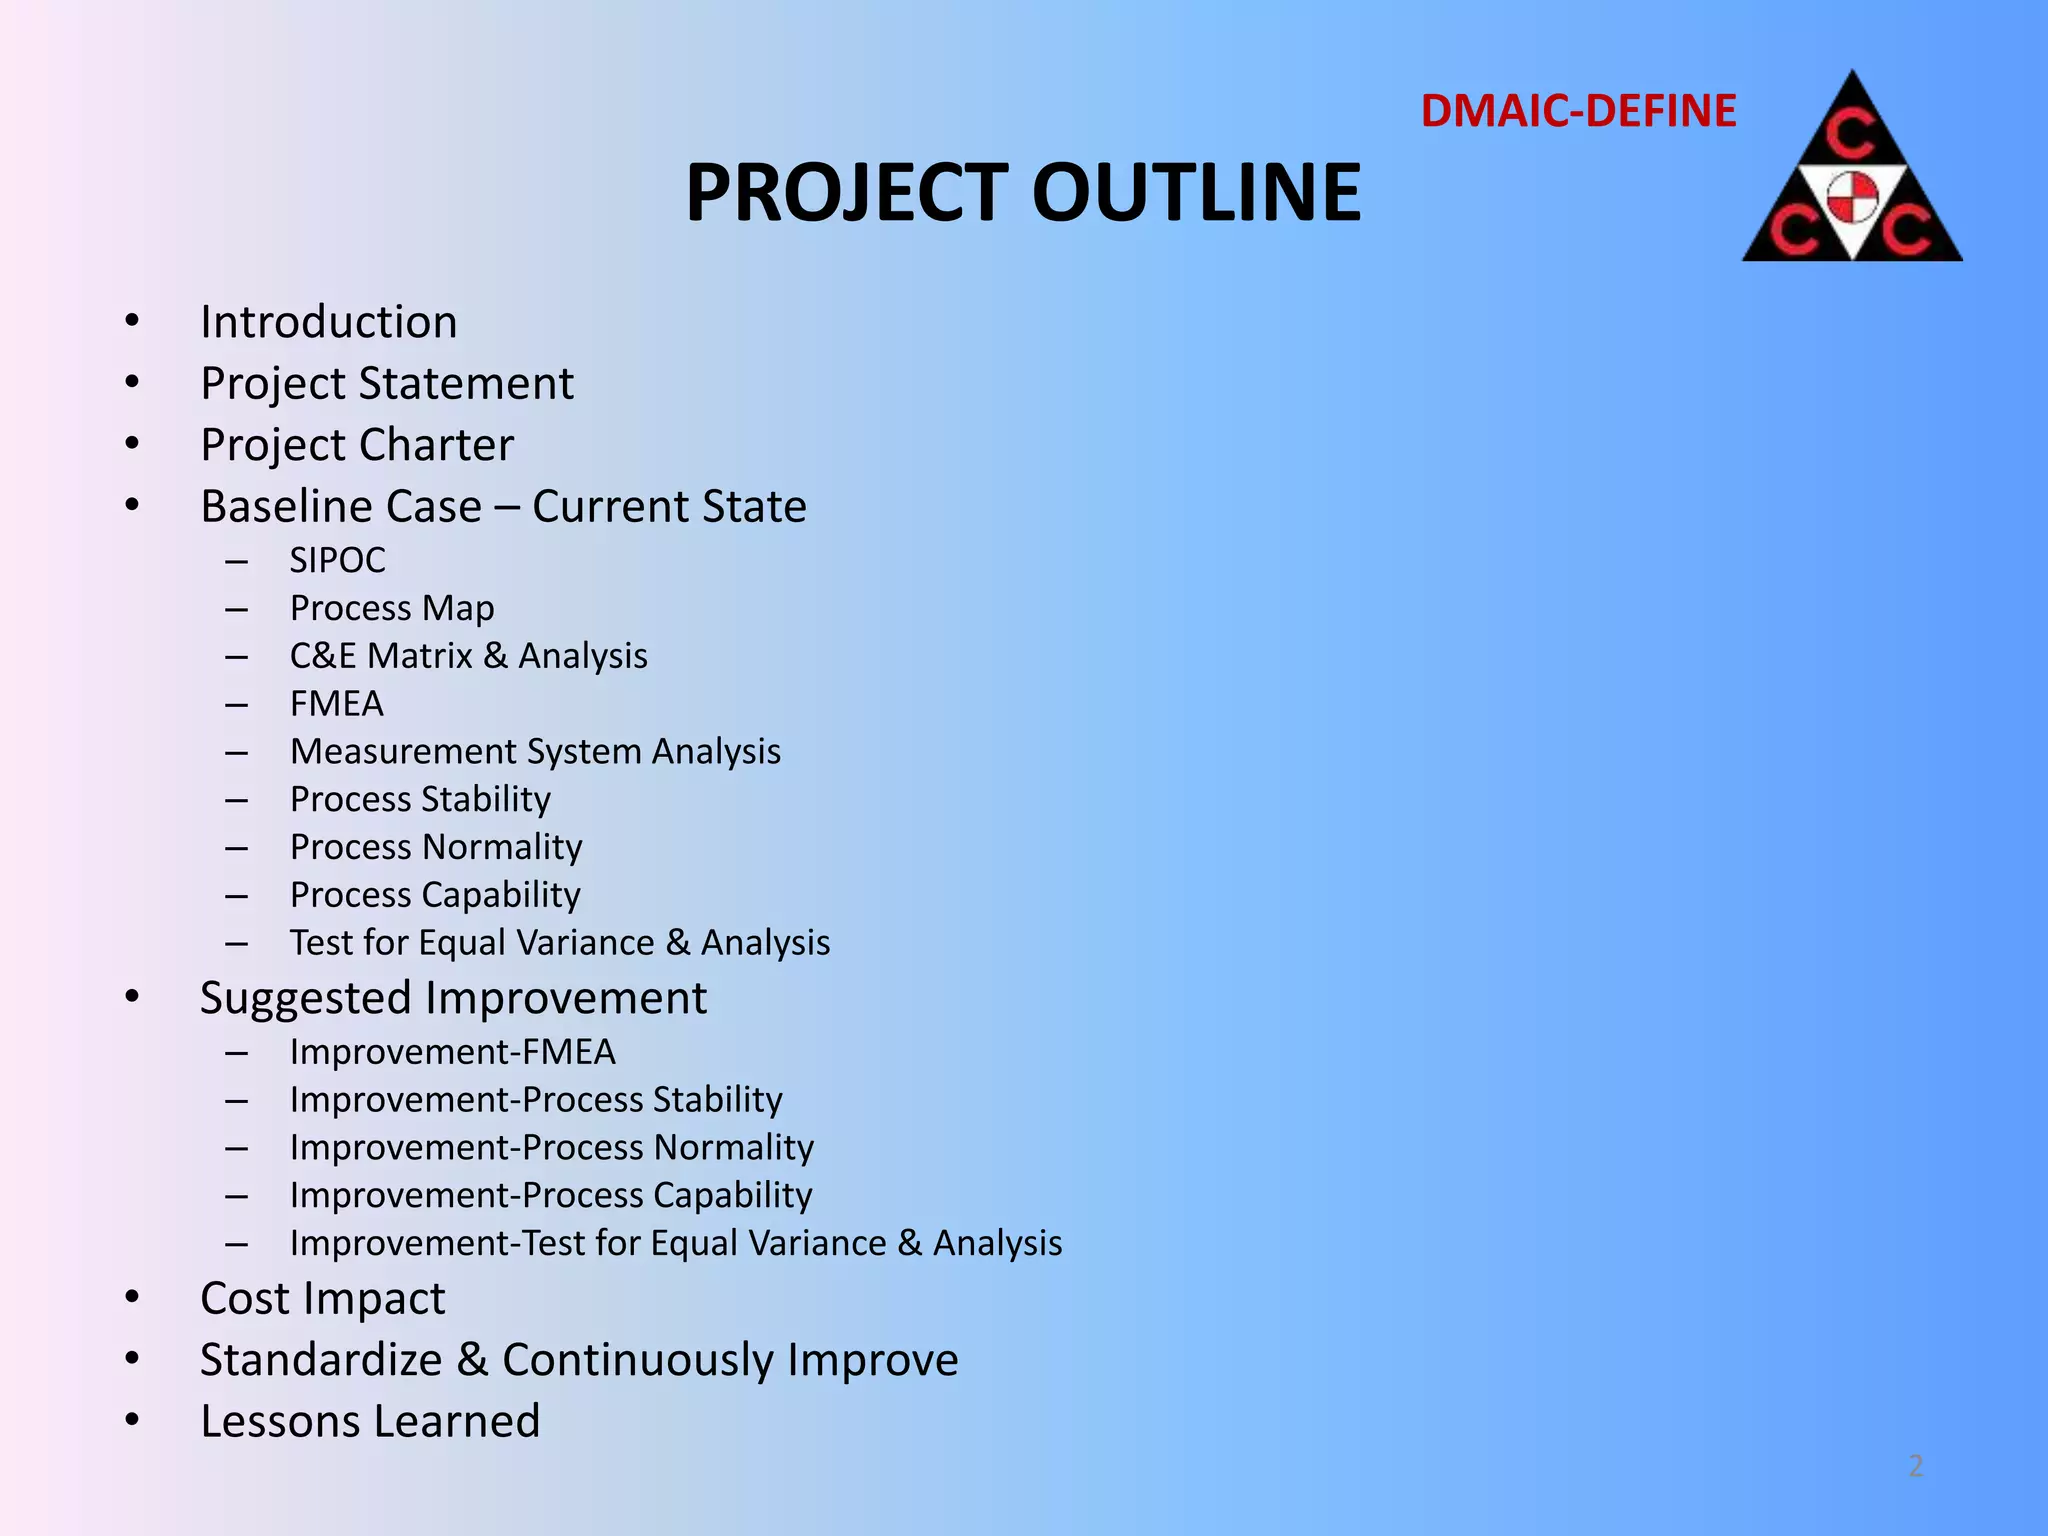
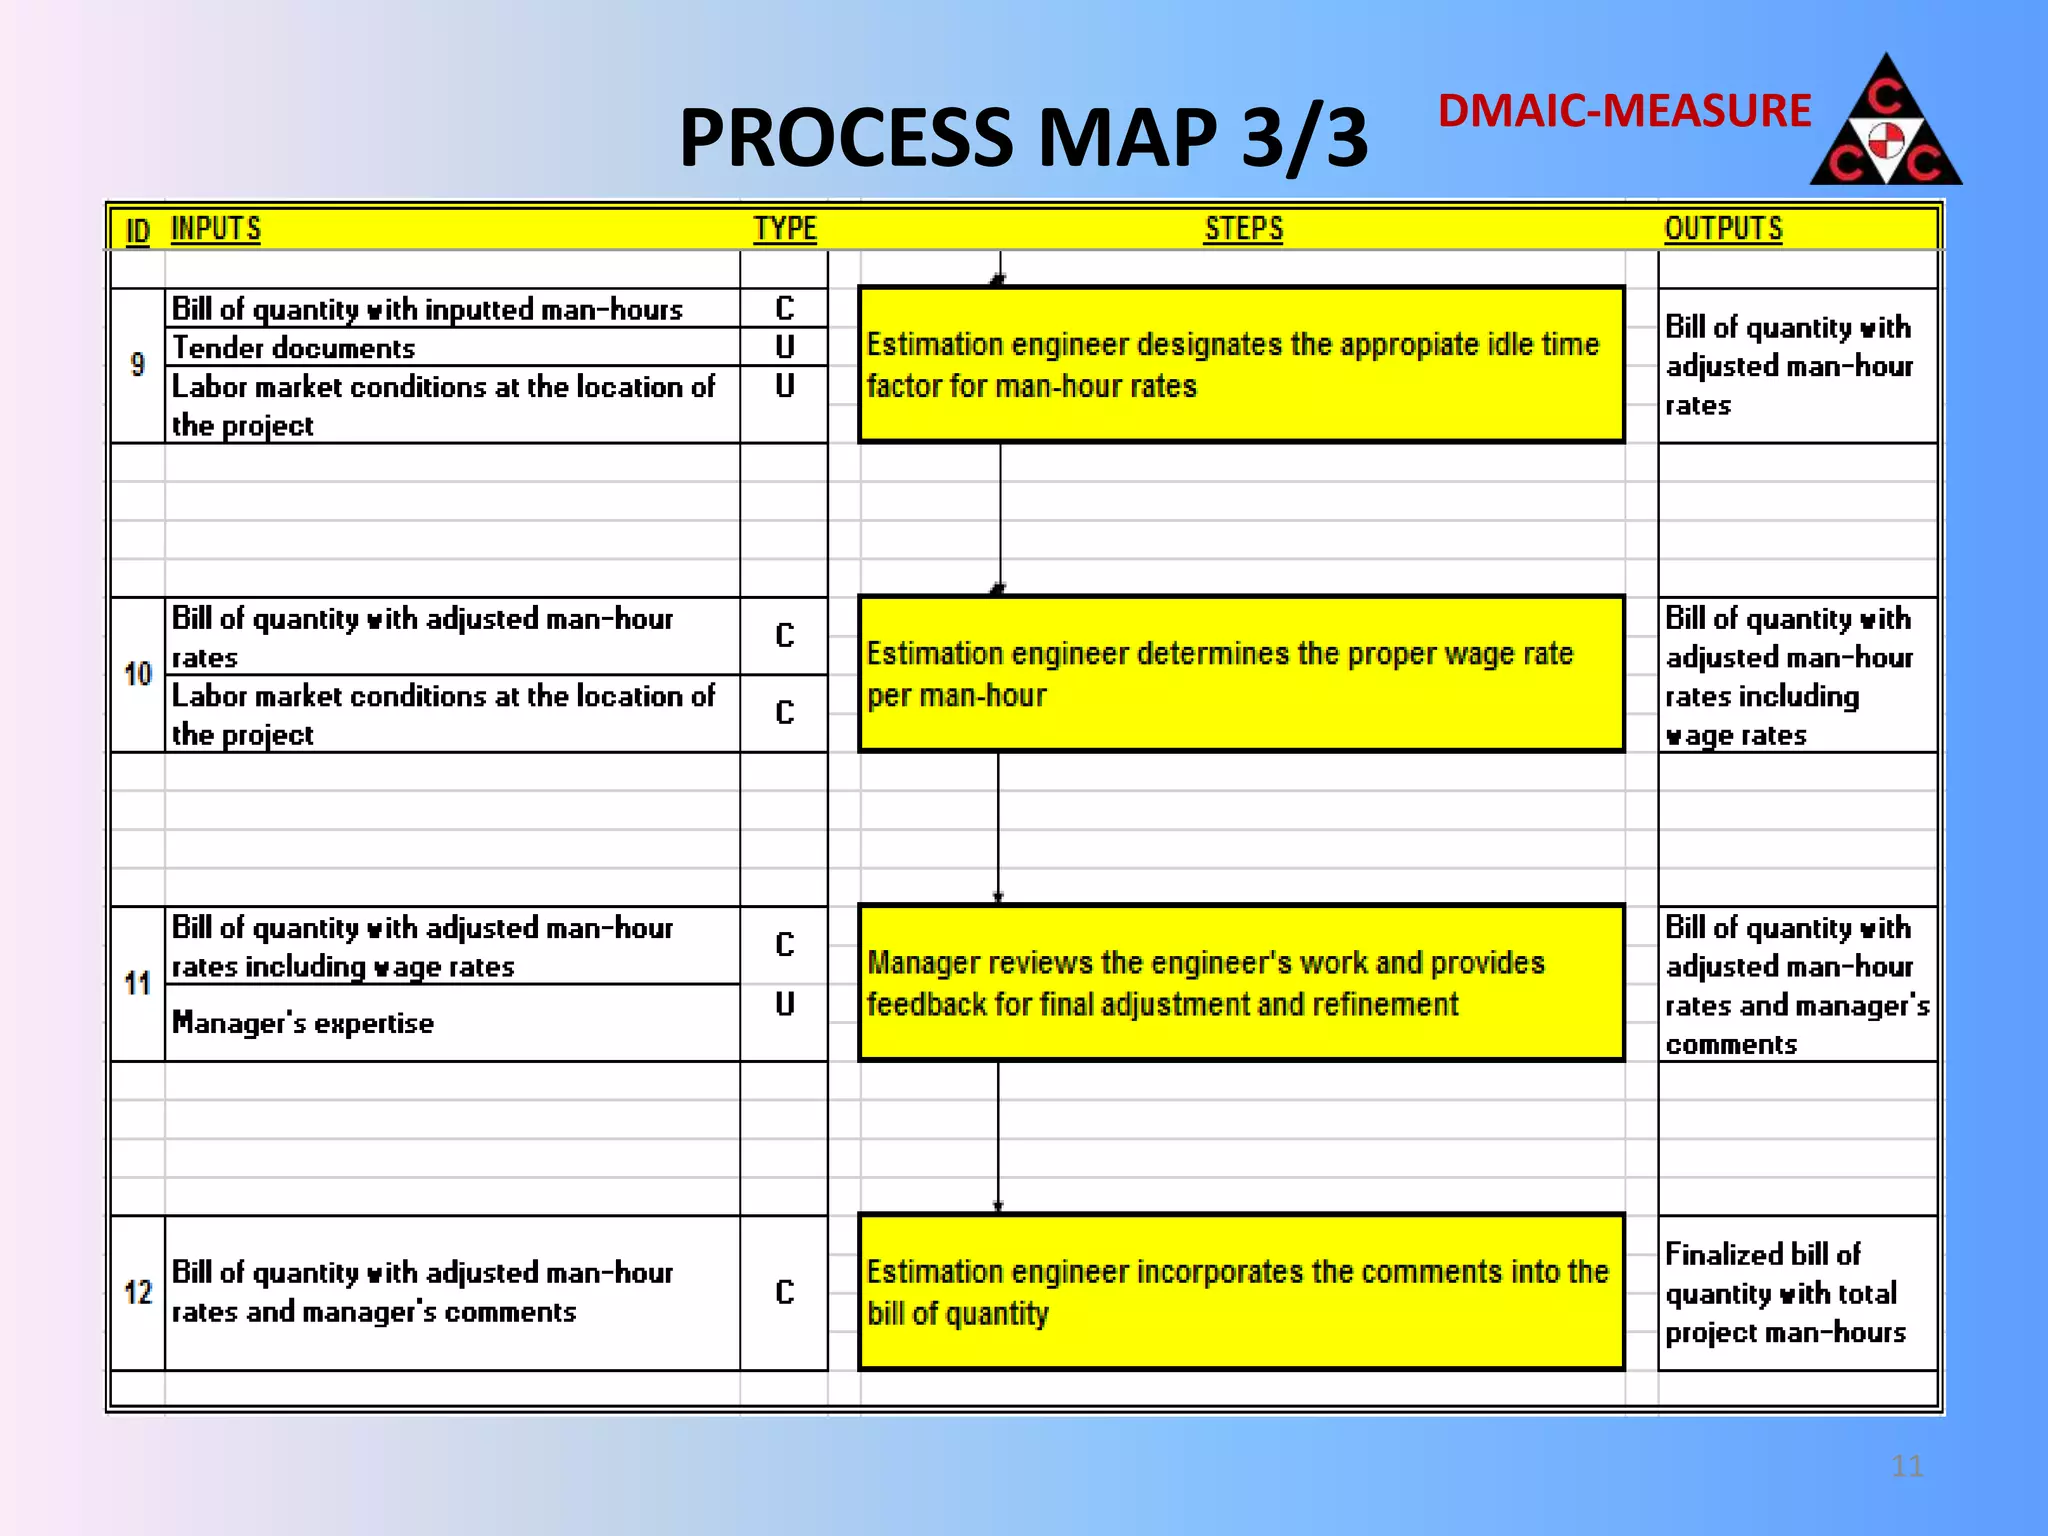
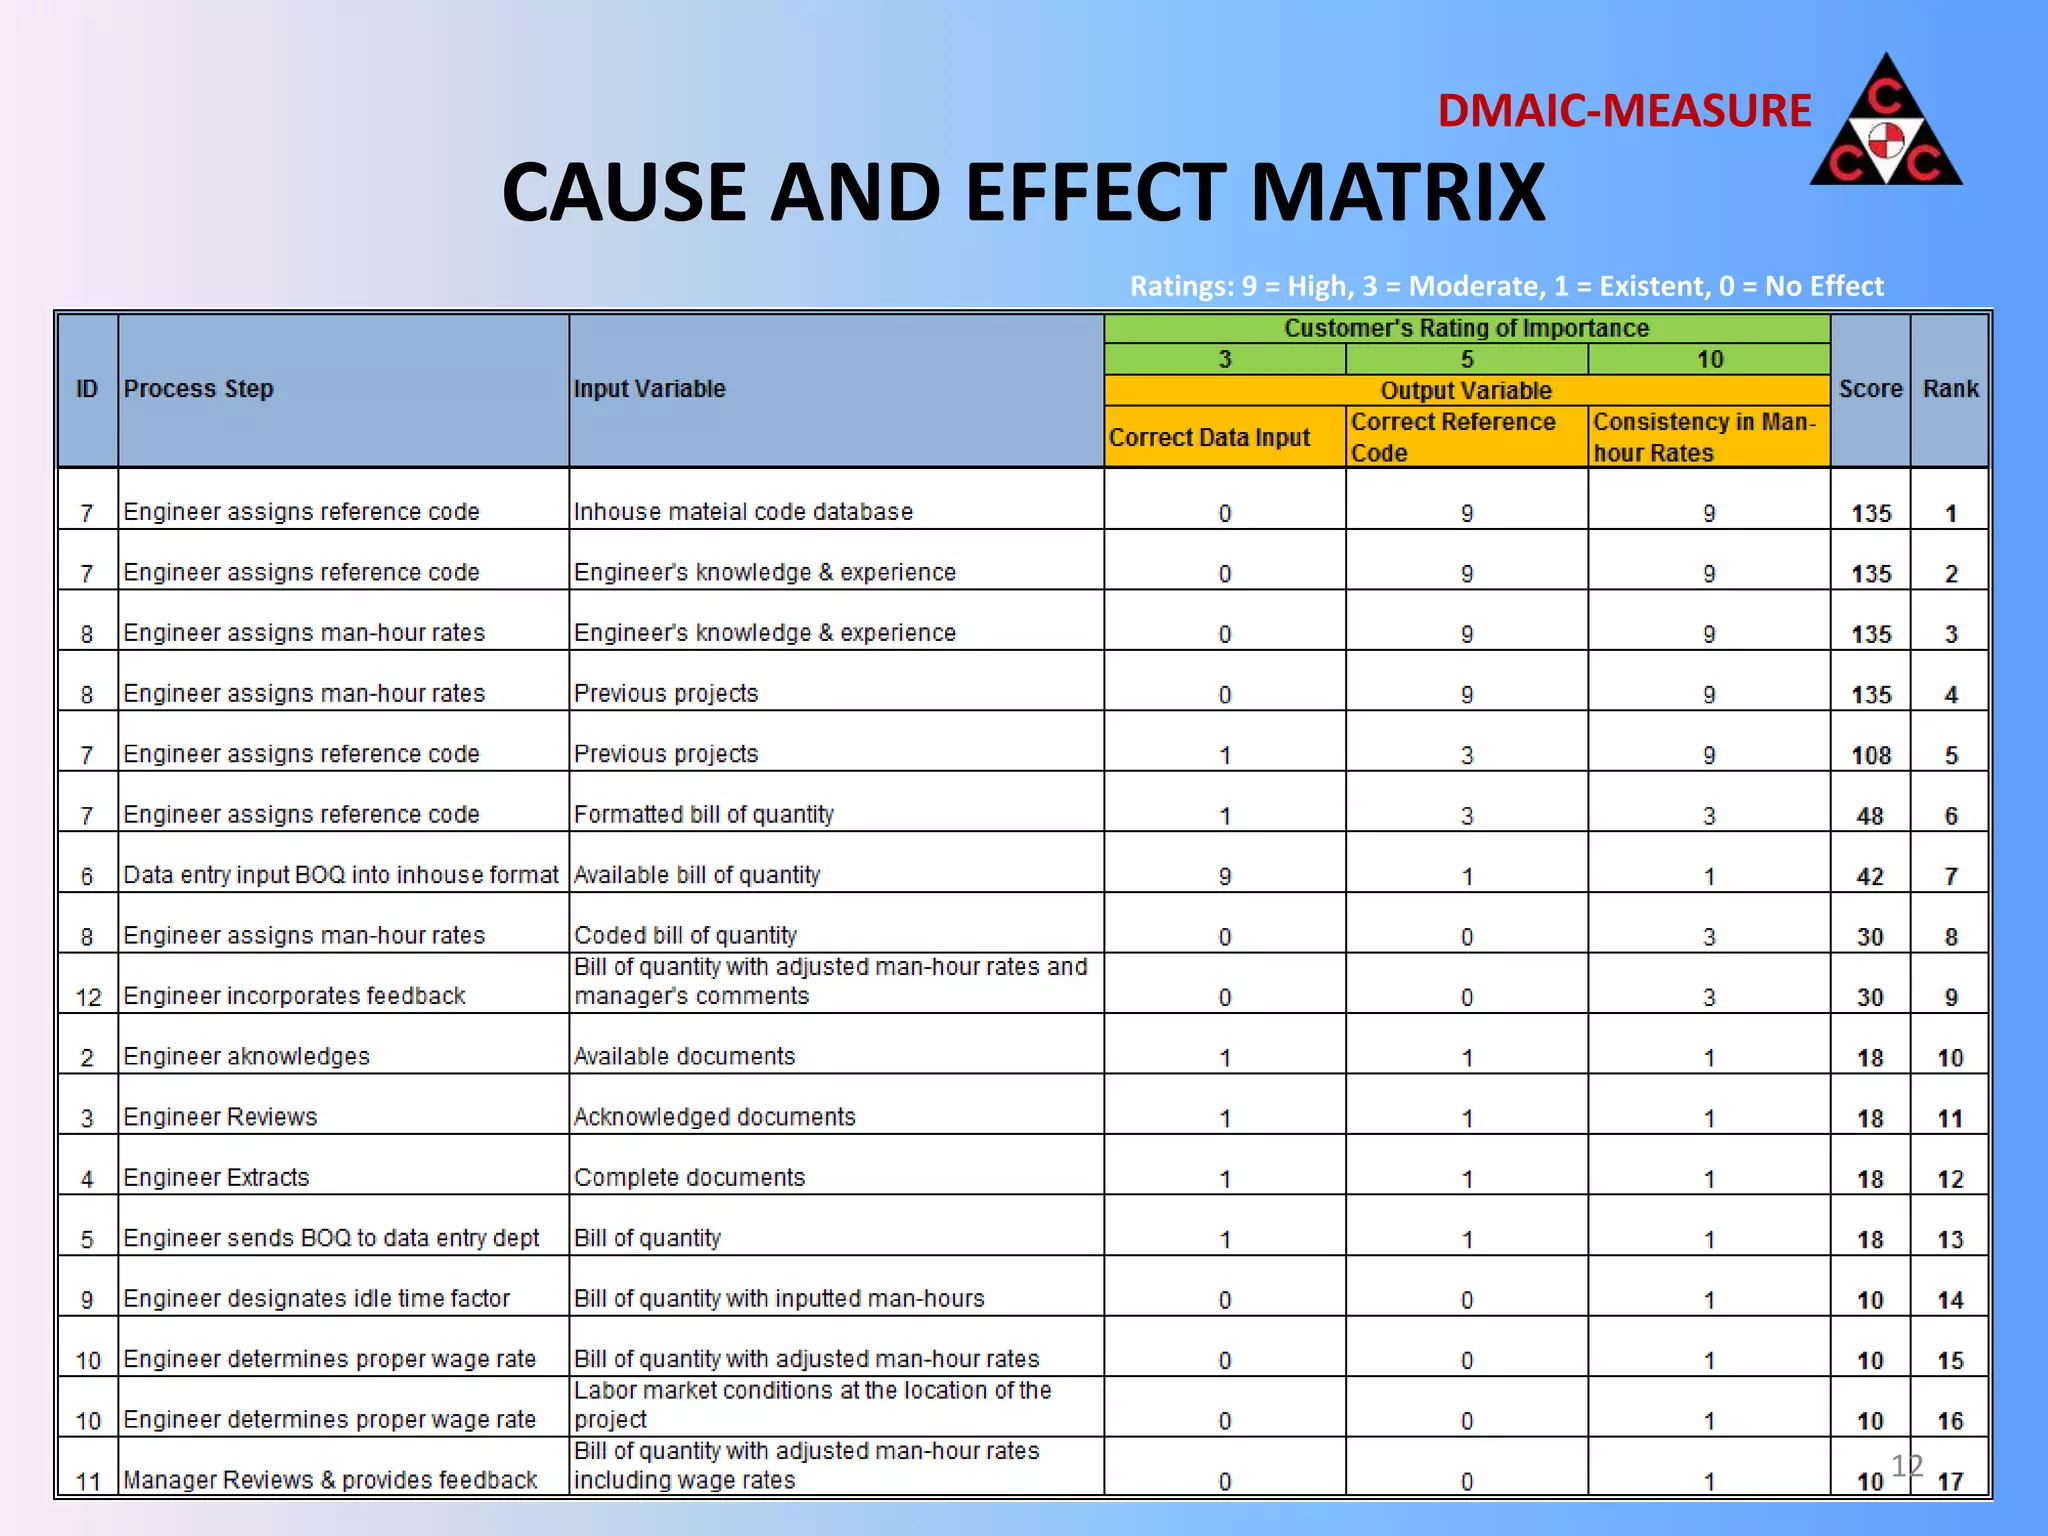
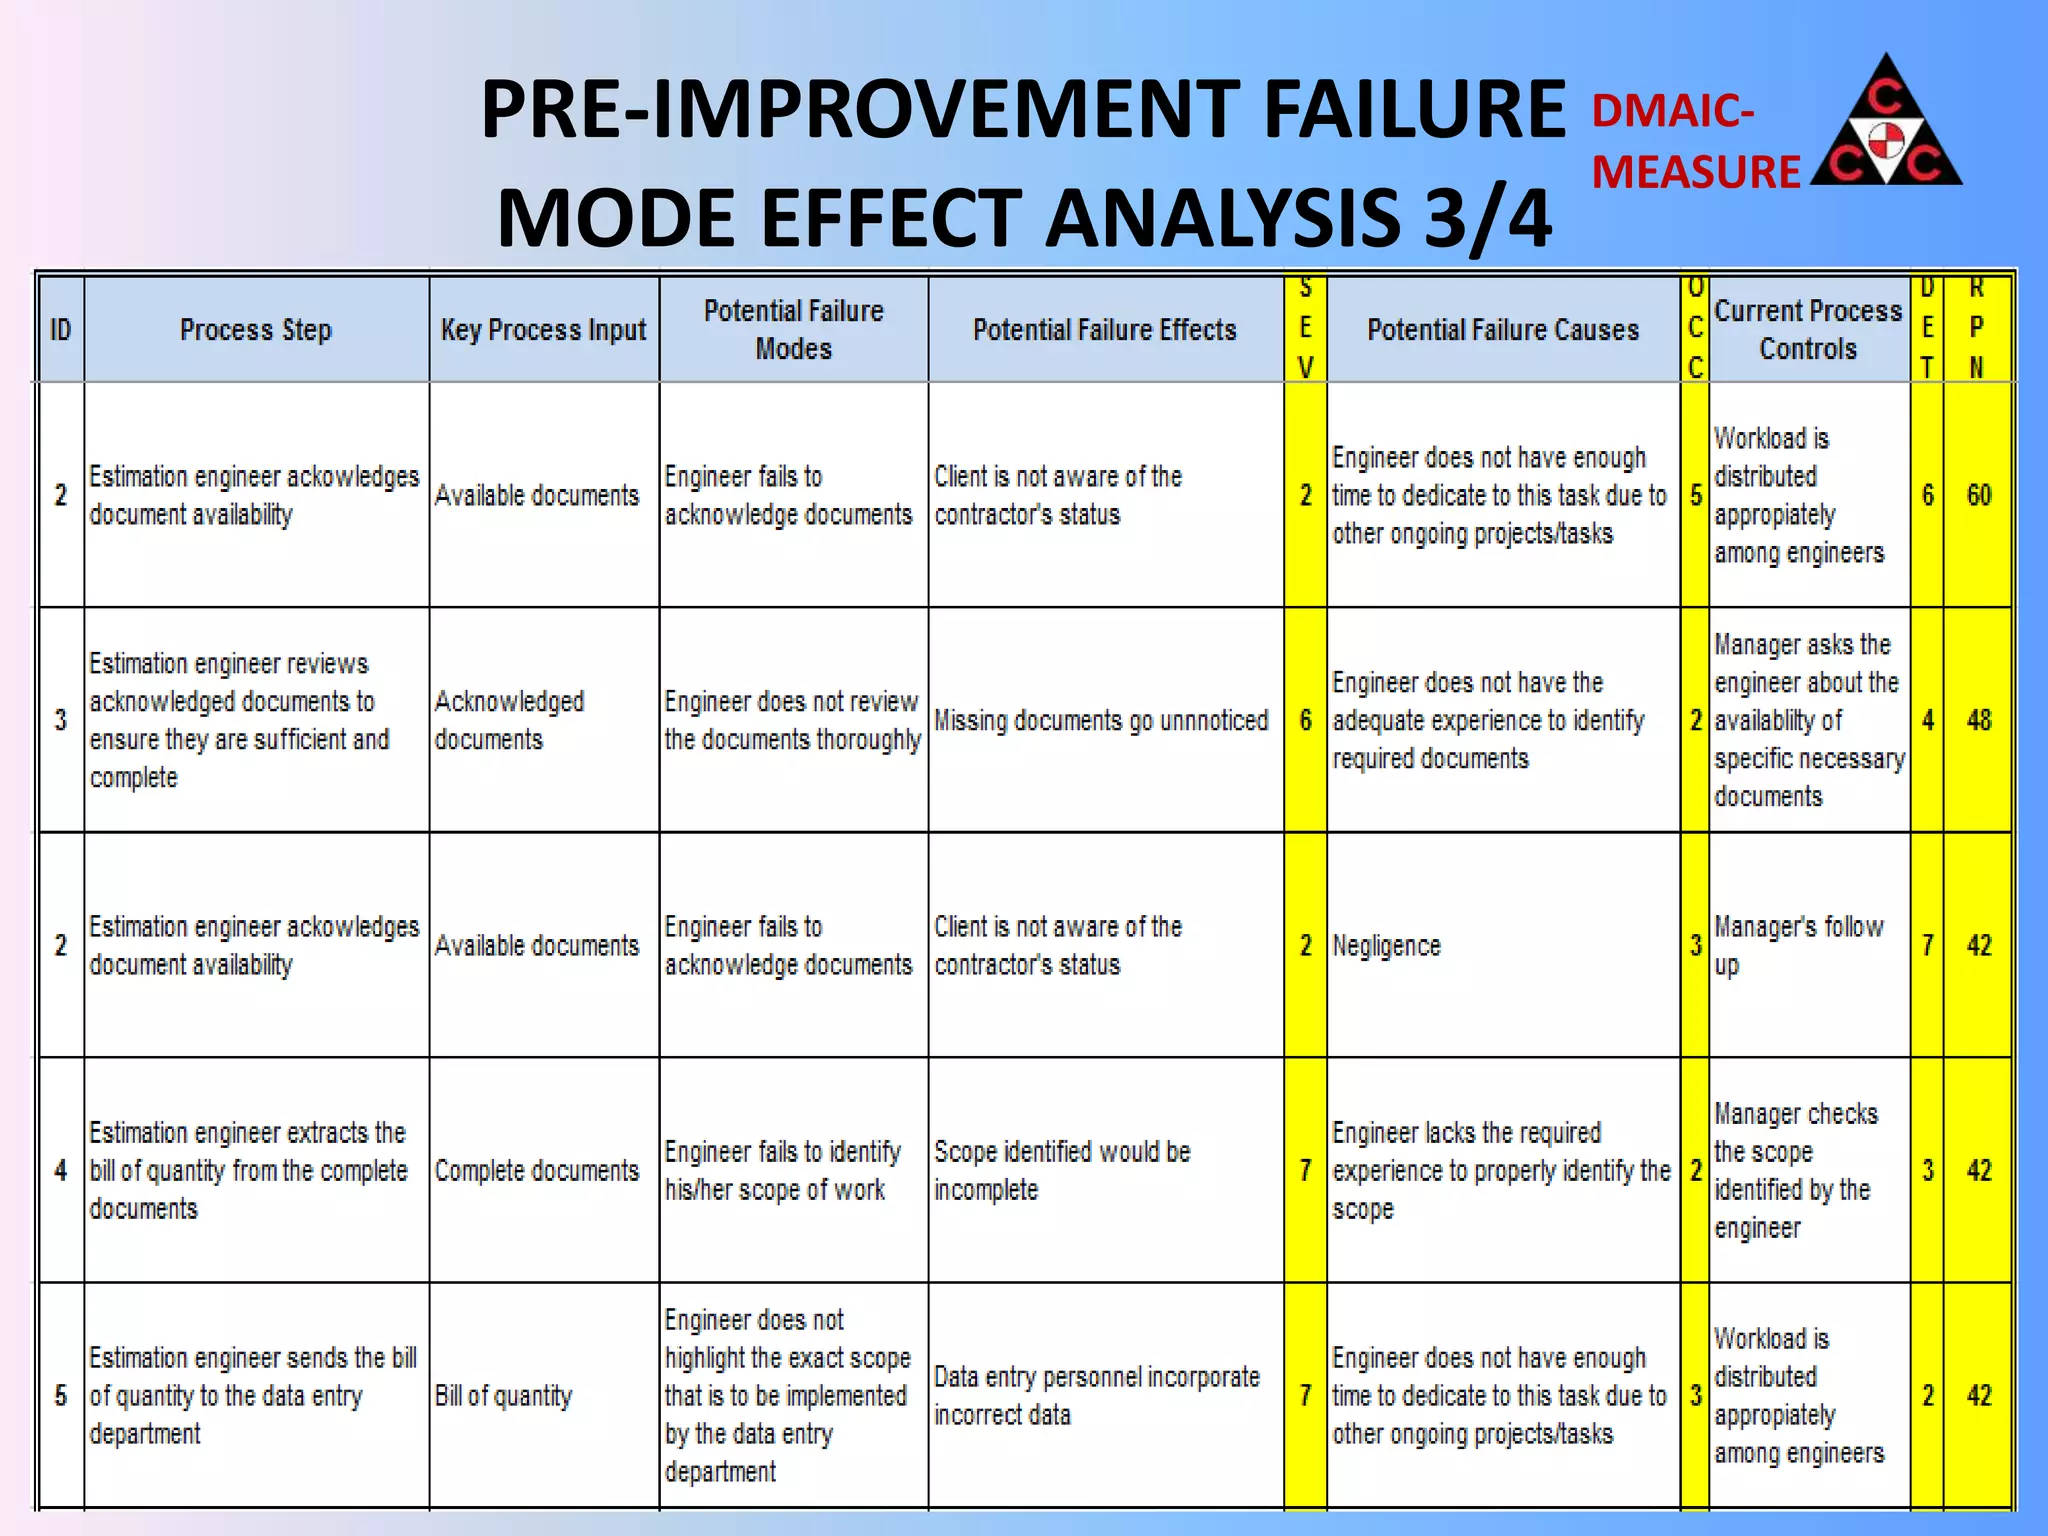
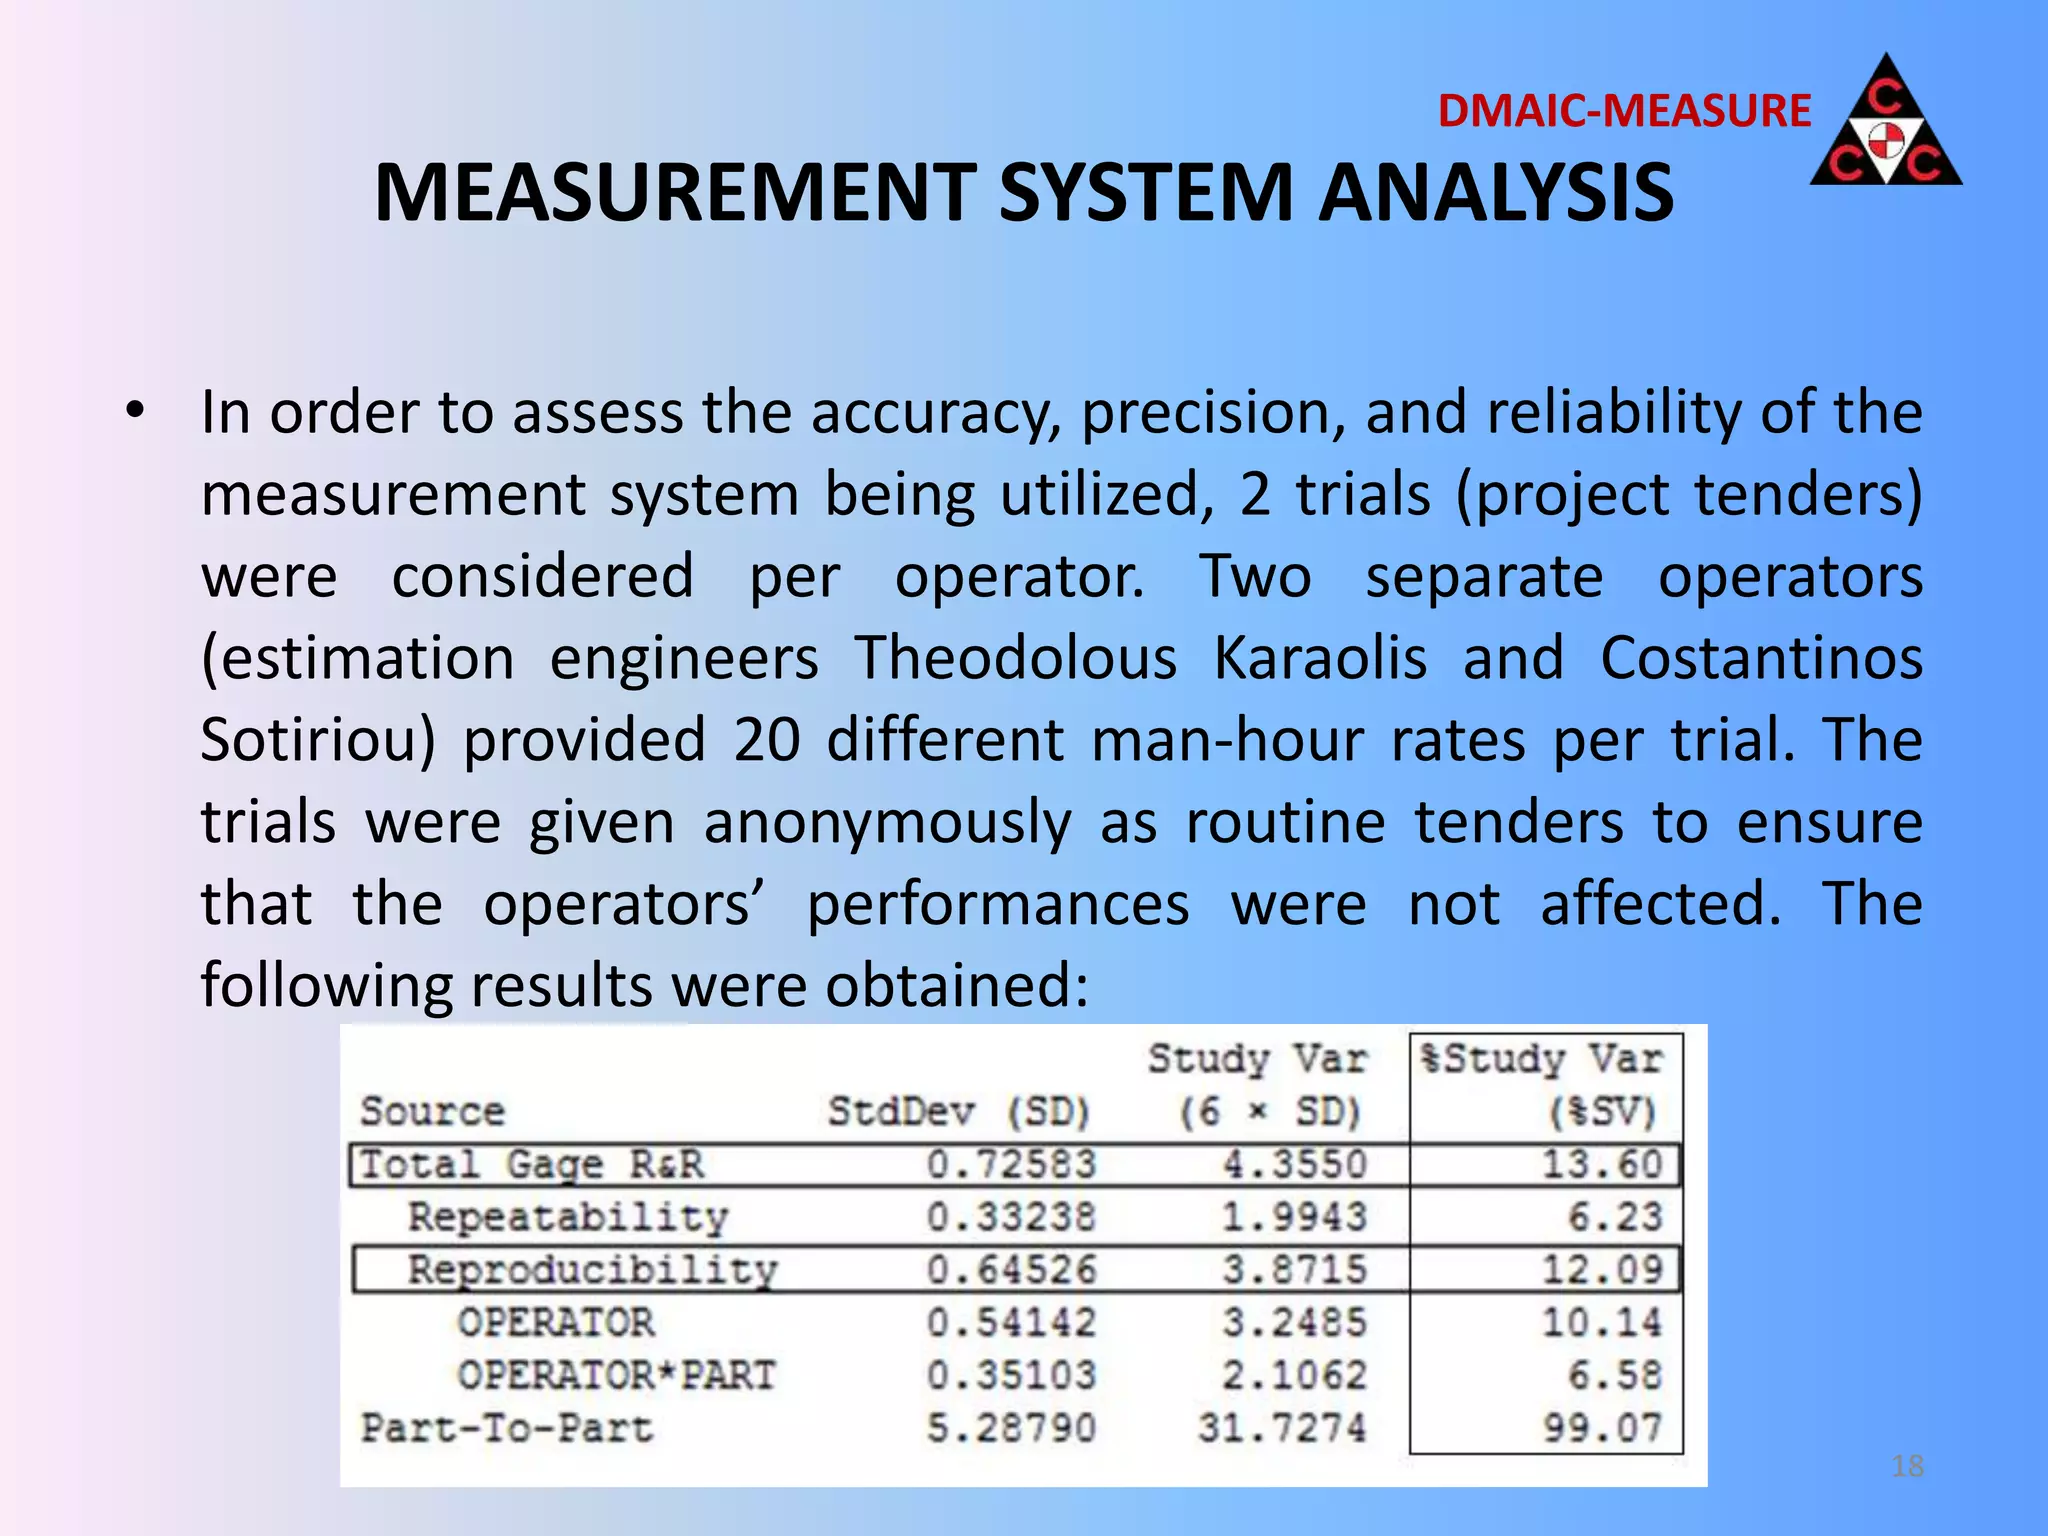
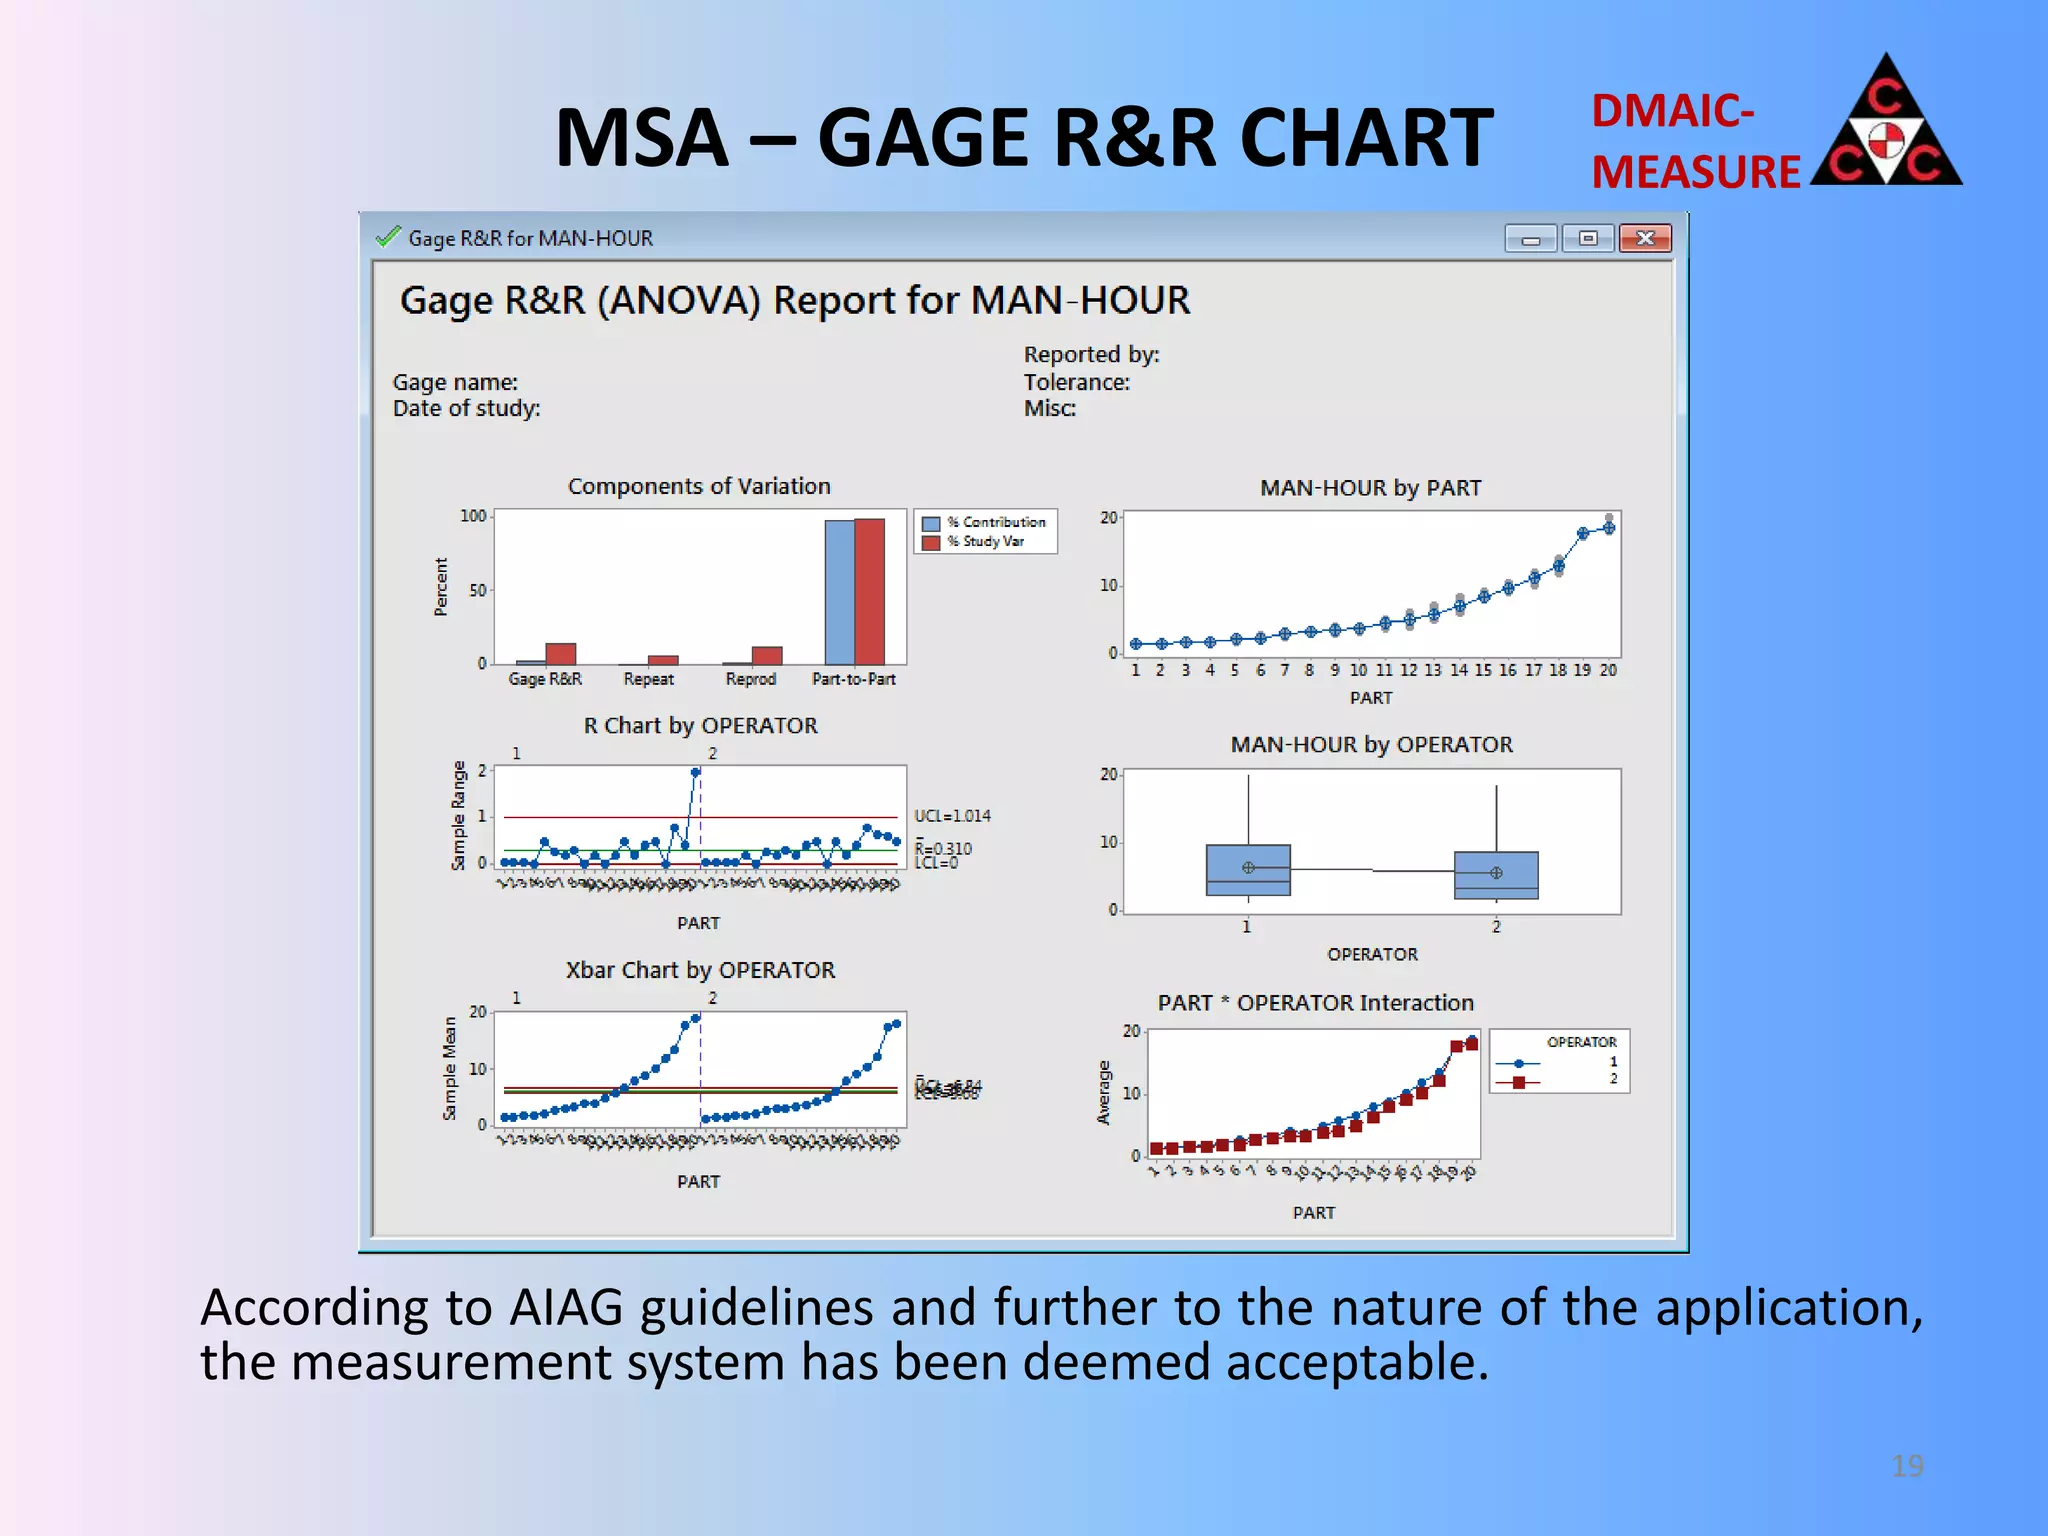
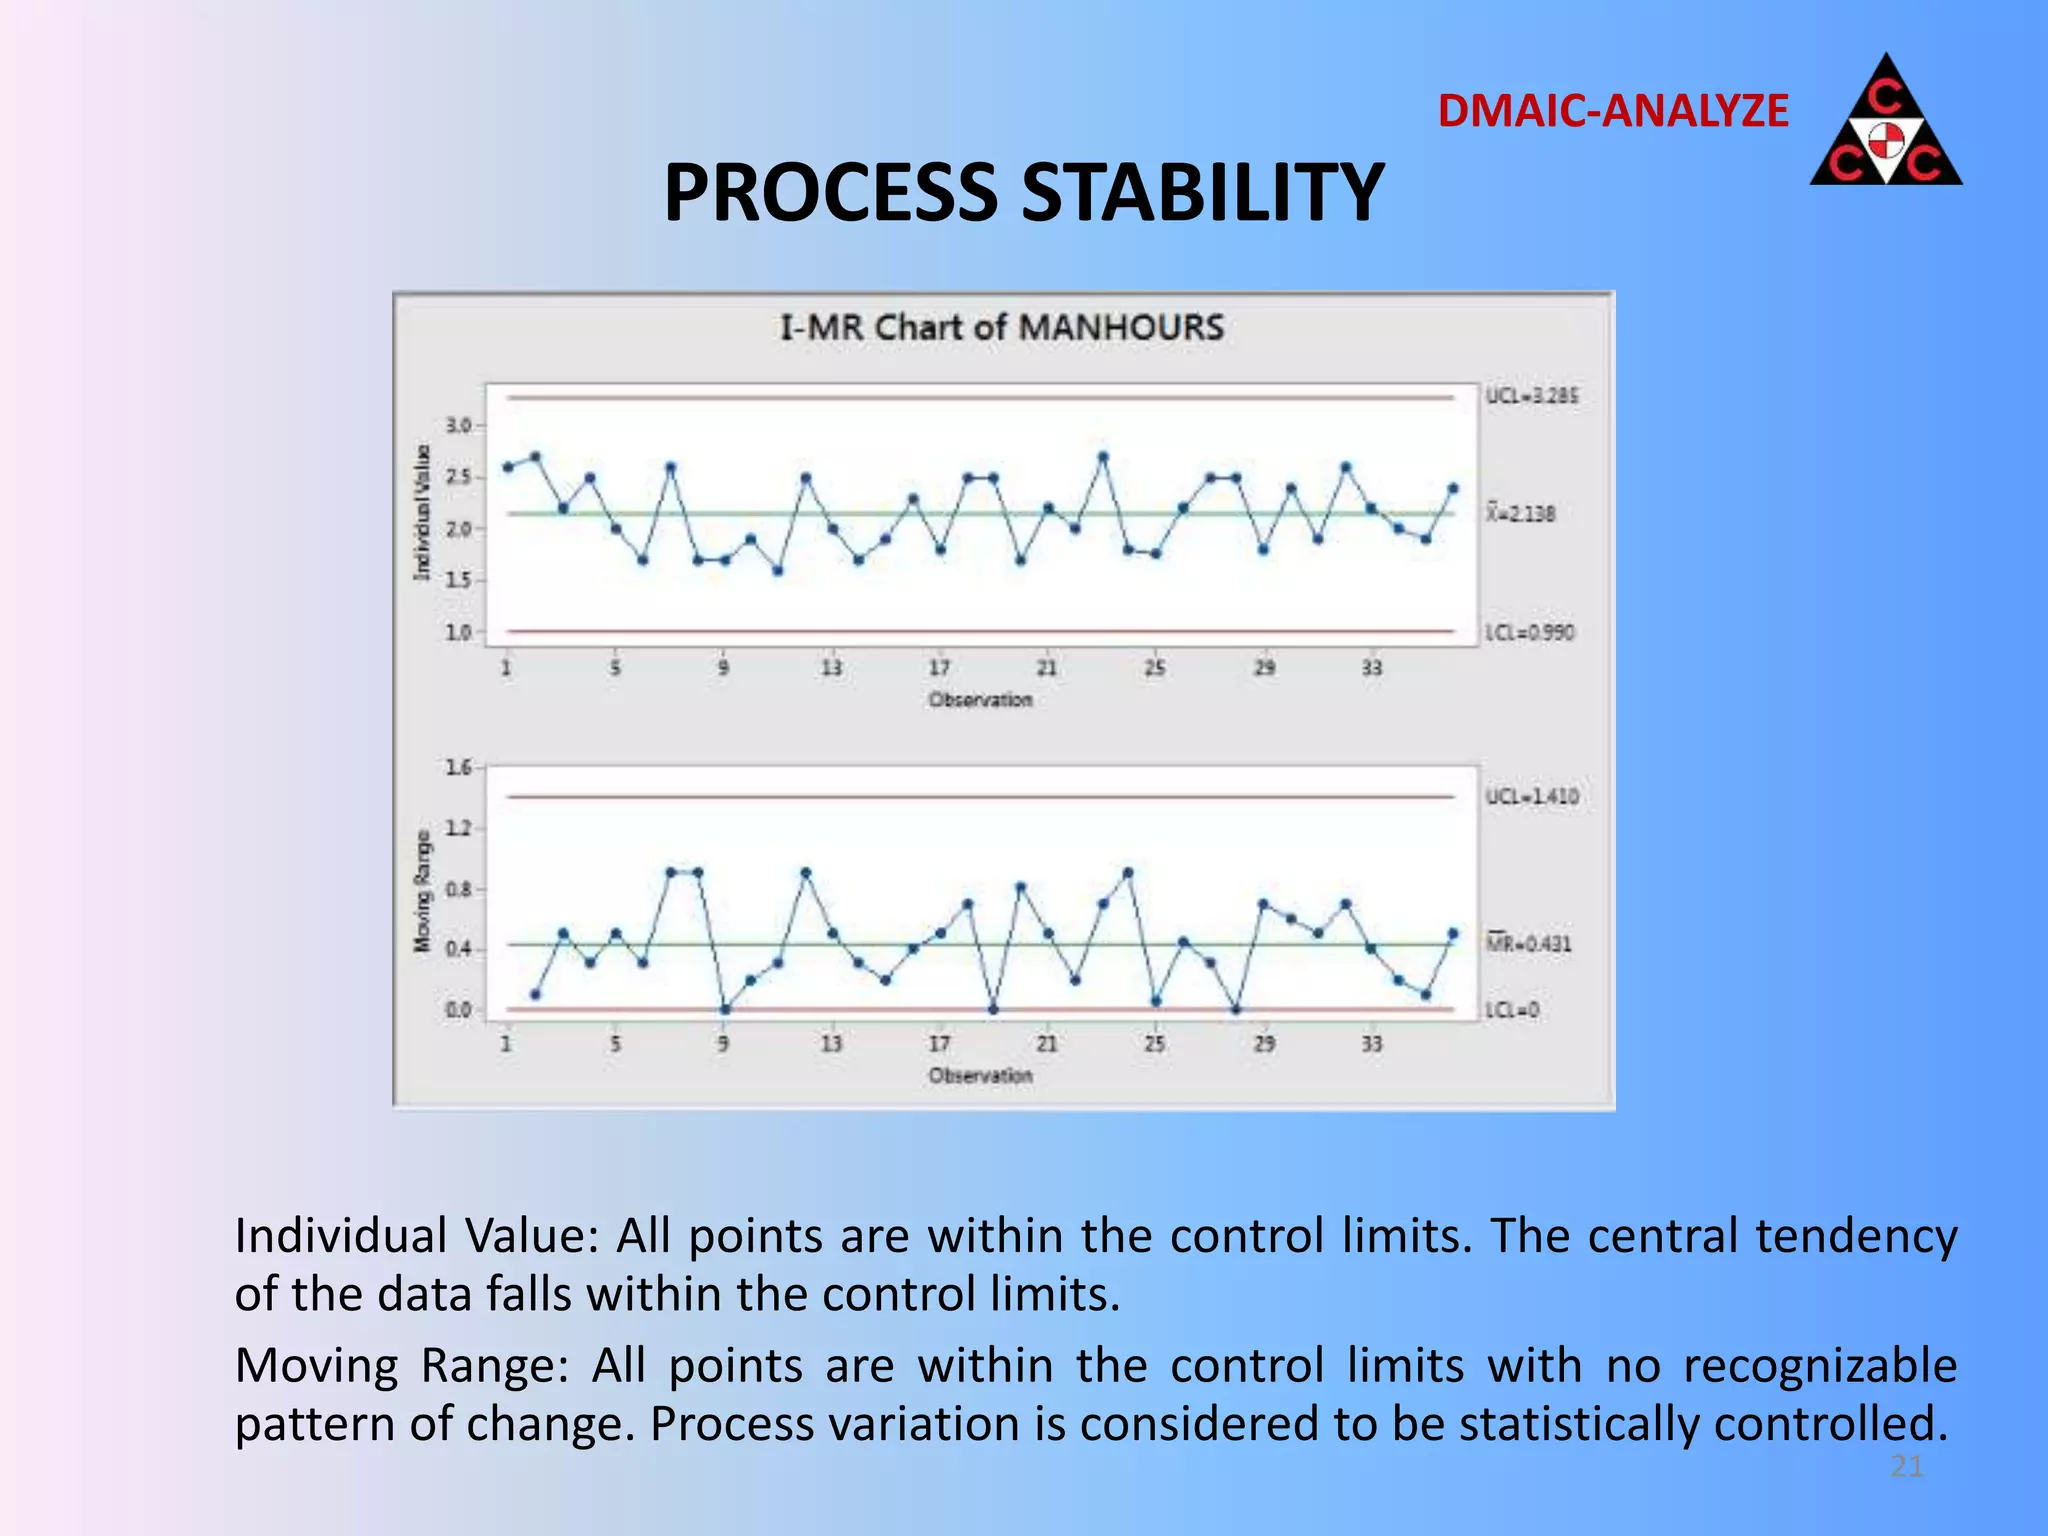
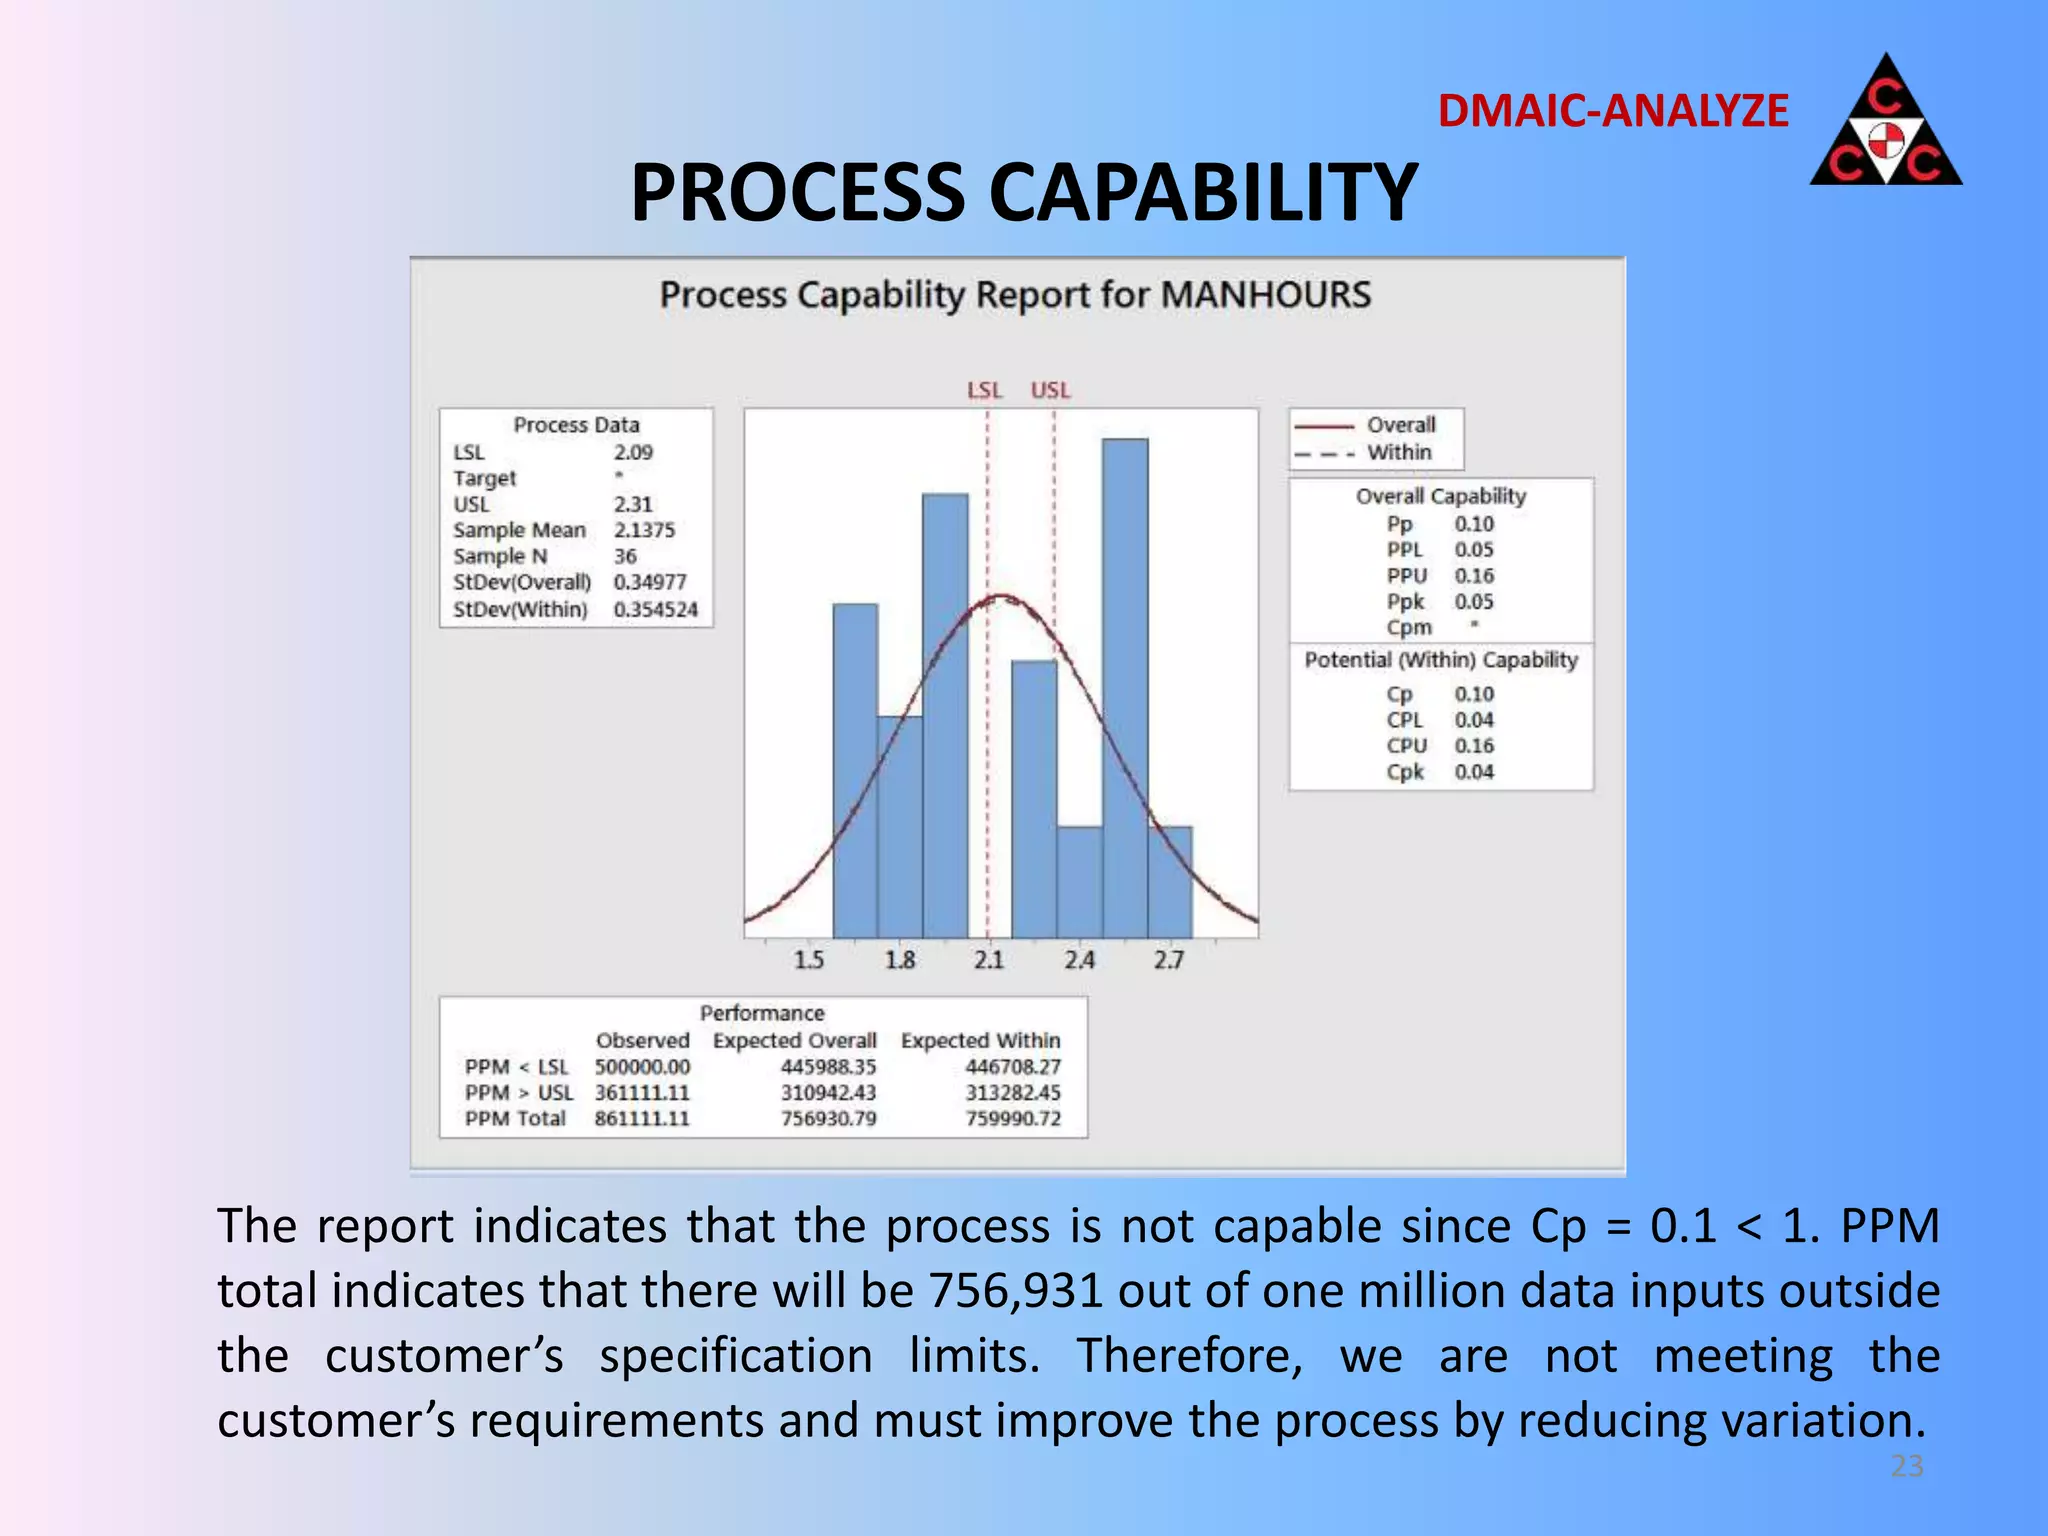
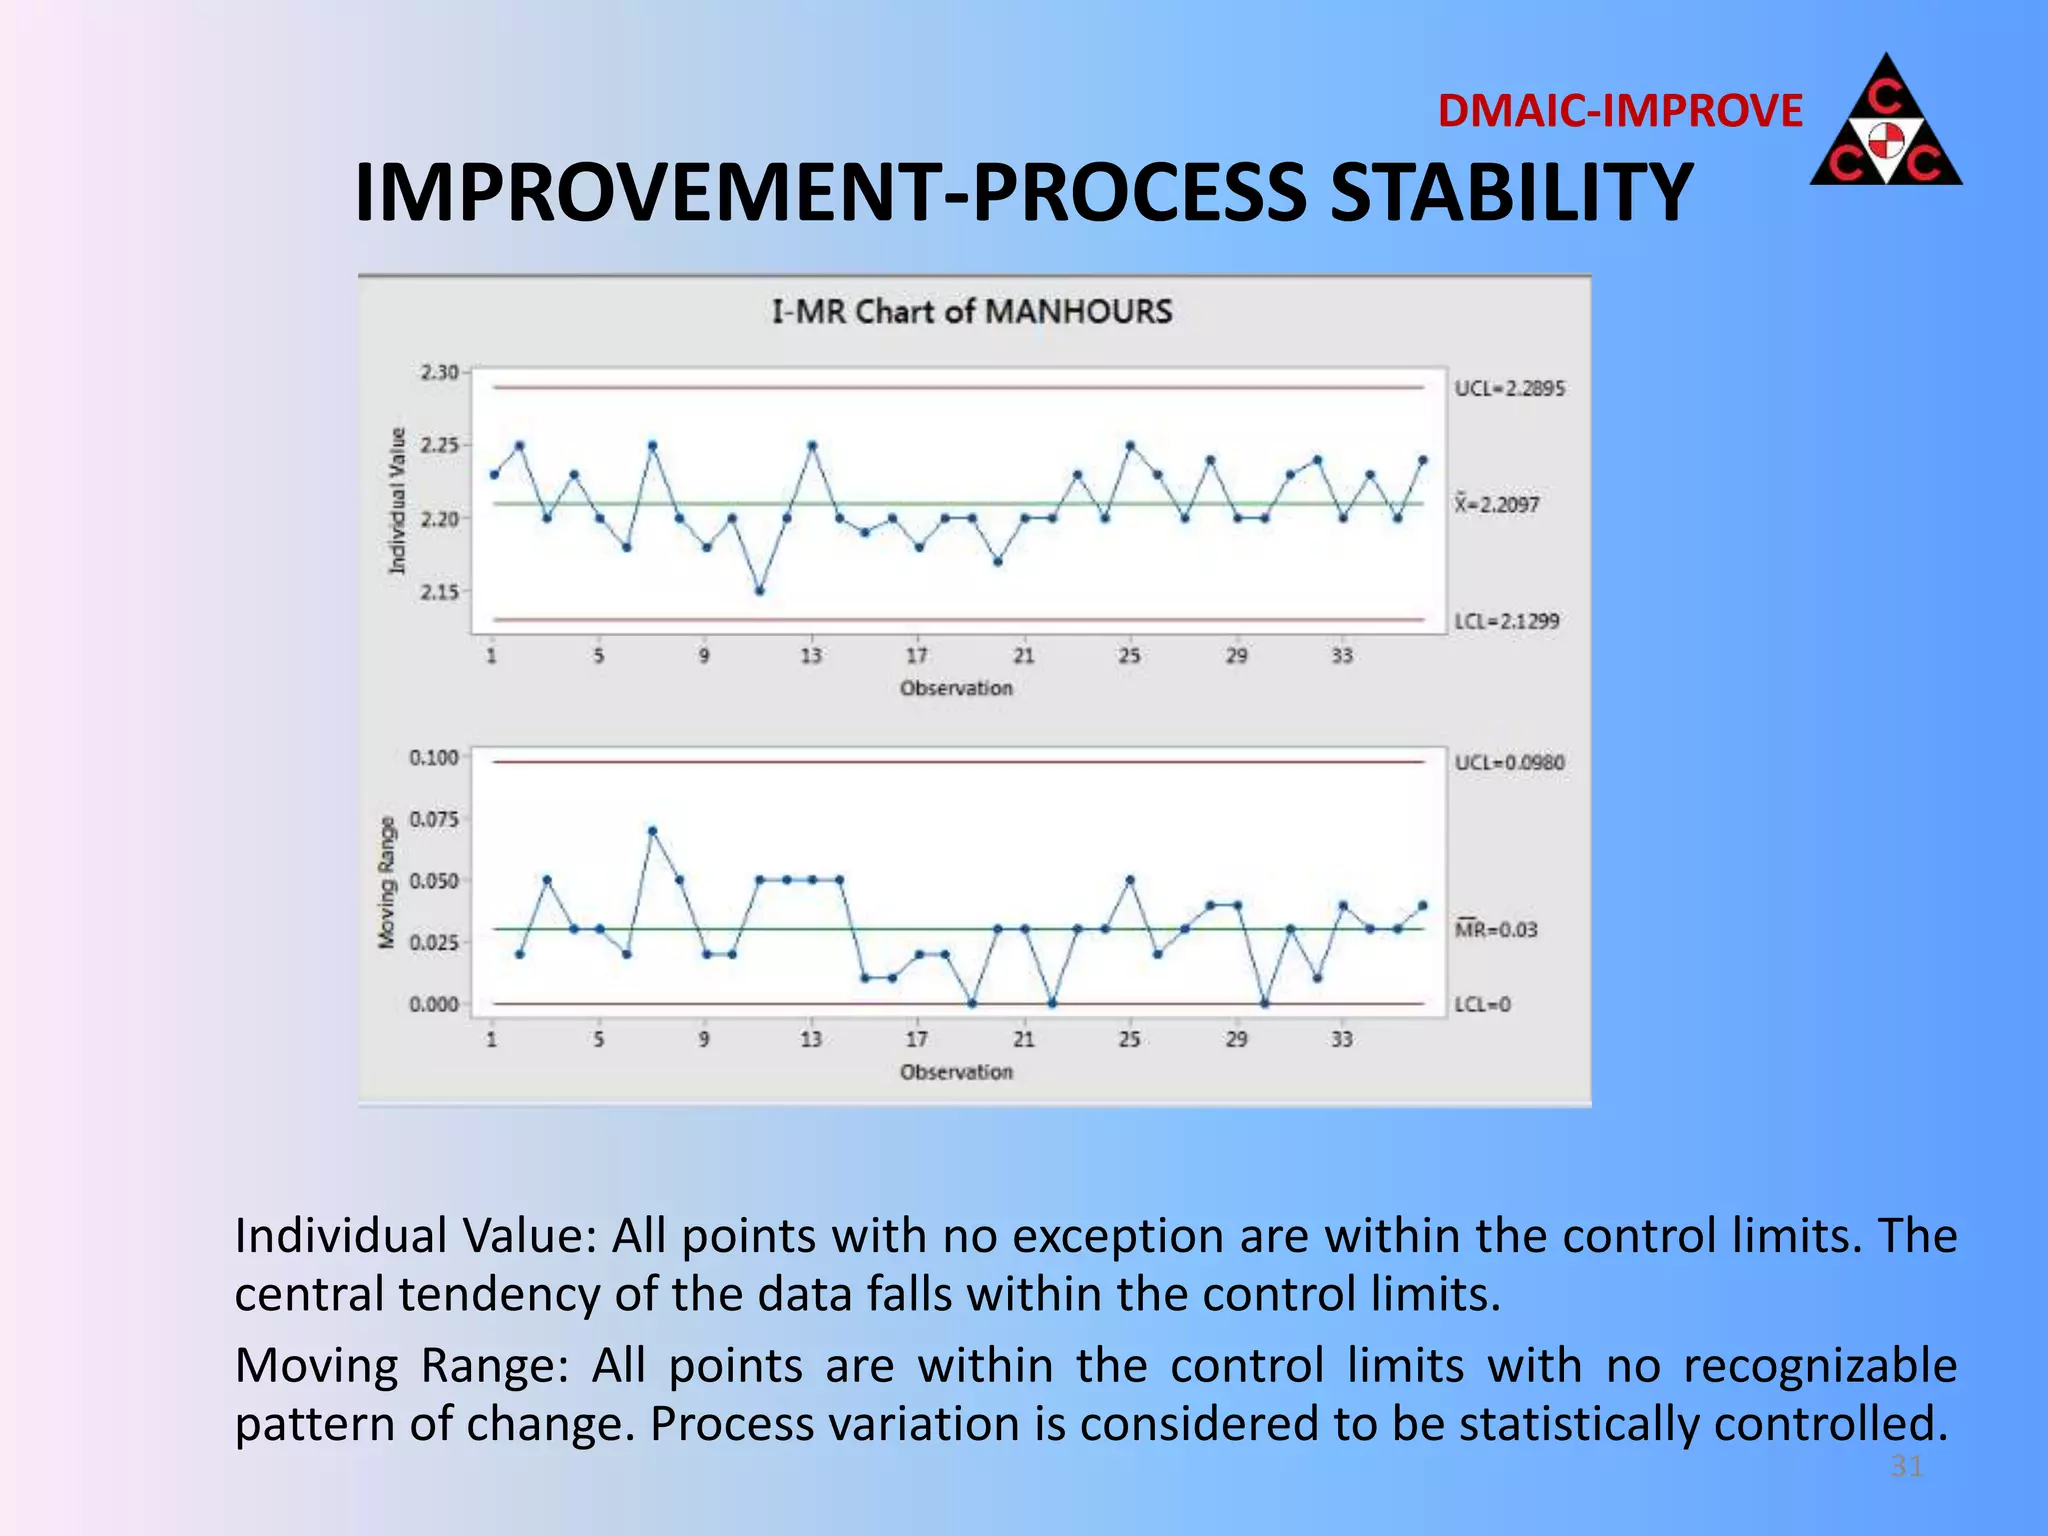
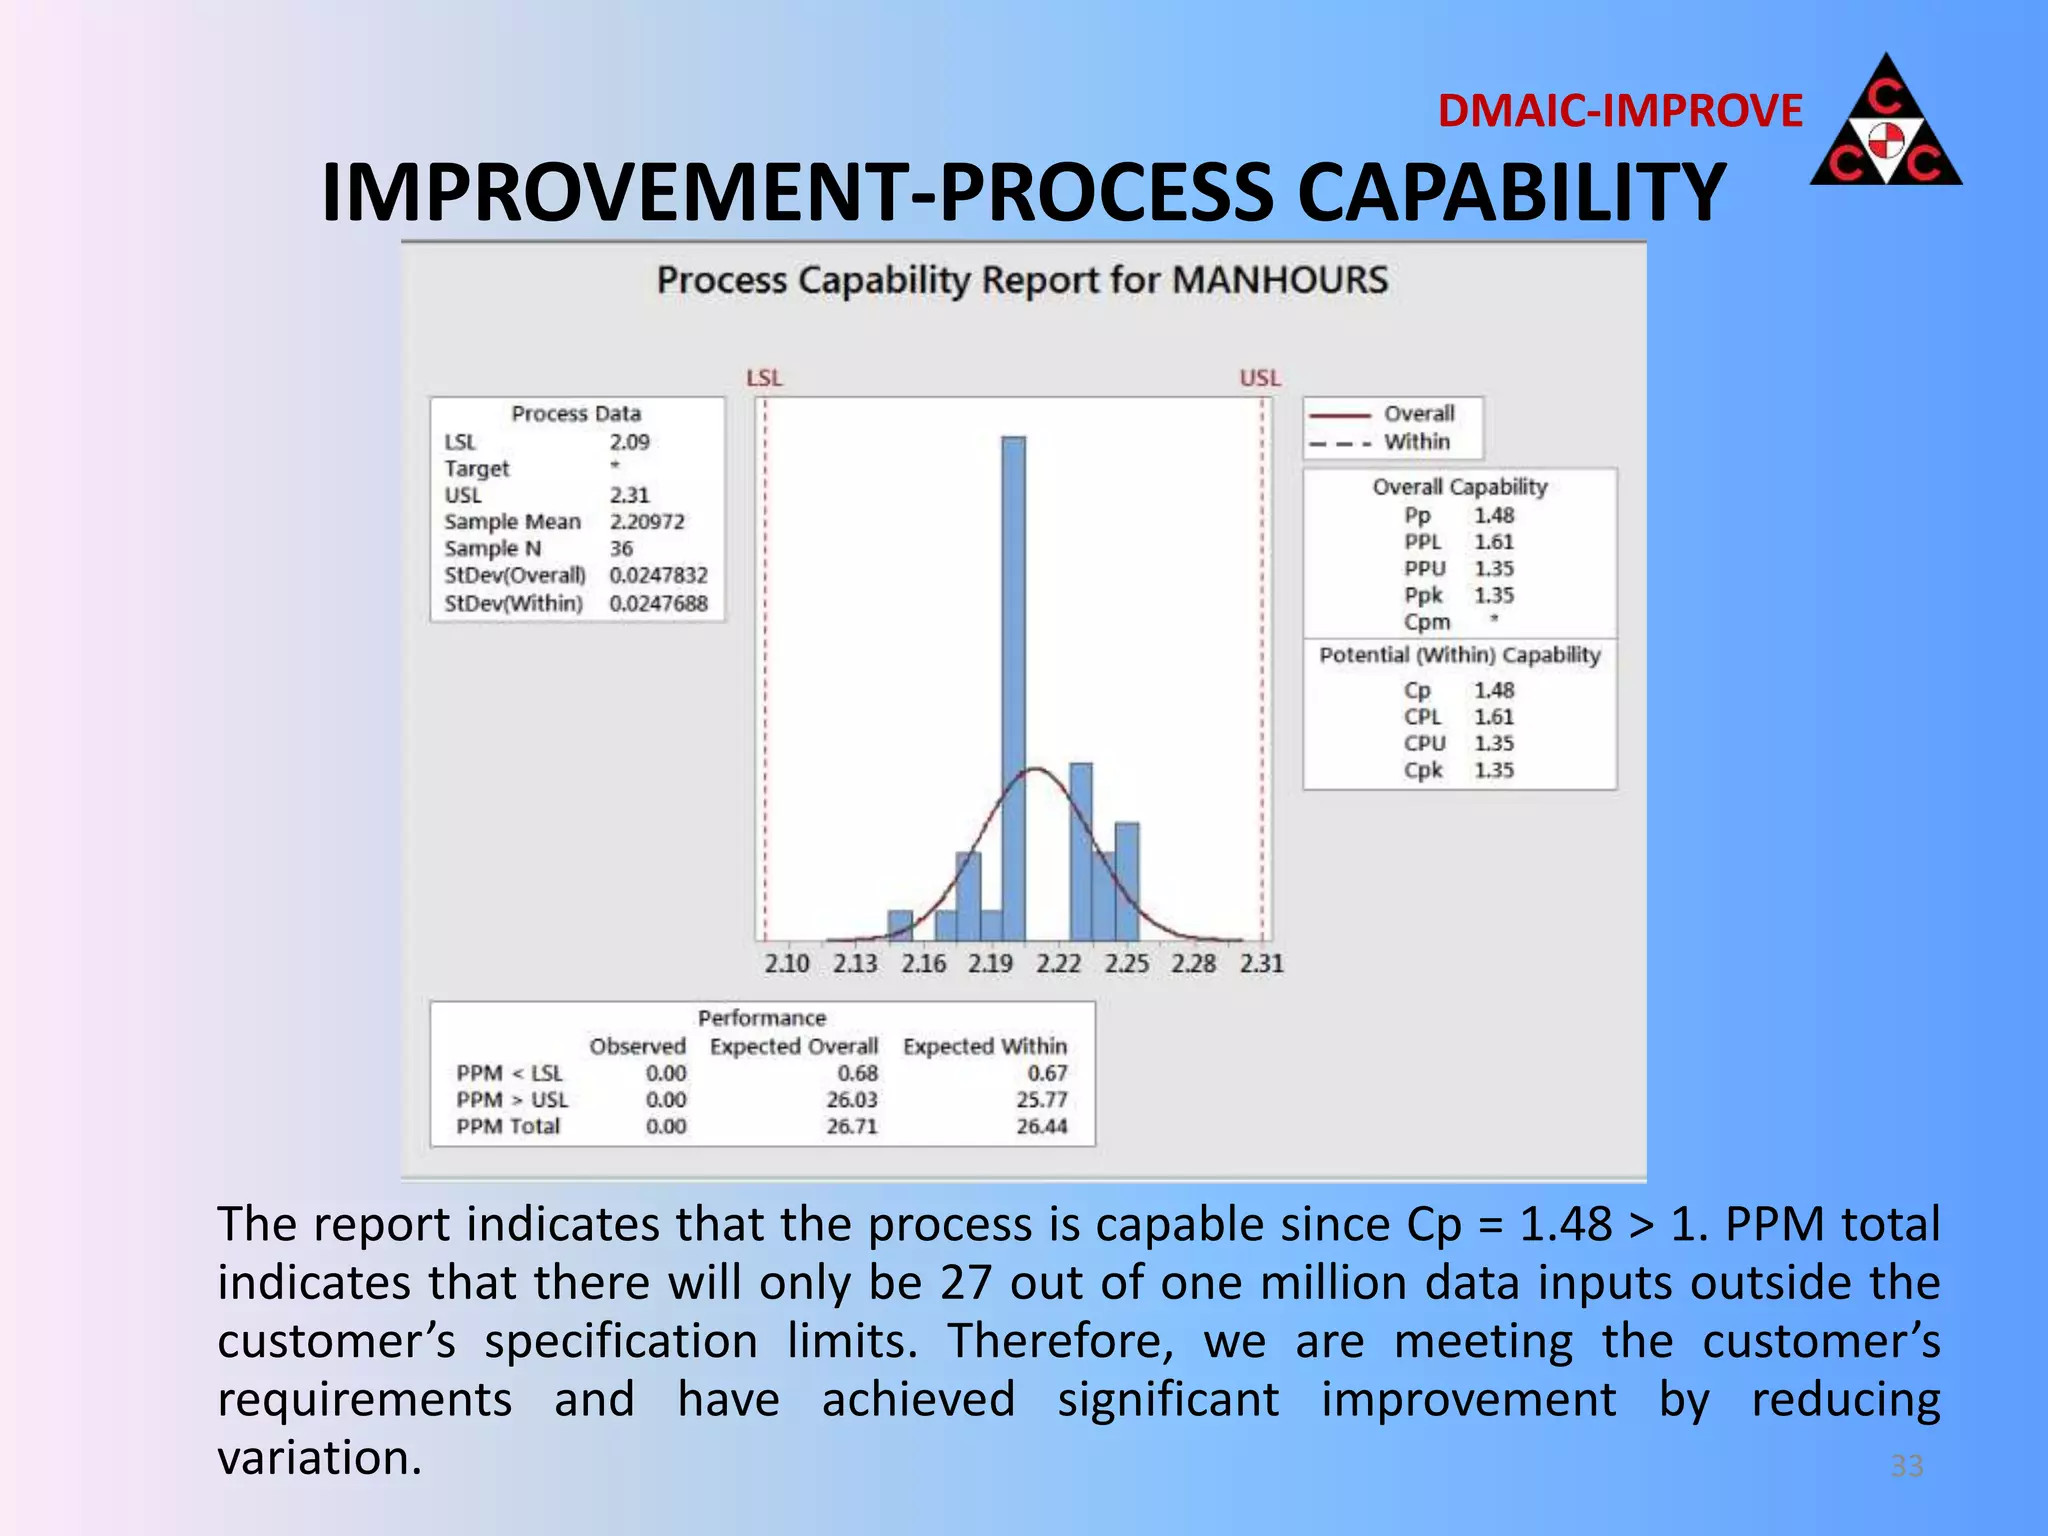
LEAN SIX SIGMA – VARIATION IN
MAN-HOUR RATES
CONSOLIDATED CONTRACTORS COMPANY
JUNE 2016
JIHAD MAKSAD
1
PROJECT OUTLINE
• Introduction
• Project Statement
• Project Charter
• Baseline Case – Current State
– SIPOC
– Process Map
– C&E Matrix & Analysis
– FMEA
– Measurement System Analysis
– Process Stability
– Process Normality
– Process Capability
– Test for Equal Variance & Analysis
• Suggested Improvement
– Improvement-FMEA
– Improvement-Process Stability
– Improvement-Process Normality
– Improvement-Process Capability
– Improvement-Test for Equal Variance & Analysis
• Cost Impact
• Standardize & Continuously Improve
• Lessons Learned
2
DMAIC-DEFINE
INTRODUCTION
CCC is an international conglomerate in the field of contracting and
construction works with over 60 years of project experience.
Recently, the managers of the electromechanical estimation
department within CCC have noticed discrepancies in the unit man-
hour rates adopted for different tenders which had been submitted
to their clients. They are dissatisfied with the level of consistency in
the man-hour rates adopted across their tenders and have
supported the employment of six sigma measures to improve on
the current situation.
3
DMAIC-DEFINE
PROJECT STATEMENT
The aim of this project is to utilize six sigma
tools to explore the current status quo and
investigate methods to improve performance.
The objective is to reduce variation and
enhance consistency in unit man-hour rates
throughout the department and across tenders.
36 different tenders prepared by 2 subject
matter experts will be considered to assess the
extent of this variation. Additionally, the entire
tendering process will be broken down to
identify potential areas for improvement.
4
DMAIC-DEFINE
PROJECT CHARTER 1/2
5
DMAIC-DEFINE
PROJECT CHARTER 2/2
6
DMAIC-DEFINE
SIPOC DIAGRAM 1/2
7
DMAIC-MEASURE
SIPOC DIAGRAM 2/2
8
DMAIC-MEASURE
PROCESS MAP 1/3
9
DMAIC-MEASURE
PROCESS MAP 2/3
10
DMAIC-MEASURE
PROCESS MAP 3/3
11
DMAIC-MEASURE
CAUSE AND EFFECT MATRIX
Ratings: 9 = High, 3 = Moderate, 1 = Existent, 0 = No Effect
12
DMAIC-MEASURE
CAUSE AND EFFECT ANALYSIS
PARETO CHART
0%
20%
40%
60%
80%
100%
120%
0
20
40
60
80
100
120
140
160
Rank
Comulative %
13
DMAIC-MEASURE
PRE-IMPROVEMENT FAILURE
MODE EFFECT ANALYSIS 1/4
14
DMAIC-
MEASURE
PRE-IMPROVEMENT FAILURE
MODE EFFECT ANALYSIS 2/4
15
DMAIC-
MEASURE
PRE-IMPROVEMENT FAILURE
MODE EFFECT ANALYSIS 3/4
16
DMAIC-
MEASURE
PRE-IMPROVEMENT FAILURE
MODE EFFECT ANALYSIS 4/4
17
DMAIC-
MEASURE
MEASUREMENT SYSTEM ANALYSIS
• In order to assess the accuracy, precision, and reliability of the
measurement system being utilized, 2 trials (project tenders)
were considered per operator. Two separate operators
(estimation engineers Theodolous Karaolis and Costantinos
Sotiriou) provided 20 different man-hour rates per trial. The
trials were given anonymously as routine tenders to ensure
that the operators’ performances were not affected. The
following results were obtained:
18
DMAIC-MEASURE
MSA – GAGE R&R CHART
According to AIAG guidelines and further to the nature of the application,
the measurement system has been deemed acceptable.
19
DMAIC-
MEASURE
DATA ANALYSIS BACKGROUND
As stated within the project charter, the project Y is consistency in man-hour
figures. Consequently, the upcoming analysis focuses on the variation in man-hour
rates for the same material assigned by different subject matter experts.
The managers of the electromechanical department have decided that a maximum
variation of +/-5% among man-hour rates for identical material is acceptable.
Management has assigned a unit man-hour rate of 2.2 as a benchmark for the
material whose man-hour rates are being scrutinized. This benchmark was
calculated based on the reference book “RSMeans-Mechanical Cost Data”.
The value in that reference book was adjusted by the project team and approved by
the managers to suit local market conditions within the Middle East. Accordingly,
the project team has selected an upper specification limit of 2.31 and a lower
specification limit of 2.09 for capability analysis.
20
DMAIC-ANALYZE
PROCESS STABILITY
Individual Value: All points are within the control limits. The central tendency
of the data falls within the control limits.
Moving Range: All points are within the control limits with no recognizable
pattern of change. Process variation is considered to be statistically controlled.
21
DMAIC-ANALYZE
NORMALITY
Since the obtained data is not normal (P-Value < 0.05), a test for equal
variances (Levene’s Test) is utilized to proceed with analyzing the obtained
results
22
DMAIC-ANALYZE
PROCESS CAPABILITY
The report indicates that the process is not capable since Cp = 0.1 < 1. PPM
total indicates that there will be 756,931 out of one million data inputs outside
the customer’s specification limits. Therefore, we are not meeting the
customer’s requirements and must improve the process by reducing variation.
23
DMAIC-ANALYZE
TEST FOR EQUAL VARIANCES
Since the data is not normal, we consider the P-Value of Levene’s Test
24
DMAIC-ANALYZE
EQUAL VARIANCE ANALYSIS
• Null Hypothesis H0: Variances of all the populations are equal.
• Alternative Hypothesis Ha: Variance of at least one population is significantly
different from the others.
 Since P-value = 0.399 > 0.05, we fail to reject the null hypothesis and thus both
populations have equal variances.
We conclude that both SME’s have equal performance. However, considering the
combined results for capability and equal variances, we also conclude that both SME’s
are equally off target and equally inconsistent.
25
DMAIC-ANALYZE
FMEA – IMPROVEMENT 1/5
26
DMAIC-IMPROVE
FMEA – IMPROVEMENT 2/5
27
DMAIC-IMPROVE
FMEA – IMPROVEMENT 3/5
28
DMAIC-IMPROVE
FMEA – IMPROVEMENT 4/5
29
DMAIC-IMPROVE
FMEA – IMPROVEMENT 5/5
30
DMAIC-IMPROVE
IMPROVEMENT-PROCESS STABILITY
Individual Value: All points with no exception are within the control limits. The
central tendency of the data falls within the control limits.
Moving Range: All points are within the control limits with no recognizable
pattern of change. Process variation is considered to be statistically controlled.
31
DMAIC-IMPROVE
IMPROVEMENT-NORMALITY
Since the obtained data is not normal (P-Value < 0.05), a test for equal
variances (Levene’s Test) is utilized to proceed with analyzing the obtained
results
32
DMAIC-IMPROVE
IMPROVEMENT-PROCESS CAPABILITY
The report indicates that the process is capable since Cp = 1.48 > 1. PPM total
indicates that there will only be 27 out of one million data inputs outside the
customer’s specification limits. Therefore, we are meeting the customer’s
requirements and have achieved significant improvement by reducing
variation. 33
DMAIC-IMPROVE
IMPROVEMENT-TEST FOR
EQUAL VARIANCES
Since the data is not normal, we consider the P-Value of Levene’s Test
34
DMAIC-
IMPROVE
IMPROVEMENT-EQUAL
VARIANCE ANALYSIS
• Null Hypothesis H0: Variances of all the populations are equal.
• Alternative Hypothesis Ha: Variance of at least one population is significantly
different from the others.
 Since P-value = 0.933 > 0.05, we fail to reject the null hypothesis and thus both
populations have equal variances.
We conclude that both SME’s have equal performance. Moreover, considering the
combined results for capability and equal variances, we also conclude that both SME’s
are equally on target and equally consistent.
35
DMAIC-
IMPROVE
COST IMPACT
• This project examines 2 tenders in particular which had recently been
prepared and submitted by CCC. For confidentiality purposes, I cannot
disclose the title of those tenders. However, the below table reveals the
improvement accomplished on these 2 tenders by implementing the
consolidated man-hour rates made available via the database established
by this six sigma undertaking.
36
DMAIC-IMPROVE
STANDARDIZE &
CONTINUOUSLY IMPROVE
• The established database is currently available to all engineers and is the
department’s benchmark for assigning man-hour rates to all active
tenders within the electromechanical department.
• The engineers have been appropriately introduced and trained to
effectively utilize the new database system.
• Procedures have been set in place to ensure that the database is
periodically updated and expanded to include man-hour rates for
additional material that show up in upcoming tenders.
• The procedures ensure that information is shared across the department
and all new rates obtain managerial approval before being added to the
database.
37
DMAIC-CONTROL
LESSONS LEARNED
• Accountability
• Training
• Update of Organizational Process Assets
• Continuous Improvement
• Further opportunities to improve by examining the
unit material rates being adopted throughout CCC
tenders
38
DMAIC-CONTROL

LEAN SIX SIGMA PROJECT - FINAL

  • 1.
    LEAN SIX SIGMA– VARIATION IN MAN-HOUR RATES CONSOLIDATED CONTRACTORS COMPANY JUNE 2016 JIHAD MAKSAD 1
  • 2.
    PROJECT OUTLINE • Introduction •Project Statement • Project Charter • Baseline Case – Current State – SIPOC – Process Map – C&E Matrix & Analysis – FMEA – Measurement System Analysis – Process Stability – Process Normality – Process Capability – Test for Equal Variance & Analysis • Suggested Improvement – Improvement-FMEA – Improvement-Process Stability – Improvement-Process Normality – Improvement-Process Capability – Improvement-Test for Equal Variance & Analysis • Cost Impact • Standardize & Continuously Improve • Lessons Learned 2 DMAIC-DEFINE
  • 3.
    INTRODUCTION CCC is aninternational conglomerate in the field of contracting and construction works with over 60 years of project experience. Recently, the managers of the electromechanical estimation department within CCC have noticed discrepancies in the unit man- hour rates adopted for different tenders which had been submitted to their clients. They are dissatisfied with the level of consistency in the man-hour rates adopted across their tenders and have supported the employment of six sigma measures to improve on the current situation. 3 DMAIC-DEFINE
  • 4.
    PROJECT STATEMENT The aimof this project is to utilize six sigma tools to explore the current status quo and investigate methods to improve performance. The objective is to reduce variation and enhance consistency in unit man-hour rates throughout the department and across tenders. 36 different tenders prepared by 2 subject matter experts will be considered to assess the extent of this variation. Additionally, the entire tendering process will be broken down to identify potential areas for improvement. 4 DMAIC-DEFINE
  • 5.
  • 6.
  • 7.
  • 8.
  • 9.
  • 10.
  • 11.
  • 12.
    CAUSE AND EFFECTMATRIX Ratings: 9 = High, 3 = Moderate, 1 = Existent, 0 = No Effect 12 DMAIC-MEASURE
  • 13.
    CAUSE AND EFFECTANALYSIS PARETO CHART 0% 20% 40% 60% 80% 100% 120% 0 20 40 60 80 100 120 140 160 Rank Comulative % 13 DMAIC-MEASURE
  • 14.
    PRE-IMPROVEMENT FAILURE MODE EFFECTANALYSIS 1/4 14 DMAIC- MEASURE
  • 15.
    PRE-IMPROVEMENT FAILURE MODE EFFECTANALYSIS 2/4 15 DMAIC- MEASURE
  • 16.
    PRE-IMPROVEMENT FAILURE MODE EFFECTANALYSIS 3/4 16 DMAIC- MEASURE
  • 17.
    PRE-IMPROVEMENT FAILURE MODE EFFECTANALYSIS 4/4 17 DMAIC- MEASURE
  • 18.
    MEASUREMENT SYSTEM ANALYSIS •In order to assess the accuracy, precision, and reliability of the measurement system being utilized, 2 trials (project tenders) were considered per operator. Two separate operators (estimation engineers Theodolous Karaolis and Costantinos Sotiriou) provided 20 different man-hour rates per trial. The trials were given anonymously as routine tenders to ensure that the operators’ performances were not affected. The following results were obtained: 18 DMAIC-MEASURE
  • 19.
    MSA – GAGER&R CHART According to AIAG guidelines and further to the nature of the application, the measurement system has been deemed acceptable. 19 DMAIC- MEASURE
  • 20.
    DATA ANALYSIS BACKGROUND Asstated within the project charter, the project Y is consistency in man-hour figures. Consequently, the upcoming analysis focuses on the variation in man-hour rates for the same material assigned by different subject matter experts. The managers of the electromechanical department have decided that a maximum variation of +/-5% among man-hour rates for identical material is acceptable. Management has assigned a unit man-hour rate of 2.2 as a benchmark for the material whose man-hour rates are being scrutinized. This benchmark was calculated based on the reference book “RSMeans-Mechanical Cost Data”. The value in that reference book was adjusted by the project team and approved by the managers to suit local market conditions within the Middle East. Accordingly, the project team has selected an upper specification limit of 2.31 and a lower specification limit of 2.09 for capability analysis. 20 DMAIC-ANALYZE
  • 21.
    PROCESS STABILITY Individual Value:All points are within the control limits. The central tendency of the data falls within the control limits. Moving Range: All points are within the control limits with no recognizable pattern of change. Process variation is considered to be statistically controlled. 21 DMAIC-ANALYZE
  • 22.
    NORMALITY Since the obtaineddata is not normal (P-Value < 0.05), a test for equal variances (Levene’s Test) is utilized to proceed with analyzing the obtained results 22 DMAIC-ANALYZE
  • 23.
    PROCESS CAPABILITY The reportindicates that the process is not capable since Cp = 0.1 < 1. PPM total indicates that there will be 756,931 out of one million data inputs outside the customer’s specification limits. Therefore, we are not meeting the customer’s requirements and must improve the process by reducing variation. 23 DMAIC-ANALYZE
  • 24.
    TEST FOR EQUALVARIANCES Since the data is not normal, we consider the P-Value of Levene’s Test 24 DMAIC-ANALYZE
  • 25.
    EQUAL VARIANCE ANALYSIS •Null Hypothesis H0: Variances of all the populations are equal. • Alternative Hypothesis Ha: Variance of at least one population is significantly different from the others.  Since P-value = 0.399 > 0.05, we fail to reject the null hypothesis and thus both populations have equal variances. We conclude that both SME’s have equal performance. However, considering the combined results for capability and equal variances, we also conclude that both SME’s are equally off target and equally inconsistent. 25 DMAIC-ANALYZE
  • 26.
    FMEA – IMPROVEMENT1/5 26 DMAIC-IMPROVE
  • 27.
    FMEA – IMPROVEMENT2/5 27 DMAIC-IMPROVE
  • 28.
    FMEA – IMPROVEMENT3/5 28 DMAIC-IMPROVE
  • 29.
    FMEA – IMPROVEMENT4/5 29 DMAIC-IMPROVE
  • 30.
    FMEA – IMPROVEMENT5/5 30 DMAIC-IMPROVE
  • 31.
    IMPROVEMENT-PROCESS STABILITY Individual Value:All points with no exception are within the control limits. The central tendency of the data falls within the control limits. Moving Range: All points are within the control limits with no recognizable pattern of change. Process variation is considered to be statistically controlled. 31 DMAIC-IMPROVE
  • 32.
    IMPROVEMENT-NORMALITY Since the obtaineddata is not normal (P-Value < 0.05), a test for equal variances (Levene’s Test) is utilized to proceed with analyzing the obtained results 32 DMAIC-IMPROVE
  • 33.
    IMPROVEMENT-PROCESS CAPABILITY The reportindicates that the process is capable since Cp = 1.48 > 1. PPM total indicates that there will only be 27 out of one million data inputs outside the customer’s specification limits. Therefore, we are meeting the customer’s requirements and have achieved significant improvement by reducing variation. 33 DMAIC-IMPROVE
  • 34.
    IMPROVEMENT-TEST FOR EQUAL VARIANCES Sincethe data is not normal, we consider the P-Value of Levene’s Test 34 DMAIC- IMPROVE
  • 35.
    IMPROVEMENT-EQUAL VARIANCE ANALYSIS • NullHypothesis H0: Variances of all the populations are equal. • Alternative Hypothesis Ha: Variance of at least one population is significantly different from the others.  Since P-value = 0.933 > 0.05, we fail to reject the null hypothesis and thus both populations have equal variances. We conclude that both SME’s have equal performance. Moreover, considering the combined results for capability and equal variances, we also conclude that both SME’s are equally on target and equally consistent. 35 DMAIC- IMPROVE
  • 36.
    COST IMPACT • Thisproject examines 2 tenders in particular which had recently been prepared and submitted by CCC. For confidentiality purposes, I cannot disclose the title of those tenders. However, the below table reveals the improvement accomplished on these 2 tenders by implementing the consolidated man-hour rates made available via the database established by this six sigma undertaking. 36 DMAIC-IMPROVE
  • 37.
    STANDARDIZE & CONTINUOUSLY IMPROVE •The established database is currently available to all engineers and is the department’s benchmark for assigning man-hour rates to all active tenders within the electromechanical department. • The engineers have been appropriately introduced and trained to effectively utilize the new database system. • Procedures have been set in place to ensure that the database is periodically updated and expanded to include man-hour rates for additional material that show up in upcoming tenders. • The procedures ensure that information is shared across the department and all new rates obtain managerial approval before being added to the database. 37 DMAIC-CONTROL
  • 38.
    LESSONS LEARNED • Accountability •Training • Update of Organizational Process Assets • Continuous Improvement • Further opportunities to improve by examining the unit material rates being adopted throughout CCC tenders 38 DMAIC-CONTROL