Cpk Presentation on how to utilize CpK in the workspace
1.
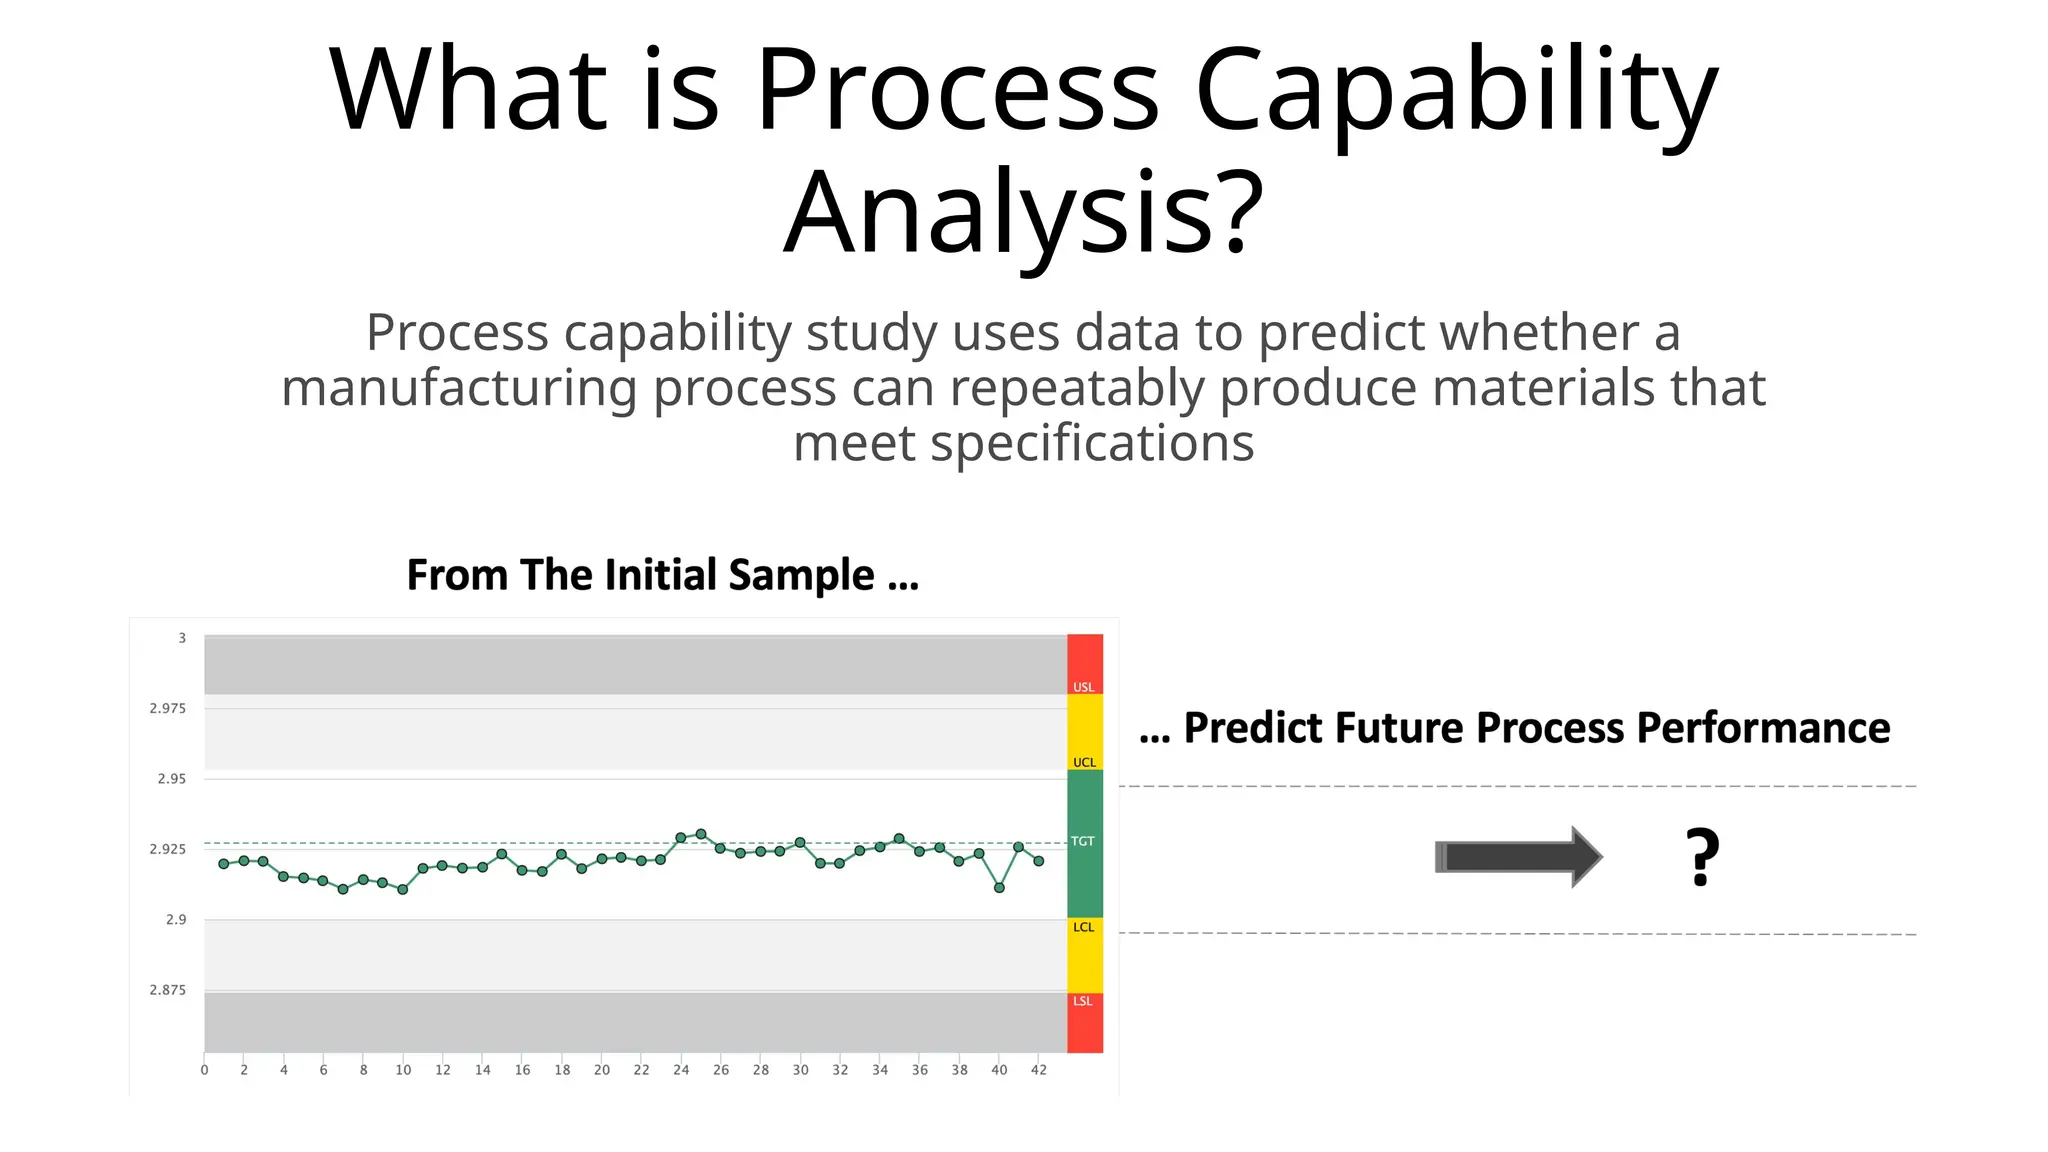
What is ProcessCapability
Analysis?
Process capability study uses data to predict whether a
manufacturing process can repeatably produce materials that
meet specifications
2.
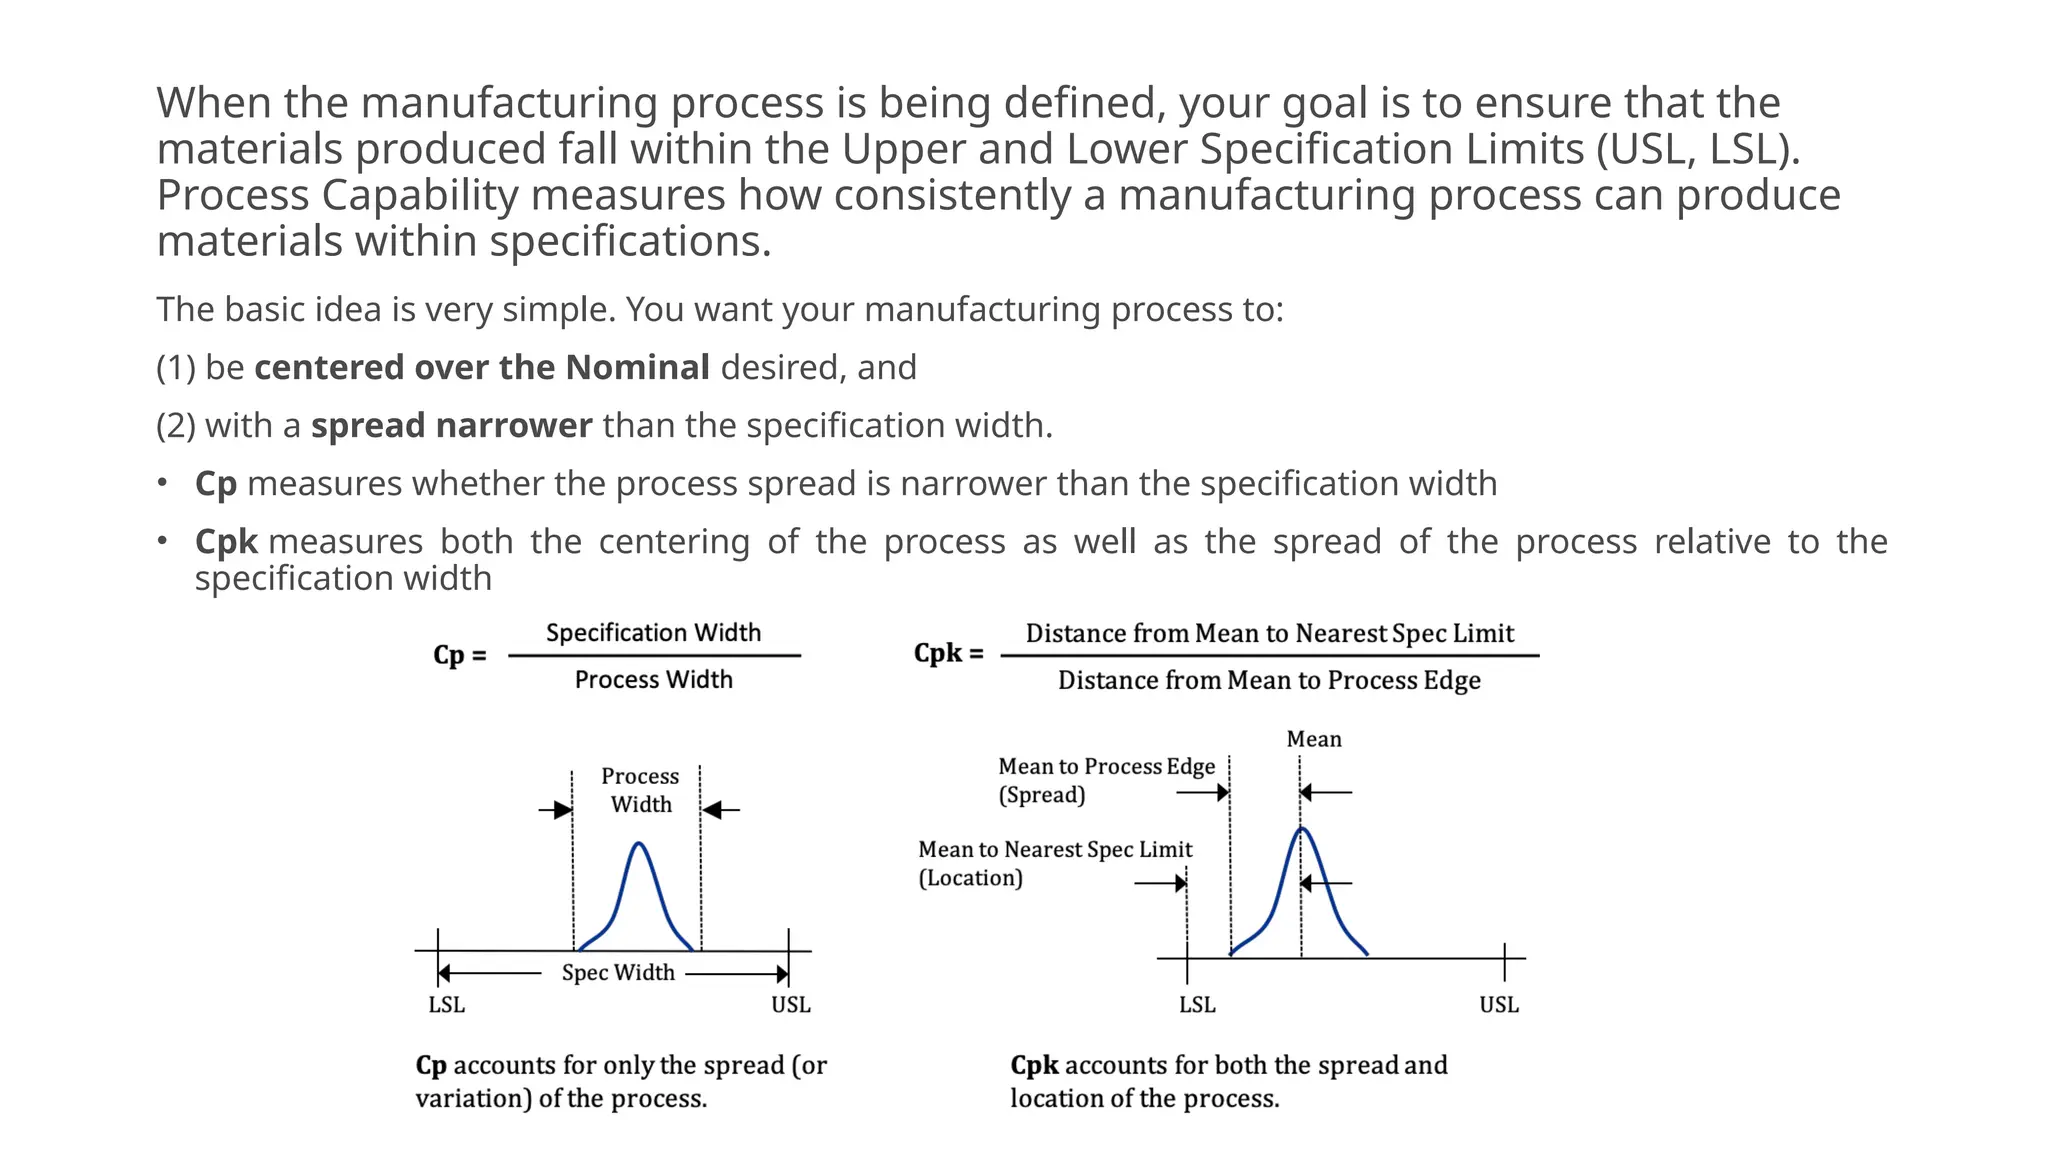
When the manufacturingprocess is being defined, your goal is to ensure that the
materials produced fall within the Upper and Lower Specification Limits (USL, LSL).
Process Capability measures how consistently a manufacturing process can produce
materials within specifications.
The basic idea is very simple. You want your manufacturing process to:
(1) be centered over the Nominal desired, and
(2) with a spread narrower than the specification width.
• Cp measures whether the process spread is narrower than the specification width
• Cpk measures both the centering of the process as well as the spread of the process relative to the
specification width
3.
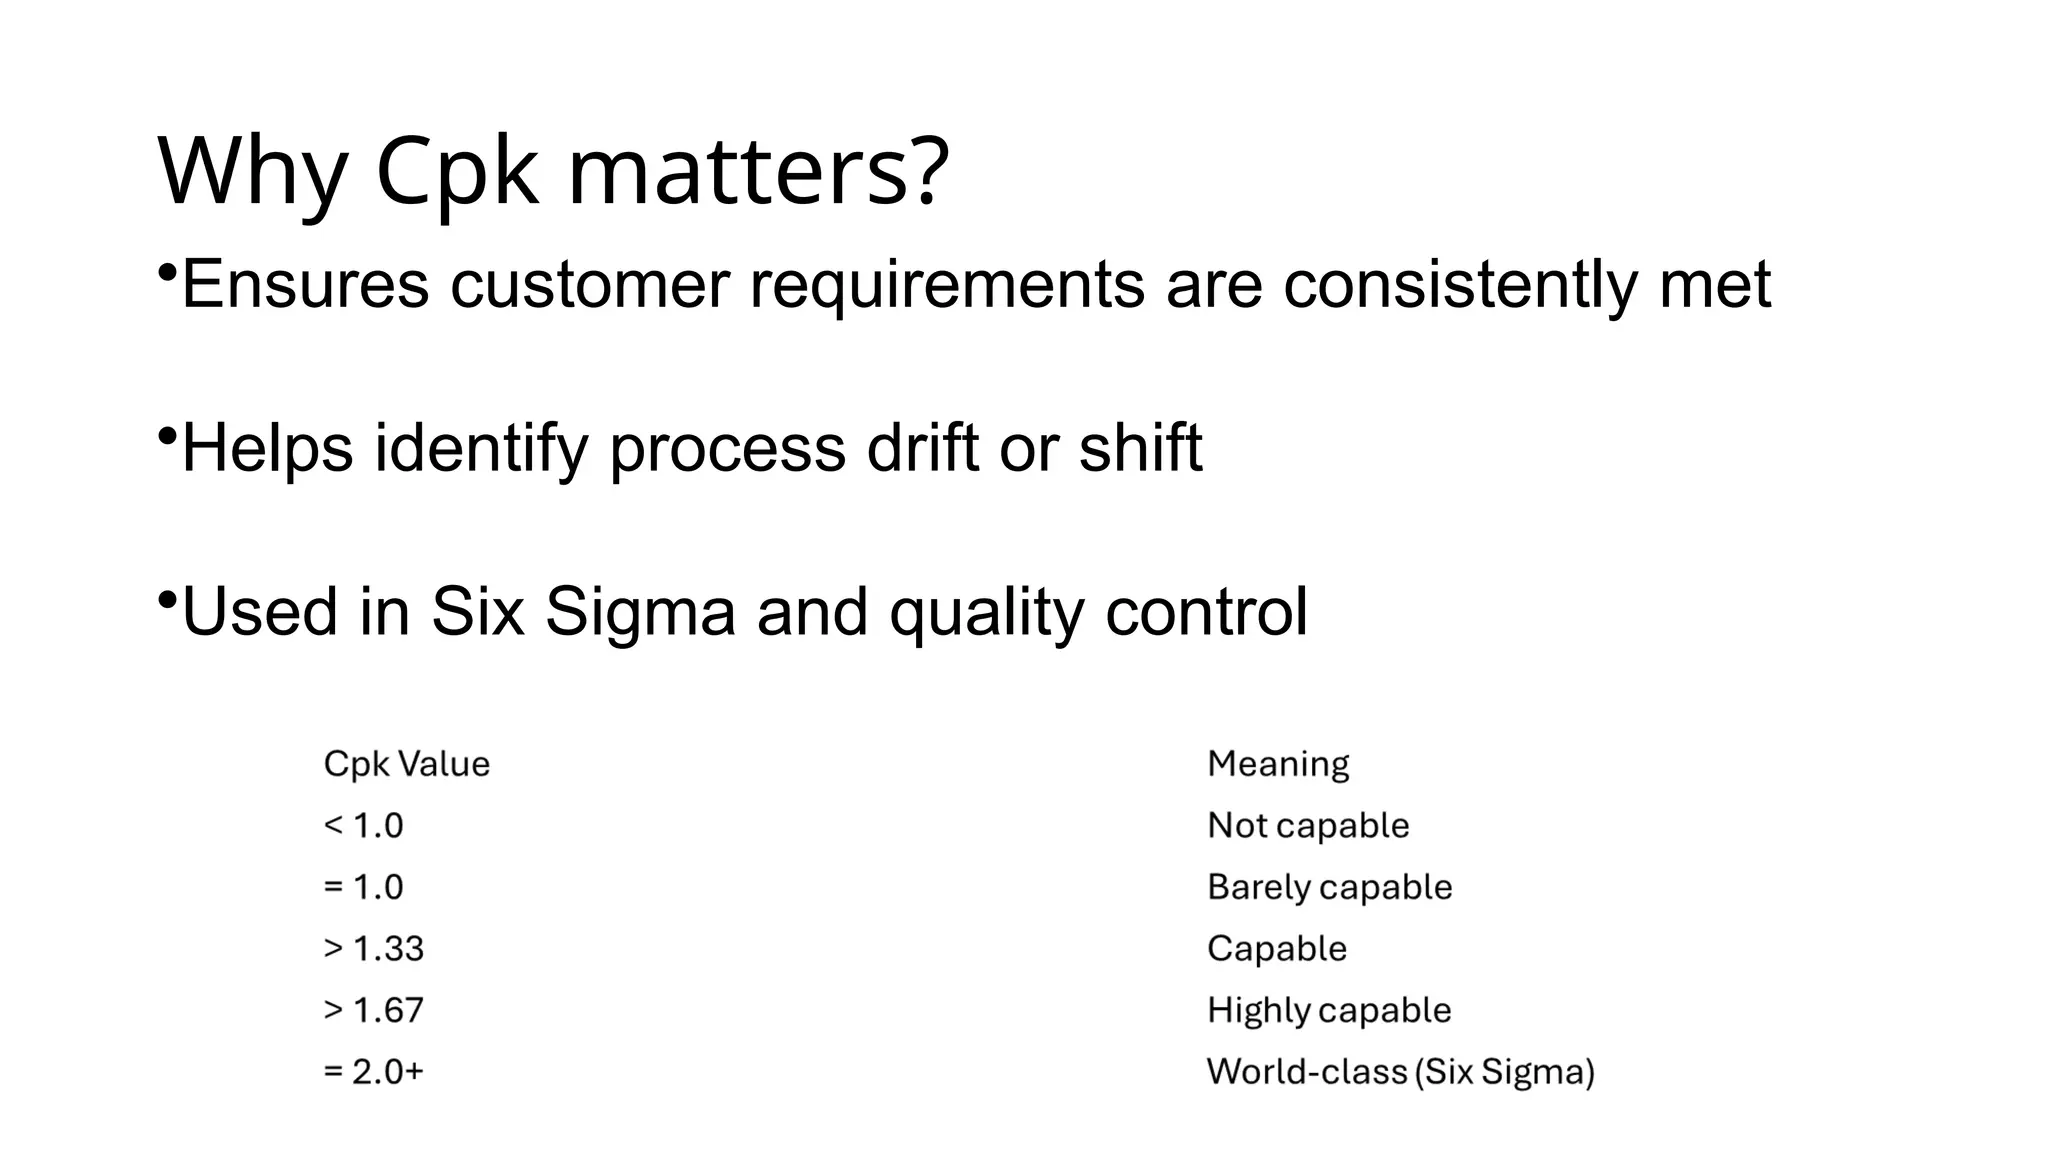
Why Cpk matters?
•Ensurescustomer requirements are consistently met
•Helps identify process drift or shift
•Used in Six Sigma and quality control
4.
Cpk is powerful,but only when used correctly.
Always confirm assumptions and use control
charts alongside it.
Cpk pitfalls to avoid:
•Assuming normality when it's not
•Using too few data points
•Ignoring process stability
•Not monitoring over time
5.
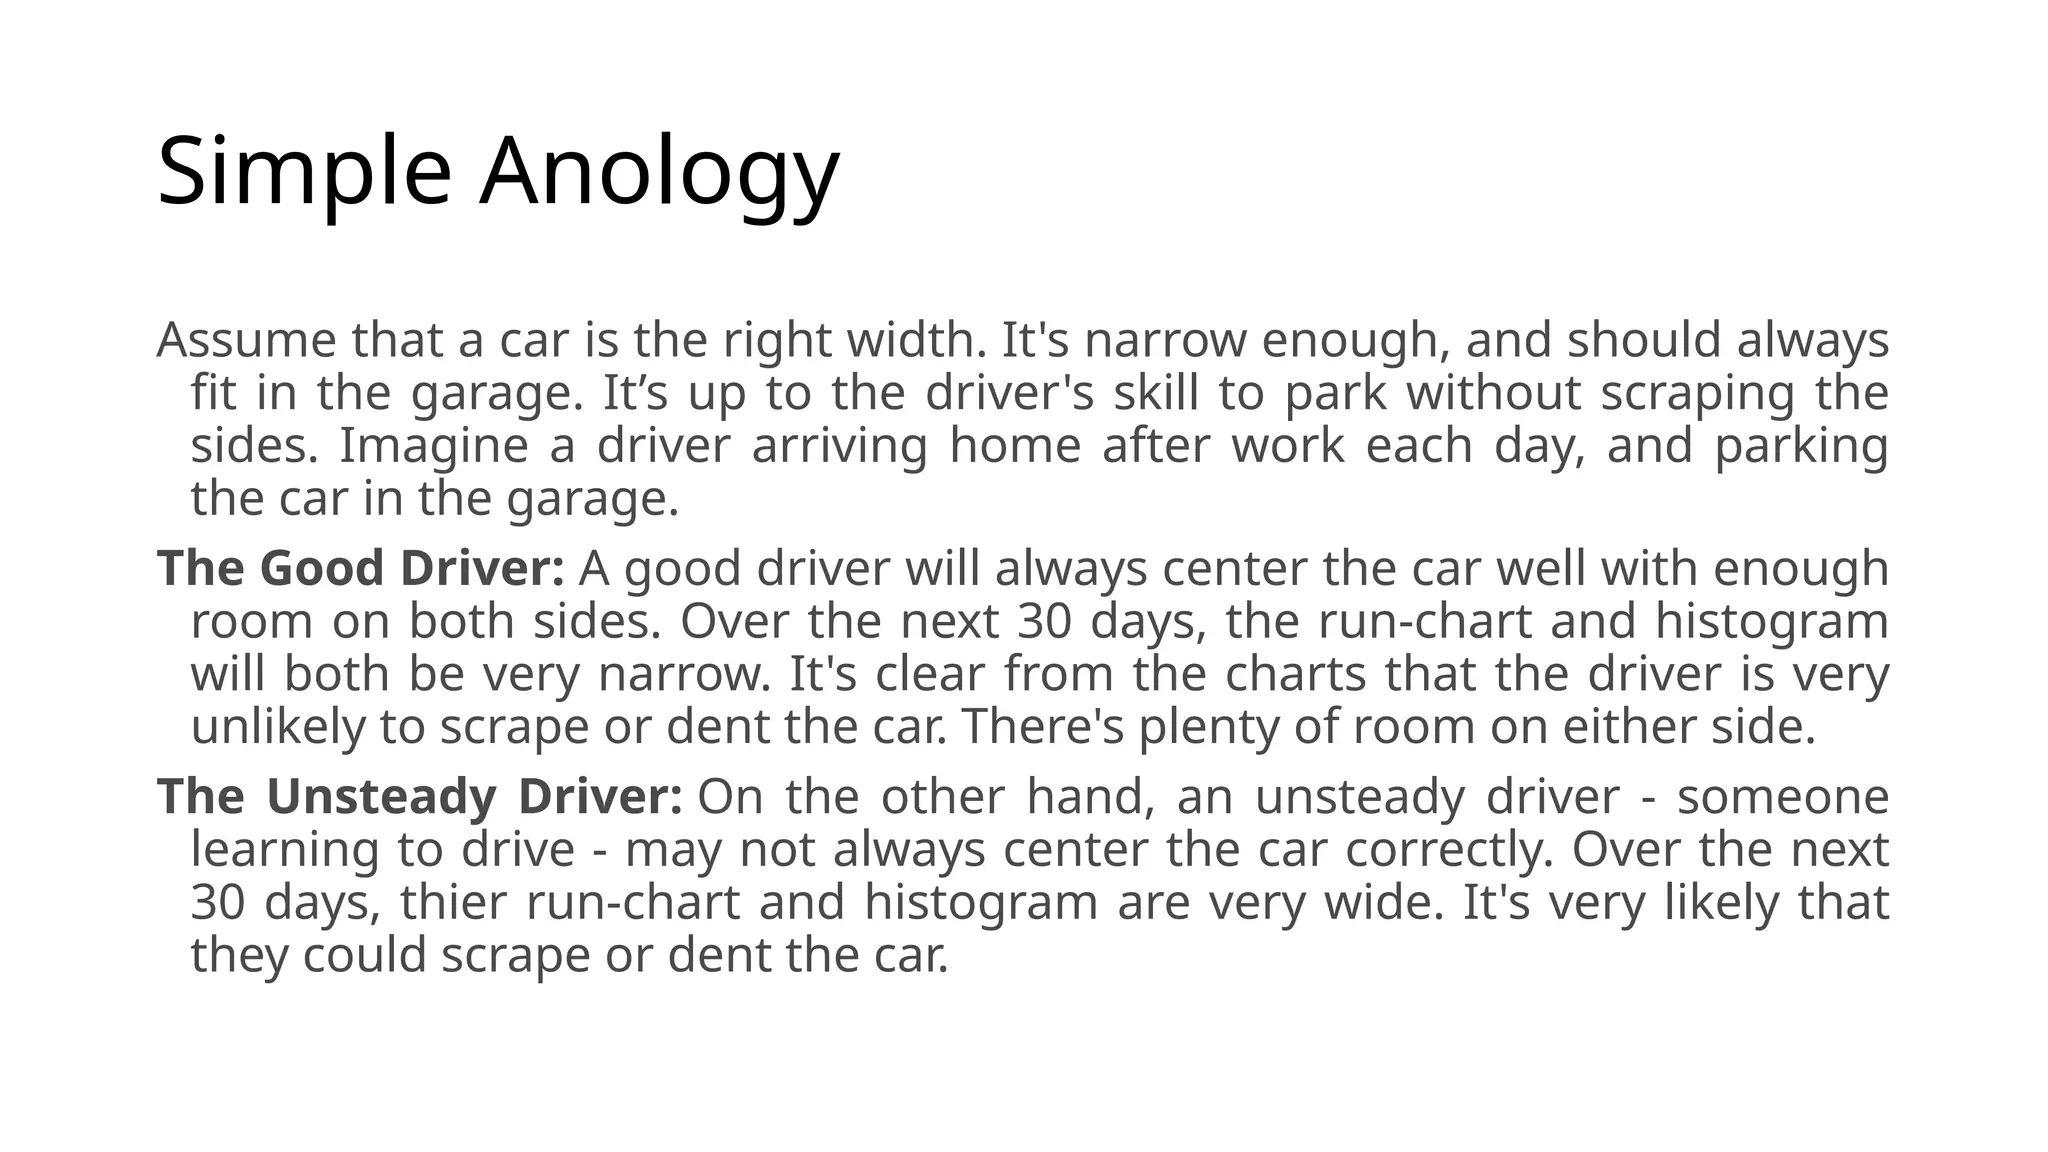
Simple Anology
Assume thata car is the right width. It's narrow enough, and should always
fit in the garage. It’s up to the driver's skill to park without scraping the
sides. Imagine a driver arriving home after work each day, and parking
the car in the garage.
The Good Driver: A good driver will always center the car well with enough
room on both sides. Over the next 30 days, the run-chart and histogram
will both be very narrow. It's clear from the charts that the driver is very
unlikely to scrape or dent the car. There's plenty of room on either side.
The Unsteady Driver: On the other hand, an unsteady driver - someone
learning to drive - may not always center the car correctly. Over the next
30 days, thier run-chart and histogram are very wide. It's very likely that
they could scrape or dent the car.
6.
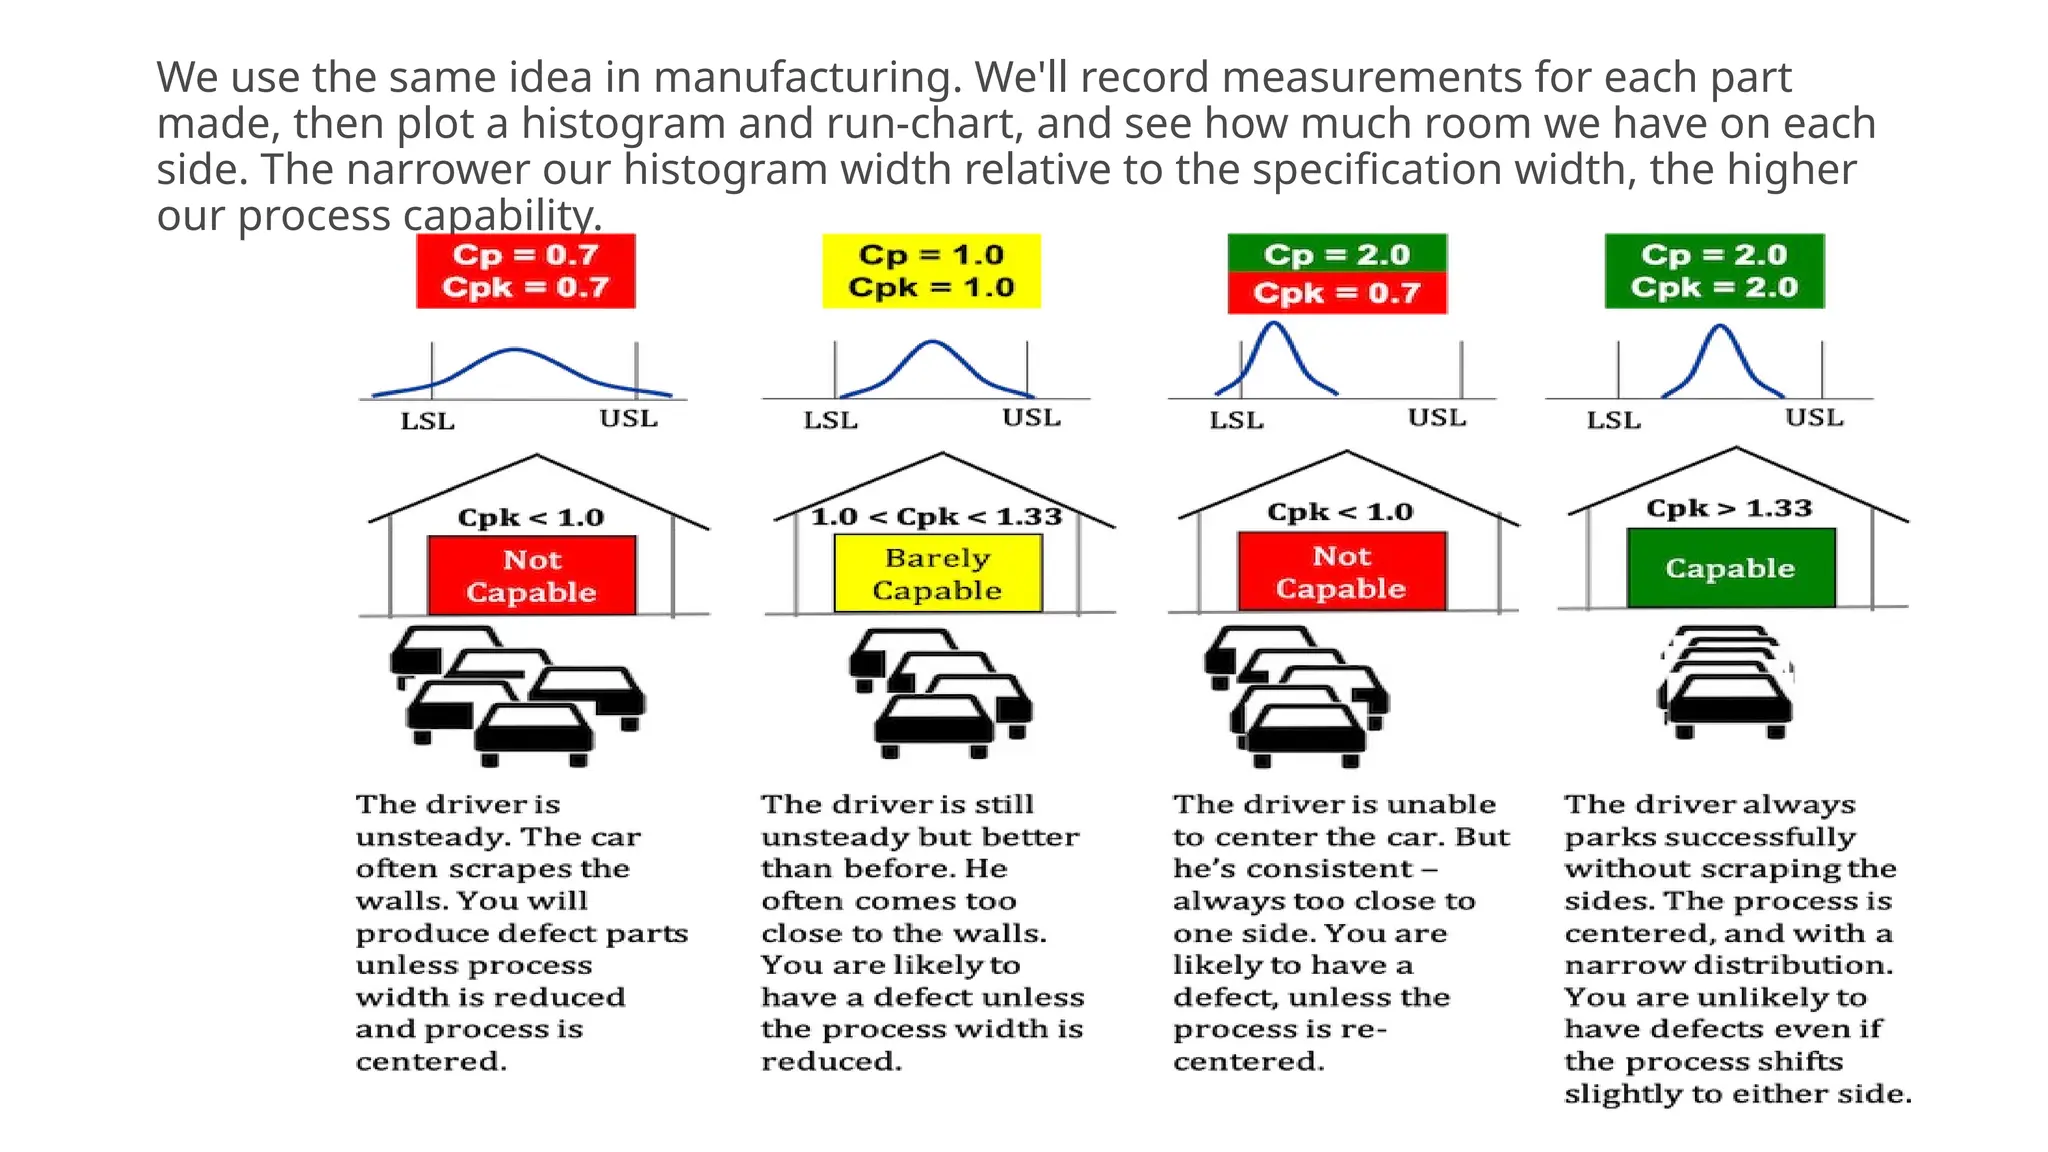
We use thesame idea in manufacturing. We'll record measurements for each part
made, then plot a histogram and run-chart, and see how much room we have on each
side. The narrower our histogram width relative to the specification width, the higher
our process capability.
What Cpk ValueShould You Aim For?
• In general, the higher the Cpk, the better. A Cpk value less
than 1.0 is considered poor and the process is not capable. A
value between 1.0 and 1.33 is considered barely capable, and
a value greater than 1.33 is considered capable.
• We should aim for a Cpk value of 2.00 or higher where
possible. A Cpk of 2.00 implies that the process uses only 50%
of the spec width, significantly reducing the risk of defect.
A high Cpk value has two important benefits:
(1) You'll be producing fewer defective products
(2) You'll improve your product's performance
10.
Summary
Cpk isn't justa number — it tells a story about
your process. Use it wisely!
• Cpk measures both spread and centering
• A higher Cpk = more capable process
• Always check data normality and process stability
• Use it with other quality tools (like control charts)


![[DSC Europe 25] Debmalya Biswas - Agentification: the art of transforming man...](https://cdn.slidesharecdn.com/ss_thumbnails/r5azlggvtqiaiiusrqdr-4-251212103249-5a12c89b-thumbnail.jpg?width=640&height=640&fit=bounds)

![[DSC Europe 25] Branko Dzakula - From Defense to Attack: How AI Redefines Cyb...](https://cdn.slidesharecdn.com/ss_thumbnails/80bdzdxpr3ky2g0qvyk9-8-251211083048-ce5fc1ee-thumbnail.jpg?width=640&height=640&fit=bounds)

![[DSC Europe 25] Dusan Nesic - Securing Tomorrow’s Infrastructure: Why Cyber-P...](https://cdn.slidesharecdn.com/ss_thumbnails/qikbszfftyowjm2q6duw-1-251211083848-8f2ead6b-thumbnail.jpg?width=640&height=640&fit=bounds)
![[DSC Europe 25] Milan Zdravkovic - The road less traveled in District Heating...](https://cdn.slidesharecdn.com/ss_thumbnails/nfaboniqwsz4ucyctnmy-2-milan-zdravkovic-dsc2025-the-road-less-traveled-in-district-heating-operation-251208151905-f56388a5-thumbnail.jpg?width=640&height=640&fit=bounds)
![[DSC Europe 25] Aleksandra Dragicevic - AI-Boosted Research in Healthcare: Fr...](https://cdn.slidesharecdn.com/ss_thumbnails/iqwngszurf2r7pi1lnnj-4-aleksandra-dragicevic-ad-dsc-europe-conference-20-251208151905-37c3238a-thumbnail.jpg?width=640&height=640&fit=bounds)
![[DSC Europe 25] Milan Sekuloski - Data, Defence, and Development: Cybersecuri...](https://cdn.slidesharecdn.com/ss_thumbnails/dfrkwwx4qly6atqpbl4z-4-251209104645-c3d4b0ca-thumbnail.jpg?width=640&height=640&fit=bounds)


![[DSC Europe 25] Goran Obradovic - The Rise of Sovereign AI: Building the Regi...](https://cdn.slidesharecdn.com/ss_thumbnails/7nw2xxixrxqdxvrb5wca-6-251205085714-ab09a2ac-thumbnail.jpg?width=640&height=640&fit=bounds)

![[DSC Europe 25] Bogdan Daniel Maruneac - AI - It starts with you.pptx](https://cdn.slidesharecdn.com/ss_thumbnails/odov3snhrcqs9hx5ny2n-4-251205085715-f1daacfe-thumbnail.jpg?width=640&height=640&fit=bounds)

