Downloaded 142 times
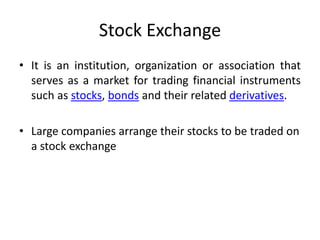
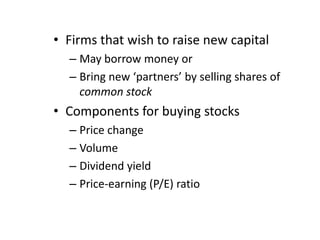
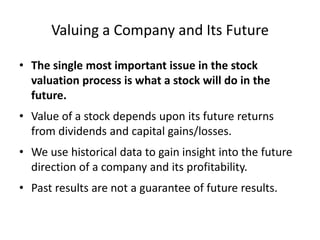
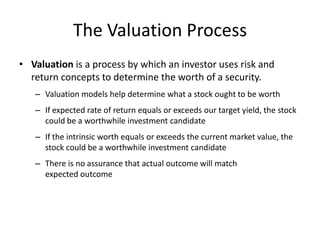
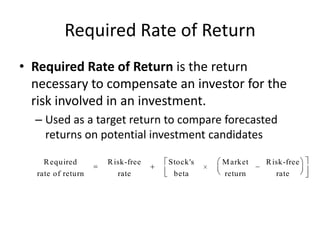
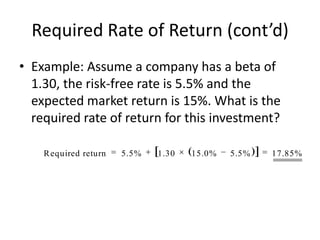
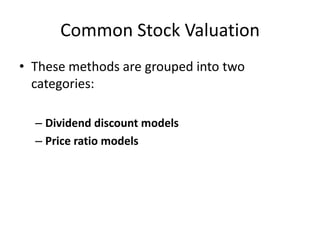
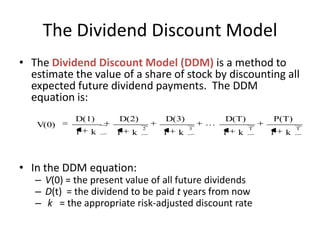
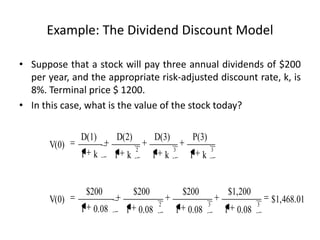
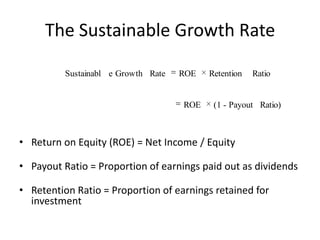
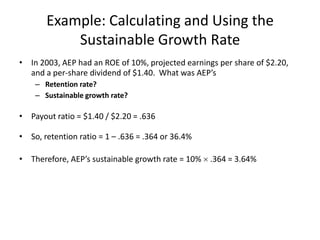
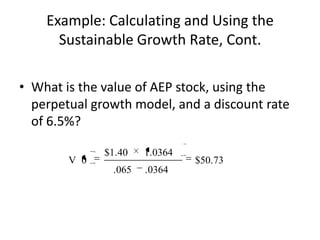
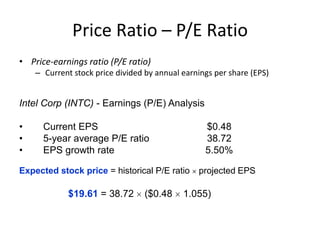


The document discusses stock valuation, explaining how stock exchanges facilitate the trading of financial instruments. It details valuation methods such as the dividend discount model and price ratio models, emphasizing the importance of future returns and required rates of return in investment decisions. Examples illustrate calculations for constant growth rates and sustainable growth rates, demonstrating how various factors influence stock valuations.