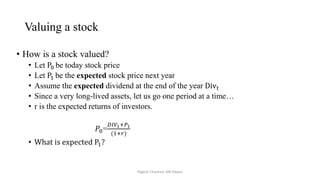
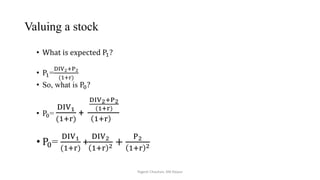
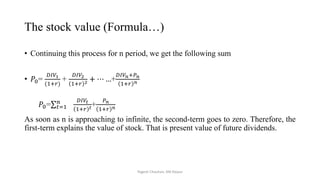
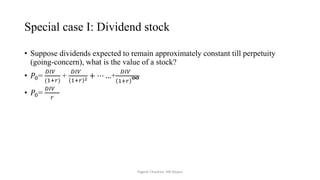
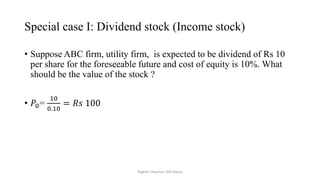
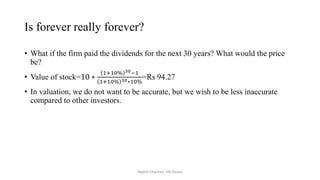
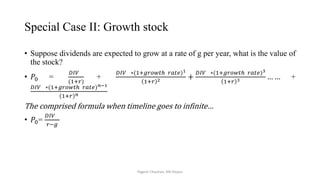
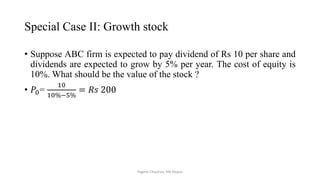
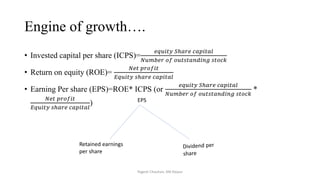
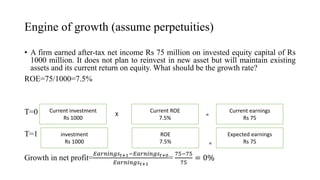
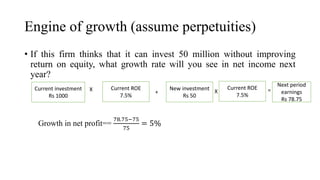
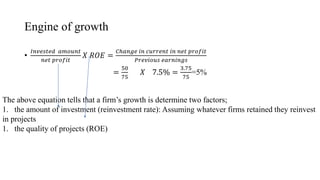
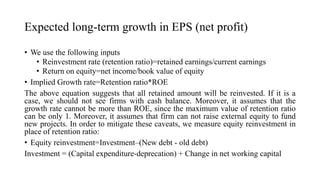
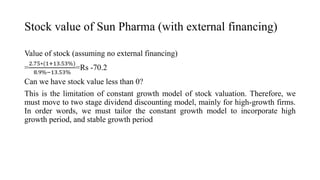
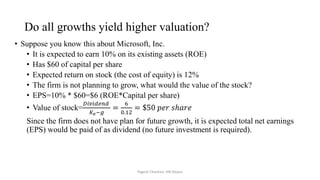
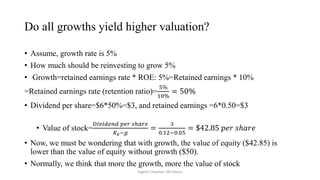
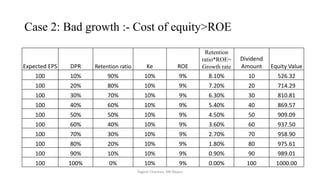
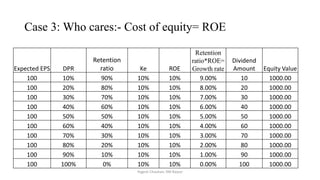
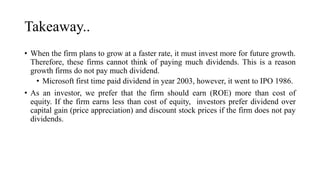
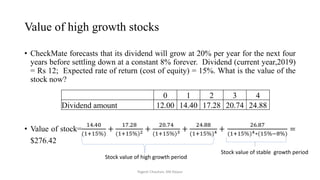
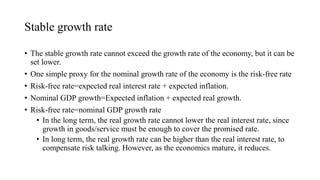
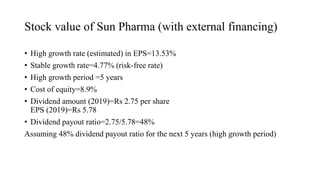
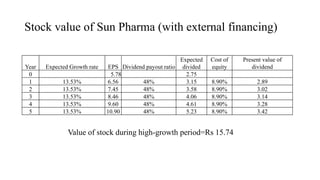
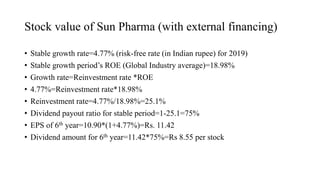
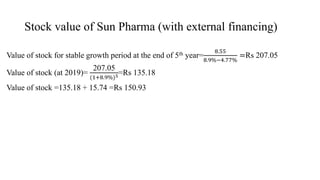
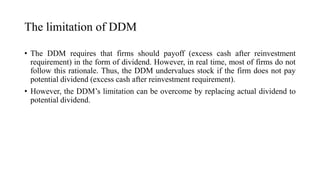
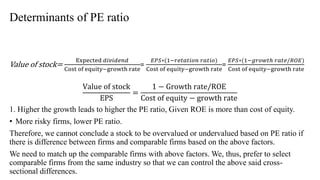
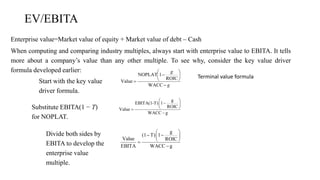
The document discusses valuation of stocks using the dividend discount model. It explains that under this model, the value of a stock is equal to the present value of all expected future dividend payments. The document then provides formulas for valuing stocks in different scenarios, such as when dividends are expected to remain constant forever, or grow at a constant rate. It also discusses how a company's reinvestment rate and return on equity determine its long-term growth rate.
1. Valuation of stock: Dividend discounting model
A Cynic view: A person knows the price of everything, but value of nothing (Oscar Wilde)
2. Pragmatic approach
• Most of financial investors do not buy financial assets based on emotional or
aesthetic reasons (such as gold). Therefore, the price paid for any asset should
reflect the cashflows it is expected to generate.
• Value of cash generate assets= Present value of future cashflows, generated by
both firms’ existing assets and growth assets.
3. Discounted cash flow valuation
• Value of asset=
𝐸(𝐶𝐹1)
(1+𝑟)
+
𝐸(𝐶𝐹2)
1+𝑟 ^2
+
𝐸(𝐶𝐹3)
1+𝑟 ^3
+……….. +
𝐸(𝐶𝐹𝑛)
1+𝑟 ^𝑛
Where the asset has n-year life, E(CF) is the expected cashflows (generated by both
firms’ existing assets and growth assets) in period t and r is discounted rate that
reflects the risk of the cashflows.
• If something that does not affect the expected cash flows or the riskiness of the
cash flows, It cannot affect value.
• For an asset to have value, the expected cash flows must be positive some time
over the life of the asset.
• if we can replace the expected cashflows with the guaranteed cashflows (certain
cashflows), what would be your discounting rate?
4. Dividend discount model (DDM)
• The dividend discount model is special class of discounted cashflow method that
assumes that the value of a stock is a direct function of future dividend payments
(since investors receive dividend).
5. Valuing a stock
• How is a stock valued?
• Let P0 be today stock price
• Let P1 be the expected stock price next year
• Assume the expected dividend at the end of the year Divt
• Since a very long-lived assets, let us go one period at a time…
• r is the expected returns of investors.
𝑃0=
𝐷𝐼𝑉1+𝑃1
(1+𝑟)
• What is expected P1?
Yogesh Chauhan, IIM Raipur
6.
7. Valuing a stock
• What is expected P1?
• P1=
DIV2+P2
(1+r)
• So, what is P0?
• P0=
DIV1
(1+r)
+
DIV2+P2
(1+r)
1+r
• P0=
DIV1
(1+r)
+
DIV2
1+r 2 +
P2
1+r 2
Yogesh Chauhan, IIM Raipur
8. The stock value (Formula…)
• Continuing this process for n period, we get the following sum
• 𝑃0=
𝐷𝐼𝑉1
(1+𝑟)
+
𝐷𝐼𝑉2
1+𝑟 2 + ⋯ …+
𝐷𝐼𝑉𝑛+𝑃𝑛
1+𝑟 𝑛
𝑃0= 𝑡=1
𝑛 𝐷𝐼𝑉𝑡
1+𝑟 𝑡+
𝑃𝑛
1+𝑟 𝑛
As soon as n is approaching to infinite, the second-term goes to zero. Therefore, the
first-term explains the value of stock. That is present value of future dividends.
Yogesh Chauhan, IIM Raipur
9. Special case I: Dividend stock
• Suppose dividends expected to remain approximately constant till perpetuity
(going-concern), what is the value of a stock?
• 𝑃0=
𝐷𝐼𝑉
(1+𝑟)
+
𝐷𝐼𝑉
1+𝑟 2 + ⋯ …+
𝐷𝐼𝑉
1+𝑟 ∞
• 𝑃0=
𝐷𝐼𝑉
𝑟
Yogesh Chauhan, IIM Raipur
10. Special case I: Dividend stock (Income stock)
• Suppose ABC firm, utility firm, is expected to be dividend of Rs 10
per share for the foreseeable future and cost of equity is 10%. What
should be the value of the stock ?
• 𝑃0=
10
0.10
= 𝑅𝑠 100
Yogesh Chauhan, IIM Raipur
11. Is forever really forever?
• What if the firm paid the dividends for the next 30 years? What would the price
be?
• Value of stock=10 ∗
1+10% 30−1
1+10% 30∗10%
=Rs 94.27
• In valuation, we do not want to be accurate, but we wish to be less inaccurate
compared to other investors.
Yogesh Chauhan, IIM Raipur
12. Special Case II: Growth stock
• Suppose dividends are expected to grow at a rate of g per year, what is the value of
the stock?
• 𝑃0 =
𝐷𝐼𝑉
(1+𝑟)
+
𝐷𝐼𝑉 ∗(1+𝑔𝑟𝑜𝑤𝑡ℎ 𝑟𝑎𝑡𝑒)1
1+𝑟 2 +
𝐷𝐼𝑉 ∗(1+𝑔𝑟𝑜𝑤𝑡ℎ 𝑟𝑎𝑡𝑒)3
1+𝑟 3 … … +
𝐷𝐼𝑉 ∗(1+𝑔𝑟𝑜𝑤𝑡ℎ 𝑟𝑎𝑡𝑒)𝑛−1
1+𝑟 𝑛
The comprised formula when timeline goes to infinite…
• 𝑃0=
𝐷𝐼𝑉
𝑟−𝑔
Yogesh Chauhan, IIM Raipur
13. Special Case II: Growth stock
• Suppose ABC firm is expected to pay dividend of Rs 10 per share and
dividends are expected to grow by 5% per year. The cost of equity is
10%. What should be the value of the stock ?
• 𝑃0=
10
10%−5%
= 𝑅𝑠 200
Yogesh Chauhan, IIM Raipur
14. Engine of growth….
• Invested capital per share (ICPS)=
𝑒𝑞𝑢𝑖𝑡𝑦 𝑆ℎ𝑎𝑟𝑒 𝑐𝑎𝑝𝑖𝑡𝑎𝑙
𝑁𝑢𝑚𝑏𝑒𝑟 𝑜𝑓 𝑜𝑢𝑡𝑠𝑡𝑎𝑛𝑑𝑖𝑛𝑔 𝑠𝑡𝑜𝑐𝑘
• Return on equity (ROE)=
𝑁𝑒𝑡 𝑝𝑟𝑜𝑓𝑖𝑡
𝐸𝑞𝑢𝑖𝑡𝑦 𝑠ℎ𝑎𝑟𝑒 𝑐𝑎𝑝𝑖𝑡𝑎𝑙
• Earning Per share (EPS)=ROE* ICPS (or
𝑒𝑞𝑢𝑖𝑡𝑦 𝑆ℎ𝑎𝑟𝑒 𝑐𝑎𝑝𝑖𝑡𝑎𝑙
𝑁𝑢𝑚𝑏𝑒𝑟 𝑜𝑓 𝑜𝑢𝑡𝑠𝑡𝑎𝑛𝑑𝑖𝑛𝑔 𝑠𝑡𝑜𝑐𝑘
*
𝑁𝑒𝑡 𝑝𝑟𝑜𝑓𝑖𝑡
𝐸𝑞𝑢𝑖𝑡𝑦 𝑠ℎ𝑎𝑟𝑒 𝑐𝑎𝑝𝑖𝑡𝑎𝑙
)
Retained earnings
per share
EPS
Yogesh Chauhan, IIM Raipur
15. Engine of growth (assume perpetuities)
• A firm earned after-tax net income Rs 75 million on invested equity capital of Rs
1000 million. It does not plan to reinvest in new asset but will maintain existing
assets and its current return on equity. What should be the growth rate?
ROE=75/1000=7.5%
T=0
T=1
Growth in net profit=
𝐸𝑎𝑟𝑛𝑖𝑛𝑔𝑠𝑡+1−𝐸𝑎𝑟𝑛𝑖𝑛𝑔𝑠𝑡+0
𝐸𝑎𝑟𝑛𝑖𝑛𝑔𝑠𝑡+1
=
75−75
75
= 0%
Current investment
Rs 1000
Current ROE
7.5%
Current earnings
Rs 75
X =
investment
Rs 1000
ROE
7.5%
Expected earnings
Rs 75
=
16. Engine of growth (assume perpetuities)
• If this firm thinks that it can invest 50 million without improving
return on equity, what growth rate will you see in net income next
year?
Current investment
Rs 1000
Current ROE
7.5%
New investment
Rs 50
Current ROE
7.5%
Next period
earnings
Rs 78.75
X + X =
Growth in net profit==
78.75−75
75
= 5%
17. Engine of growth
•
𝐼𝑛𝑣𝑒𝑠𝑡𝑒𝑑 𝑎𝑚𝑜𝑢𝑛𝑡
𝑛𝑒𝑡 𝑝𝑟𝑜𝑓𝑖𝑡
𝑋 𝑅𝑂𝐸 =
𝐶ℎ𝑎𝑛𝑔𝑒 𝑖𝑛 𝑐𝑢𝑟𝑟𝑒𝑛𝑡 𝑖𝑛 𝑛𝑒𝑡 𝑝𝑟𝑜𝑓𝑖𝑡
𝑃𝑟𝑒𝑣𝑖𝑜𝑢𝑠 𝑒𝑎𝑟𝑛𝑖𝑛𝑔𝑠
=
50
75
𝑋 7.5% =
3.75
75
=5%
The above equation tells that a firm’s growth is determine two factors;
1. the amount of investment (reinvestment rate): Assuming whatever firms retained they reinvest
in projects
1. the quality of projects (ROE)
18. Expected long-term growth in EPS (net profit)
• We use the following inputs
• Reinvestment rate (retention ratio)=retained earnings/current earnings
• Return on equity=net income/book value of equity
• Implied Growth rate=Retention ratio*ROE
The above equation suggests that all retained amount will be reinvested. If it is a
case, we should not see firms with cash balance. Moreover, it assumes that the
growth rate cannot be more than ROE, since the maximum value of retention ratio
can be only 1. Moreover, it assumes that firm can not raise external equity to fund
new projects. In order to mitigate these caveats, we measure equity reinvestment in
place of retention ratio:
• Equity reinvestment=Investment–(New debt - old debt)
Investment = (Capital expenditure-deprecation) + Change in net working capital
19.
20. Estimating expected growth in EPS: Sun Pharma
• Book value of equity (2019)=Rs. 27855.39
• Net income= Rs. 9995.92
• Return on equity= 9995.92/27855.39=35.885%
• Retained amount=Rs. 1,239.73
• Retention ratio= 1,239.73/ 9995.92=12.4%
• Implied growth rate (in EPS or net profit)=12.4%*35.885%=4.45%
21. Estimating growth in Net income: Sun Pharma (2019)
• Equity book value of Sun Pharma= Rs. 27855.39
• Cash balance= 155.27
Non-cash book value of equity= 27855.39- 155.27= 27700.12
Non-cash net income= 9995.92 (does not have cash income)
ROE= 9995.92/ 27700.12=36.09%
Equity reinvestment=(3763.8- 16.78)/ 9995.92=37.5%
• Net investment= 3763.8
• Net debt (new debt- old debt)=16.78
Growth rate=37.5%*36.09%=13.53%
22. Stock value of Sun Pharma (assuming no external
financing)
• Equity beta=0.61
• Risk-free rate (in Indian rupee)=6%
• Equity risk-premium=4.77%
• Cost of equity=6% + 4.77%*0.61=8.9%
• Dividend per share (2019)=Rs 2.75
Value of stock (assuming no external financing)
=
2.75∗(1+445%)
8.9%−4.45%
=Rs 64. 4
Market price was close to Rs. 475 and Rs 450
23. Stock value of Sun Pharma (with external financing)
Value of stock (assuming no external financing)
=
2.75∗(1+13.53%)
8.9%−13.53%
=Rs -70.2
Can we have stock value less than 0?
This is the limitation of constant growth model of stock valuation. Therefore, we
must move to two stage dividend discounting model, mainly for high-growth firms.
In order words, we must tailor the constant growth model to incorporate high
growth period, and stable growth period
24. Do all growths yield higher valuation?
• Suppose you know this about Microsoft, Inc.
• It is expected to earn 10% on its existing assets (ROE)
• Has $60 of capital per share
• Expected return on stock (the cost of equity) is 12%
• The firm is not planning to grow, what would the value of the stock?
• EPS=10% * $60=$6 (ROE*Capital per share)
• Value of stock=
𝐷𝑖𝑣𝑖𝑑𝑒𝑛𝑑
𝐾𝑒−𝑔
=
6
0.12
= $50 𝑝𝑒𝑟 𝑠ℎ𝑎𝑟𝑒
Since the firm does not have plan for future growth, it is expected total net earnings
(EPS) would be paid of as dividend (no future investment is required).
Yogesh Chauhan, IIM Raipur
25. Do all growths yield higher valuation?
• Assume, growth rate is 5%
• How much should be reinvesting to grow 5%
• Growth=retained earnings rate * ROE: 5%=Retained earnings * 10%
=Retained earnings rate (retention ratio)=
5%
10%
= 50%
• Dividend per share=$6*50%=$3, and retained earnings =6*0.50=$3
• Value of stock=
𝐷𝑖𝑣𝑖𝑑𝑒𝑛𝑑 𝑝𝑒𝑟 𝑠ℎ𝑎𝑟𝑒
𝐾𝑒−𝑔
=
3
0.12−0.05
= $42.85 𝑝𝑒𝑟 𝑠ℎ𝑎𝑟𝑒
• Now, we must be wondering that with growth, the value of equity ($42.85) is
lower than the value of equity without growth ($50).
• Normally, we think that more the growth, more the value of stock
Yogesh Chauhan, IIM Raipur
29. Takeaway..
• When the firm plans to grow at a faster rate, it must invest more for future growth.
Therefore, these firms cannot think of paying much dividends. This is a reason
growth firms do not pay much dividend.
• Microsoft first time paid dividend in year 2003, however, it went to IPO 1986.
• As an investor, we prefer that the firm should earn (ROE) more than cost of
equity. If the firm earns less than cost of equity, investors prefer dividend over
capital gain (price appreciation) and discount stock prices if the firm does not pay
dividends.
30. Value of high growth stocks
• Stock value=Present value of dividend for high-growth period +
Present value of dividend for stable-growth period
31. Value of high growth stocks
• CheckMate forecasts that its dividend will grow at 20% per year for the next four
years before settling down at a constant 8% forever. Dividend (current year,2019)
= Rs 12; Expected rate of return (cost of equity) = 15%. What is the value of the
stock now?
• Value of stock=
14.40
(1+15%)
+
17.28
(1+15%)2 +
20.74
(1+15%)3 +
24.88
(1+15%)4 +
26.87
(1+15%)4∗(15%−8%)
=
$276.42
Yogesh Chauhan, IIM Raipur
0 1 2 3 4
Dividend amount 12.00 14.40 17.28 20.74 24.88
Stock value of high growth period
Stock value of stable growth period
32. Stable growth rate
• The stable growth rate cannot exceed the growth rate of the economy, but it can be
set lower.
• One simple proxy for the nominal growth rate of the economy is the risk-free rate
• Risk-free rate=expected real interest rate + expected inflation.
• Nominal GDP growth=Expected inflation + expected real growth.
• Risk-free rate=nominal GDP growth rate
• In the long term, the real growth rate cannot lower the real interest rate, since
growth in goods/service must be enough to cover the promised rate.
• In long term, the real growth rate can be higher than the real interest rate, to
compensate risk talking. However, as the economics mature, it reduces.
33. Stock value of Sun Pharma (with external financing)
• High growth rate (estimated) in EPS=13.53%
• Stable growth rate=4.77% (risk-free rate)
• High growth period =5 years
• Cost of equity=8.9%
• Dividend amount (2019)=Rs 2.75 per share
EPS (2019)=Rs 5.78
• Dividend payout ratio=2.75/5.78=48%
Assuming 48% dividend payout ratio for the next 5 years (high growth period)
34. Stock value of Sun Pharma (with external financing)
Year Expected Growth rate EPS Dividend payout ratio
Expected
divided
Cost of
equity
Present value of
dividend
0 5.78 2.75
1 13.53% 6.56 48% 3.15 8.90% 2.89
2 13.53% 7.45 48% 3.58 8.90% 3.02
3 13.53% 8.46 48% 4.06 8.90% 3.14
4 13.53% 9.60 48% 4.61 8.90% 3.28
5 13.53% 10.90 48% 5.23 8.90% 3.42
Value of stock during high-growth period=Rs 15.74
35. Stock value of Sun Pharma (with external financing)
• Stable growth rate=4.77% (risk-free rate (in Indian rupee) for 2019)
• Stable growth period’s ROE (Global Industry average)=18.98%
• Growth rate=Reinvestment rate *ROE
• 4.77%=Reinvestment rate*18.98%
• Reinvestment rate=4.77%/18.98%=25.1%
• Dividend payout ratio for stable period=1-25.1=75%
• EPS of 6th year=10.90*(1+4.77%)=Rs. 11.42
• Dividend amount for 6th year=11.42*75%=Rs 8.55 per stock
36. Stock value of Sun Pharma (with external financing)
Value of stock for stable growth period at the end of 5th year=
8.55
8.9%−4.77%
=Rs 207.05
Value of stock (at 2019)=
207.05
(1+8.9%)5=Rs 135.18
Value of stock =135.18 + 15.74 =Rs 150.93
37. The limitation of DDM
• The DDM requires that firms should payoff (excess cash after reinvestment
requirement) in the form of dividend. However, in real time, most of firms do not
follow this rationale. Thus, the DDM undervalues stock if the firm does not pay
potential dividend (excess cash after reinvestment requirement).
• However, the DDM’s limitation can be overcome by replacing actual dividend to
potential dividend.
41. Why relative valuation?
• I purchased a land near to IIM Raipur, paid Rs. 10,000,00 for 1000 sqrt ft land.
Now, you want to buy 2000 sqrt ft land, how much would you pay?
• It is easy to convey. It is easy to sell pricing than valuation.
• If you are wrong with relative valuation, there are others to be wrong along with
you but, in DCF, you are alone.
• Since, we live in a relative world, we more appreciate more relativity. For
instance, the performance of mutual fund’s manager.
42. The essence of relative valuation
• In DCF, the objective is to find the value of assets, given their cash flows, growth, and
risk characteristics.
• In relative valuation, the objective is to price assets based on how similar assets are
currently priced in the market. Therefore, the relative valuation is much more
likely to reflect the current mood of the market.
• To do relative valuation then,
• Convert market values into standardized value, since the absolutes prices cannot
be compared. This process of standardizing creates price multiples.
• Compare the standardized value or multiple for assets being analyzed to the
standardized value for comparable asset, controlling for any differences between
firms that might affect the multiple, to judge whether the asset in under or over
valued.
43. Basic steps to using multiples
Market value of
equity
Market value of
Firm=Debt + equity
Enterprise value (EV)=Debt + Equity-Cash
𝑀𝑢𝑙𝑡𝑖𝑝𝑙𝑒 =
𝑁𝑢𝑚𝑒𝑟𝑎𝑡𝑜𝑟 = 𝑊ℎ𝑎𝑡 𝑦𝑜𝑢 𝑎𝑟𝑒 𝑝𝑎𝑦𝑖𝑛𝑔 𝑓𝑜𝑟 𝑡ℎ𝑒 𝑎𝑠𝑠𝑒𝑡𝑠 (𝑆ℎ𝑜𝑢𝑙𝑑 𝑏𝑒 𝑚𝑎𝑟𝑒𝑘𝑡 𝑏𝑎𝑠𝑒𝑑)
𝐷𝑒𝑛𝑜𝑚𝑖𝑛𝑎𝑡𝑜𝑟 = 𝑊ℎ𝑎𝑡 𝑦𝑜𝑢 𝑎𝑟𝑒 𝑔𝑒𝑡𝑡𝑖𝑛𝑔 𝑖𝑛 𝑟𝑒𝑡𝑢𝑟𝑛
Revenues
a. Accounting
revenues
b. Drivers
a. Customers
b. Subscribers
c. units
Earnings
a. To equity investors
a. PAT
b. EPS
b. To firm
a. Operating
income (EBIT)
Book value
a. BV of Equity
b. Firm
a. BV of equity + BV of
debt
44. Definition tests
• Is the multiple consistently defined?
• Proposition 1: Both the value (the numerator), and the standardizing variable (the
denominator) should be to the same claimholders in the firm. For instance, the
value of equity should be divided by equity earnings or equity book value, and firm
value should be divided by firm earnings or book value.
45. Definition tests
Is the multiple uniformly estimated?
The variables used in defining the multiple should be estimated uniformly across assets
in the “ comparable firms” list.
If earnings-based multiples are used, the accounting rules to measure earnings should
be applied consistently across assets.
46. Definition tests: PE ratio
• Price to earning ratio=Market price/EPS
• Usually, the current price (some like to use average price over last 6 months or year EPS)
• Time variants: EPS in most recent financial year (current), EPS in most recent four quarters
(trailing), EPS expected in next fiscal year or next four quarters (forward)
• TCS March 2019 EPS=Rs 80.17
• Market price of TCS (Nov 29, 2019)=Rs 2051.65
• Current price to earning ratio=
2051.65
80.17
=25.59 x
• Industry PE ratio=20.03 x
• Trailing PE ratio=Current market price/TTM EPS= 2051.65/ 87.85=23.35x
Mar-19 Sep-19 Jun-19 Sep-18 Jun-18 TTM EPS
80.17 23.02 23.22 19.92 18.64 87.85
47. Definition tests: PE ratio
Forward EPS=Rs 87.3
Forward PE ratio= Current market price/Forward EPS= 2051.65/ 95.7=21.43x
A period of rising earnings, as a bullish analyst will use forward PE ratio to show that
stock is undervalued, whereas a bearish analyst will use current PE ratio to show that
stock is overvalued.
• You can take any firm; you can create n number of PE ratio. Hence, you should same
ratio for your sample.
PE
ratio Current TTM Forward
25.59 23.35 21.43
49. PE ratio of Indian Firm (Sept 2020)
TTM PE Forward P/E ( Current P/E,
Mean 25 26 33
Median 13 18 19
Max 923 412 1719
1st quantile 7 10 11
3rd quantile 24 31 35
Std 60 36 82
N 594 622 599
50. Determinants of PE ratio
Value of stock=
Expected 𝑑𝑖𝑣𝑖𝑑𝑒𝑛𝑑
Cost of equity−growth rate
=
𝐸𝑃𝑆∗(1−𝑟𝑒𝑡𝑎𝑡𝑖𝑜𝑛 𝑟𝑎𝑡𝑖𝑜)
Cost of equity−growth rate
=
𝐸𝑃𝑆∗(1−𝑔𝑟𝑜𝑤𝑡ℎ 𝑟𝑎𝑡𝑒/𝑅𝑂𝐸)
Cost of equity−growth rate
Value of stock
EPS
=
1 − Growth rate/ROE
Cost of equity − growth rate
1. Higher the growth leads to higher the PE ratio, Given ROE is more than cost of equity.
• More risky firms, lower PE ratio.
Therefore, we cannot conclude a stock to be overvalued or undervalued based on PE ratio if
there is difference between firms and comparable firms based on the above factors.
We need to match up the comparable firms with above factors. We, thus, prefer to select
comparable firms from the same industry so that we can control the above said cross-
sectional differences.
51. Can we compare multiples across markets?
• Countries with higher real interest rates should have lower multiples than
countries with lower real interest rate.
• Countries with higher expected growth rate should have higher multiples than
countries with lower expected growth rate.
• Countries that are viewed as riskier should have lower multiples than countries
that are viewed less risky.
• Countries where firms are more efficient in investments ( and earn a higher return
on these investments) should have higher multiples.
52. EV/EBITA
g
(1 T) 1
Value ROIC
EBITA WACC g
g
g
WACC
ROIC
1
NOPLAT
Value
g
EBITA(1-T) 1
ROIC
Value
WACC g
Substitute EBITA(1 − T)
for NOPLAT.
Start with the key value
driver formula.
Divide both sides by
EBITA to develop the
enterprise value
multiple.
Enterprise value=Market value of equity + Market value of debt – Cash
When computing and comparing industry multiples, always start with enterprise value to EBITA. It tells
more about a company’s value than any other multiple. To see why, consider the key value driver
formula developed earlier:
Terminal value formula
53. TCS: EV/ EBITDA
Market Capitalization (on May 29, 2020) 752,428.18
Book value of debt 6,906.00
Less Cash 9,666.00
Enterprise value 749,668.18
Operating profit (EBIT) 46,701.00
EV/Operating Profit 16.05
54. Large-Software firms: EV/ EBITDA
Mean 12.15
Median 11.89
Standard Deviation 7.53
Minimum 2.31
Maximum 33.30
Count 20.00