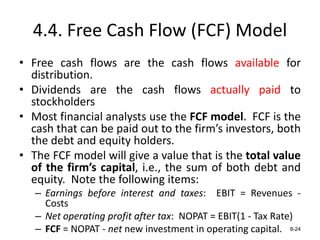
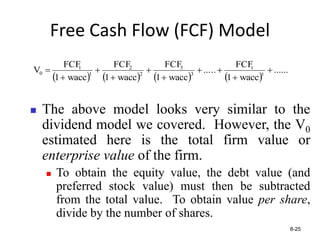
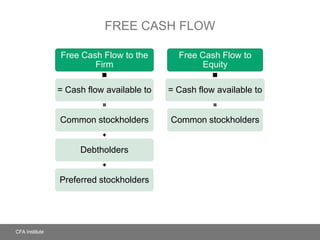
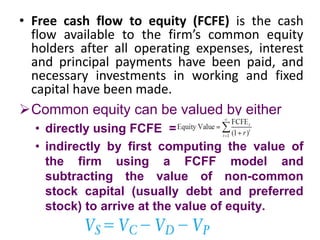
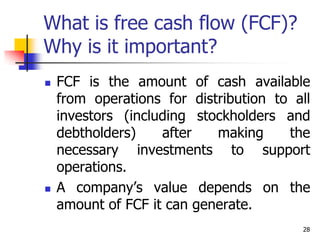
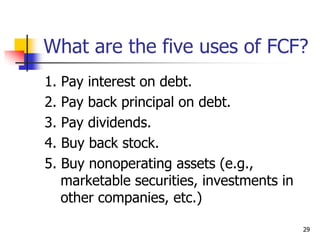
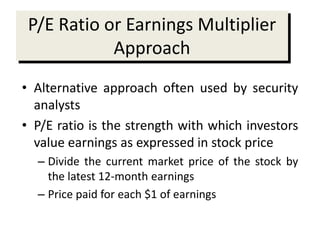
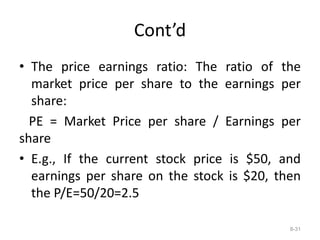
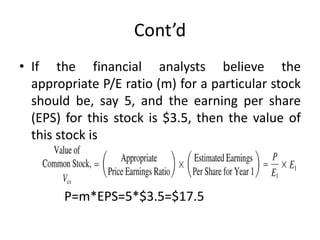
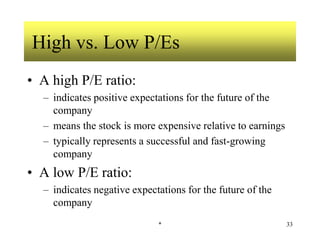
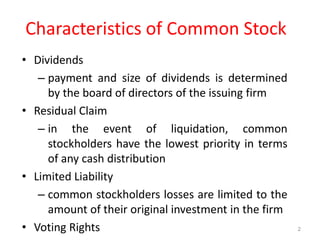
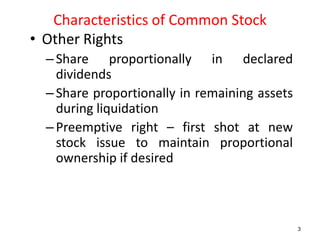
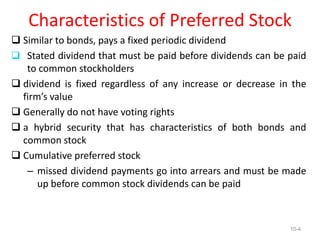
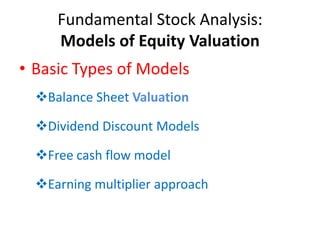
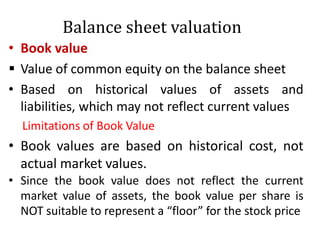
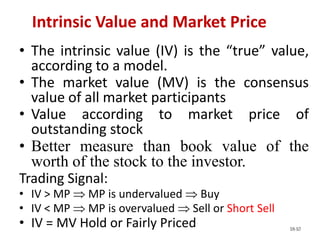
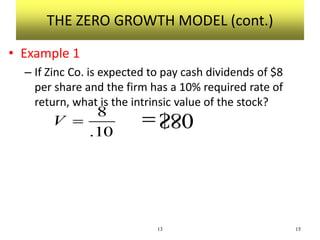
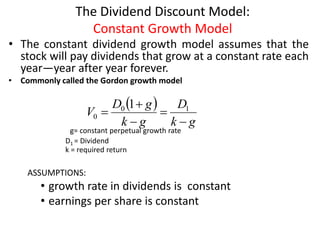
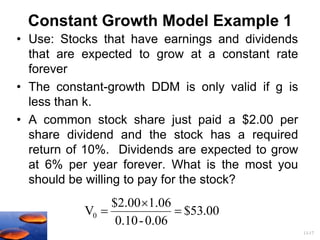
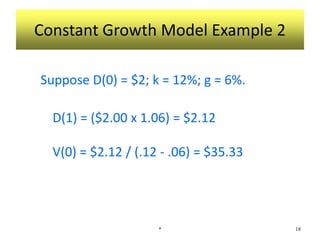
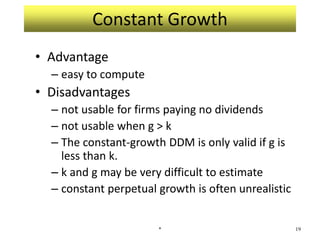
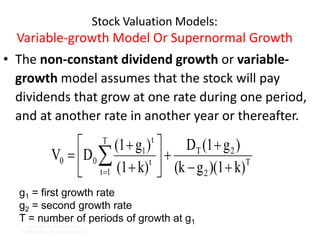
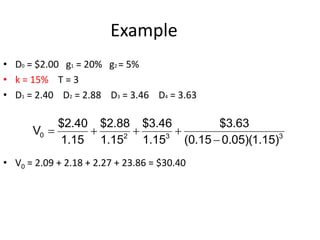
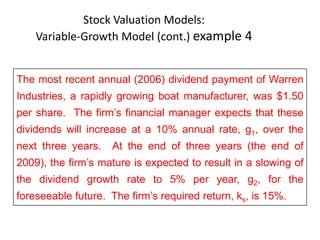
CHAPTER – 5
STOCK AND EQUITY
VALUATION
Characteristics of Common Stock
• Dividends
– payment and size of dividends is determined
by the board of directors of the issuing firm
• Residual Claim
– in the event of liquidation, common
stockholders have the lowest priority in terms
of any cash distribution
• Limited Liability
– common stockholders losses are limited to the
amount of their original investment in the firm
• Voting Rights 2
Characteristics of Common Stock
• Other Rights
–Share proportionally in declared
dividends
–Share proportionally in remaining assets
during liquidation
–Preemptive right – first shot at new
stock issue to maintain proportional
ownership if desired
3
Characteristics of Preferred Stock
 Similar to bonds, pays a fixed periodic dividend
 Stated dividend that must be paid before dividends can be paid
to common stockholders
 dividend is fixed regardless of any increase or decrease in the
firm’s value
 Generally do not have voting rights
 a hybrid security that has characteristics of both bonds and
common stock
 Cumulative preferred stock
– missed dividend payments go into arrears and must be made
up before common stock dividends can be paid
10-4
Fundamental Stock Analysis:
Models of Equity Valuation
• Basic Types of Models
Balance Sheet Valuation
Dividend Discount Models
Free cash flow model
Earning multiplier approach
Balance sheet valuation
• Book value
 Value of common equity on the balance sheet
• Based on historical values of assets and
liabilities, which may not reflect current values
Limitations of Book Value
• Book values are based on historical cost, not
actual market values.
• Since the book value does not reflect the current
market value of assets, the book value per share is
NOT suitable to represent a “floor” for the stock price
18-10
• The intrinsic value (IV) is the “true” value,
according to a model.
• The market value (MV) is the consensus
value of all market participants
• Value according to market price of
outstanding stock
• Better measure than book value of the
worth of the stock to the investor.
Trading Signal:
• IV > MP  MP is undervalued  Buy
• IV < MP  MP is overvalued  Sell or Short Sell
• IV = MV Hold or Fairly Priced
Intrinsic Value and Market Price
13-11
Balance sheet valuation (cont..)
• Liquidation value
– Net amount that can be realized by selling the
assets of a firm at market prices and paying
off the debt
– Since the liquidation value reflects the current
market value of assets, it can be viewed as a
better floor for the stock price than the book
value
The Dividend Discount Model
• The Dividend Discount Model (DDM) is a method to
estimate the value of a share of stock by discounting all
expected future dividend payments. The DDM
equation is: The Basic Stock Valuation Equation
In the DDM equation:
• V0 = Value of Stock
• Dt = Dividend in time t
• k = required return on common stock
© 2009 McGraw-Hill Ryerson Limited 7-12
       T
3
2
k
1
D(T)
k
1
D(3)
k
1
D(2)
k
1
D(1)
V(0)







 
Example: The Dividend Discount Model
• Suppose that a stock will pay three annual
dividends of $200 per year, and the
appropriate risk-adjusted discount rate, k, is
8%.
In this case, what is the value of the stock
today?
6-13
     
     
$515.42
0.08
1
$200
0.08
1
$200
0.08
1
$200
P
k
1
D
k
1
D
k
1
D
P
3
2
0
3
3
2
2
1
0













The Dividend Discount Model:
The Zero Growth Model
• The zero dividend growth model assumes
that the stock will pay the same dividend each
year, year after year.
• the future dividends remain constant such
that
D1 = D2 = D3 = D4 = . . . = DN
Copyright © 2009 Pearson
Prentice Hall. All rights reserved. 7-14
THE ZERO GROWTH MODEL (cont.)
• Example 1
– If Zinc Co. is expected to pay cash dividends of $8
per share and the firm has a 10% required rate of
return, what is the intrinsic value of the stock?
13 15
10
.
8

V
80
$

The Dividend Discount Model:
Constant Growth Model
• The constant dividend growth model assumes that the
stock will pay dividends that grow at a constant rate each
year—year after year forever.
• Commonly called the Gordon growth model
g= constant perpetual growth rate
D1 = Dividend
k = required return
ASSUMPTIONS:
• growth rate in dividends is constant
• earnings per share is constant
7-16
 
g
k
D
g
k
g
D
V




 1
0
0
1
13-17
Constant Growth Model Example 1
• Use: Stocks that have earnings and dividends
that are expected to grow at a constant rate
forever
• The constant-growth DDM is only valid if g is
less than k.
• A common stock share just paid a $2.00 per
share dividend and the stock has a required
return of 10%. Dividends are expected to grow
at 6% per year forever. What is the most you
should be willing to pay for the stock?
00
.
53
$
0.06
-
0.10
1.06
$2.00
V0 


Constant Growth Model Example 2
Suppose D(0) = $2; k = 12%; g = 6%.
D(1) = ($2.00 x 1.06) = $2.12
V(0) = $2.12 / (.12 - .06) = $35.33
* 18
Constant Growth
• Advantage
– easy to compute
• Disadvantages
– not usable for firms paying no dividends
– not usable when g > k
– The constant-growth DDM is only valid if g is
less than k.
– k and g may be very difficult to estimate
– constant perpetual growth is often unrealistic
* 19
Stock Valuation Models:
Variable-growth Model Or Supernormal Growth
• The non-constant dividend growth or variable-
growth model assumes that the stock will pay
dividends that grow at one rate during one period,
and at another rate in another year or thereafter.
Copyright © 2009 Pearson
Prentice Hall. All rights reserved. 7-20
T
2
2
T
T
1
t
t
t
1
0
0
k)
)(1
g
(k
)
g
(1
D
k)
(1
)
g
(1
D
V












 

g1 = first growth rate
g2 = second growth rate
T = number of periods of growth at g1
Example
• D0 = $2.00 g1 = 20% g2 = 5%
• k = 15% T = 3
• D1 = 2.40 D2 = 2.88 D3 = 3.46 D4 = 3.63
• V0 = 2.09 + 2.18 + 2.27 + 23.86 = $30.40
3
3
2
0
)
15
.
1
)(
05
.
0
15
.
0
(
63
.
3
$
15
.
1
46
.
3
$
15
.
1
88
.
2
$
15
.
1
40
.
2
$
V





Stock Valuation Models:
Variable-Growth Model (cont.) example 4
7-22
The most recent annual (2006) dividend payment of Warren
Industries, a rapidly growing boat manufacturer, was $1.50
per share. The firm’s financial manager expects that these
dividends will increase at a 10% annual rate, g1, over the
next three years. At the end of three years (the end of
2009), the firm’s mature is expected to result in a slowing of
the dividend growth rate to 5% per year, g2, for the
foreseeable future. The firm’s required return, ks, is 15%.
Solution
8-23
D0 = $1.5 g1 = 10% g2 = 5%
k = 15% T = 3
First, calculate the total dividends over the “supernormal” growth period:
=17.96
Year Total Dividend: (in $millions)
1 $1.5 x 1.1 = $1.65
2 $1.65 x 1.1 = $1.815
3 $1.815 x 1.1 = $1.9965
V(3) = [D(3) x (1 + g2)] / (k – g2)
= 1.9965x(1.05)/.15-.05 =20.96325
       3
3
2
k
1
V(3)
k
1
D(3)
k
1
D(2)
k
1
D(1)
V(0)








       3
3
2
0.15
1
$13.9255
0.15
1
$1.9965
0.15
1
$1.815
0.15
1
$1.65
V(0)








4.4. Free Cash Flow (FCF) Model
• Free cash flows are the cash flows available for
distribution.
• Dividends are the cash flows actually paid to
stockholders
• Most financial analysts use the FCF model. FCF is the
cash that can be paid out to the firm’s investors, both
the debt and equity holders.
• The FCF model will give a value that is the total value
of the firm’s capital, i.e., the sum of both debt and
equity. Note the following items:
– Earnings before interest and taxes: EBIT = Revenues -
Costs
– Net operating profit after tax: NOPAT = EBIT(1 - Tax Rate)
– FCF = NOPAT - net new investment in operating capital. 8-24
Free Cash Flow (FCF) Model
       
......
wacc
1
FCF
..
...
wacc
1
FCF
wacc
1
FCF
wacc
1
FCF
V t
t
3
3
2
2
1
1
0 









8-25
 The above model looks very similar to the
dividend model we covered. However, the V0
estimated here is the total firm value or
enterprise value of the firm.
 To obtain the equity value, the debt value (and
preferred stock value) must then be subtracted
from the total value. To obtain value per share,
divide by the number of shares.
FREE CASH FLOW
Free Cash Flow to the
Firm
= Cash flow available to
Common stockholders
Debtholders
Preferred stockholders
Free Cash Flow to
Equity
= Cash flow available to
Common stockholders
• Free cash flow to equity (FCFE) is the cash
flow available to the firm’s common equity
holders after all operating expenses, interest
and principal payments have been paid, and
necessary investments in working and fixed
capital have been made.
Common equity can be valued by either
• directly using FCFE =
• indirectly by first computing the value of
the firm using a FCFF model and
subtracting the value of non-common
stock capital (usually debt and preferred
stock) to arrive at the value of equity.
28
What is free cash flow (FCF)?
Why is it important?
 FCF is the amount of cash available
from operations for distribution to all
investors (including stockholders and
debtholders) after making the
necessary investments to support
operations.
 A company’s value depends on the
amount of FCF it can generate.
29
What are the five uses of FCF?
1. Pay interest on debt.
2. Pay back principal on debt.
3. Pay dividends.
4. Buy back stock.
5. Buy nonoperating assets (e.g.,
marketable securities, investments in
other companies, etc.)
P/E Ratio or Earnings Multiplier
Approach
• Alternative approach often used by security
analysts
• P/E ratio is the strength with which investors
value earnings as expressed in stock price
– Divide the current market price of the stock by
the latest 12-month earnings
– Price paid for each $1 of earnings
Cont’d
• The price earnings ratio: The ratio of the
market price per share to the earnings per
share:
PE = Market Price per share / Earnings per
share
• E.g., If the current stock price is $50, and
earnings per share on the stock is $20, then
the P/E=50/20=2.5
8-31
Cont’d
• If the financial analysts believe the
appropriate P/E ratio (m) for a particular stock
should be, say 5, and the earning per share
(EPS) for this stock is $3.5, then the value of
this stock is
P=m*EPS=5*$3.5=$17.5
* 33
High vs. Low P/Es
• A high P/E ratio:
– indicates positive expectations for the future of the
company
– means the stock is more expensive relative to earnings
– typically represents a successful and fast-growing
company
• A low P/E ratio:
– indicates negative expectations for the future of the
company
End of Chapter Four!
34

chapter 5stock and stock valuation models.pdf

  • 1.
    CHAPTER – 5 STOCKAND EQUITY VALUATION
  • 2.
    Characteristics of CommonStock • Dividends – payment and size of dividends is determined by the board of directors of the issuing firm • Residual Claim – in the event of liquidation, common stockholders have the lowest priority in terms of any cash distribution • Limited Liability – common stockholders losses are limited to the amount of their original investment in the firm • Voting Rights 2
  • 3.
    Characteristics of CommonStock • Other Rights –Share proportionally in declared dividends –Share proportionally in remaining assets during liquidation –Preemptive right – first shot at new stock issue to maintain proportional ownership if desired 3
  • 4.
    Characteristics of PreferredStock  Similar to bonds, pays a fixed periodic dividend  Stated dividend that must be paid before dividends can be paid to common stockholders  dividend is fixed regardless of any increase or decrease in the firm’s value  Generally do not have voting rights  a hybrid security that has characteristics of both bonds and common stock  Cumulative preferred stock – missed dividend payments go into arrears and must be made up before common stock dividends can be paid 10-4
  • 5.
    Fundamental Stock Analysis: Modelsof Equity Valuation • Basic Types of Models Balance Sheet Valuation Dividend Discount Models Free cash flow model Earning multiplier approach
  • 6.
    Balance sheet valuation •Book value  Value of common equity on the balance sheet • Based on historical values of assets and liabilities, which may not reflect current values Limitations of Book Value • Book values are based on historical cost, not actual market values. • Since the book value does not reflect the current market value of assets, the book value per share is NOT suitable to represent a “floor” for the stock price
  • 7.
    18-10 • The intrinsicvalue (IV) is the “true” value, according to a model. • The market value (MV) is the consensus value of all market participants • Value according to market price of outstanding stock • Better measure than book value of the worth of the stock to the investor. Trading Signal: • IV > MP  MP is undervalued  Buy • IV < MP  MP is overvalued  Sell or Short Sell • IV = MV Hold or Fairly Priced Intrinsic Value and Market Price
  • 8.
    13-11 Balance sheet valuation(cont..) • Liquidation value – Net amount that can be realized by selling the assets of a firm at market prices and paying off the debt – Since the liquidation value reflects the current market value of assets, it can be viewed as a better floor for the stock price than the book value
  • 9.
    The Dividend DiscountModel • The Dividend Discount Model (DDM) is a method to estimate the value of a share of stock by discounting all expected future dividend payments. The DDM equation is: The Basic Stock Valuation Equation In the DDM equation: • V0 = Value of Stock • Dt = Dividend in time t • k = required return on common stock © 2009 McGraw-Hill Ryerson Limited 7-12        T 3 2 k 1 D(T) k 1 D(3) k 1 D(2) k 1 D(1) V(0)         
  • 10.
    Example: The DividendDiscount Model • Suppose that a stock will pay three annual dividends of $200 per year, and the appropriate risk-adjusted discount rate, k, is 8%. In this case, what is the value of the stock today? 6-13             $515.42 0.08 1 $200 0.08 1 $200 0.08 1 $200 P k 1 D k 1 D k 1 D P 3 2 0 3 3 2 2 1 0             
  • 11.
    The Dividend DiscountModel: The Zero Growth Model • The zero dividend growth model assumes that the stock will pay the same dividend each year, year after year. • the future dividends remain constant such that D1 = D2 = D3 = D4 = . . . = DN Copyright © 2009 Pearson Prentice Hall. All rights reserved. 7-14
  • 12.
    THE ZERO GROWTHMODEL (cont.) • Example 1 – If Zinc Co. is expected to pay cash dividends of $8 per share and the firm has a 10% required rate of return, what is the intrinsic value of the stock? 13 15 10 . 8  V 80 $ 
  • 13.
    The Dividend DiscountModel: Constant Growth Model • The constant dividend growth model assumes that the stock will pay dividends that grow at a constant rate each year—year after year forever. • Commonly called the Gordon growth model g= constant perpetual growth rate D1 = Dividend k = required return ASSUMPTIONS: • growth rate in dividends is constant • earnings per share is constant 7-16   g k D g k g D V      1 0 0 1
  • 14.
    13-17 Constant Growth ModelExample 1 • Use: Stocks that have earnings and dividends that are expected to grow at a constant rate forever • The constant-growth DDM is only valid if g is less than k. • A common stock share just paid a $2.00 per share dividend and the stock has a required return of 10%. Dividends are expected to grow at 6% per year forever. What is the most you should be willing to pay for the stock? 00 . 53 $ 0.06 - 0.10 1.06 $2.00 V0   
  • 15.
    Constant Growth ModelExample 2 Suppose D(0) = $2; k = 12%; g = 6%. D(1) = ($2.00 x 1.06) = $2.12 V(0) = $2.12 / (.12 - .06) = $35.33 * 18
  • 16.
    Constant Growth • Advantage –easy to compute • Disadvantages – not usable for firms paying no dividends – not usable when g > k – The constant-growth DDM is only valid if g is less than k. – k and g may be very difficult to estimate – constant perpetual growth is often unrealistic * 19
  • 17.
    Stock Valuation Models: Variable-growthModel Or Supernormal Growth • The non-constant dividend growth or variable- growth model assumes that the stock will pay dividends that grow at one rate during one period, and at another rate in another year or thereafter. Copyright © 2009 Pearson Prentice Hall. All rights reserved. 7-20 T 2 2 T T 1 t t t 1 0 0 k) )(1 g (k ) g (1 D k) (1 ) g (1 D V                g1 = first growth rate g2 = second growth rate T = number of periods of growth at g1
  • 18.
    Example • D0 =$2.00 g1 = 20% g2 = 5% • k = 15% T = 3 • D1 = 2.40 D2 = 2.88 D3 = 3.46 D4 = 3.63 • V0 = 2.09 + 2.18 + 2.27 + 23.86 = $30.40 3 3 2 0 ) 15 . 1 )( 05 . 0 15 . 0 ( 63 . 3 $ 15 . 1 46 . 3 $ 15 . 1 88 . 2 $ 15 . 1 40 . 2 $ V     
  • 19.
    Stock Valuation Models: Variable-GrowthModel (cont.) example 4 7-22 The most recent annual (2006) dividend payment of Warren Industries, a rapidly growing boat manufacturer, was $1.50 per share. The firm’s financial manager expects that these dividends will increase at a 10% annual rate, g1, over the next three years. At the end of three years (the end of 2009), the firm’s mature is expected to result in a slowing of the dividend growth rate to 5% per year, g2, for the foreseeable future. The firm’s required return, ks, is 15%.
  • 20.
    Solution 8-23 D0 = $1.5g1 = 10% g2 = 5% k = 15% T = 3 First, calculate the total dividends over the “supernormal” growth period: =17.96 Year Total Dividend: (in $millions) 1 $1.5 x 1.1 = $1.65 2 $1.65 x 1.1 = $1.815 3 $1.815 x 1.1 = $1.9965 V(3) = [D(3) x (1 + g2)] / (k – g2) = 1.9965x(1.05)/.15-.05 =20.96325        3 3 2 k 1 V(3) k 1 D(3) k 1 D(2) k 1 D(1) V(0)                3 3 2 0.15 1 $13.9255 0.15 1 $1.9965 0.15 1 $1.815 0.15 1 $1.65 V(0)        
  • 21.
    4.4. Free CashFlow (FCF) Model • Free cash flows are the cash flows available for distribution. • Dividends are the cash flows actually paid to stockholders • Most financial analysts use the FCF model. FCF is the cash that can be paid out to the firm’s investors, both the debt and equity holders. • The FCF model will give a value that is the total value of the firm’s capital, i.e., the sum of both debt and equity. Note the following items: – Earnings before interest and taxes: EBIT = Revenues - Costs – Net operating profit after tax: NOPAT = EBIT(1 - Tax Rate) – FCF = NOPAT - net new investment in operating capital. 8-24
  • 22.
    Free Cash Flow(FCF) Model         ...... wacc 1 FCF .. ... wacc 1 FCF wacc 1 FCF wacc 1 FCF V t t 3 3 2 2 1 1 0           8-25  The above model looks very similar to the dividend model we covered. However, the V0 estimated here is the total firm value or enterprise value of the firm.  To obtain the equity value, the debt value (and preferred stock value) must then be subtracted from the total value. To obtain value per share, divide by the number of shares.
  • 23.
    FREE CASH FLOW FreeCash Flow to the Firm = Cash flow available to Common stockholders Debtholders Preferred stockholders Free Cash Flow to Equity = Cash flow available to Common stockholders
  • 24.
    • Free cashflow to equity (FCFE) is the cash flow available to the firm’s common equity holders after all operating expenses, interest and principal payments have been paid, and necessary investments in working and fixed capital have been made. Common equity can be valued by either • directly using FCFE = • indirectly by first computing the value of the firm using a FCFF model and subtracting the value of non-common stock capital (usually debt and preferred stock) to arrive at the value of equity.
  • 25.
    28 What is freecash flow (FCF)? Why is it important?  FCF is the amount of cash available from operations for distribution to all investors (including stockholders and debtholders) after making the necessary investments to support operations.  A company’s value depends on the amount of FCF it can generate.
  • 26.
    29 What are thefive uses of FCF? 1. Pay interest on debt. 2. Pay back principal on debt. 3. Pay dividends. 4. Buy back stock. 5. Buy nonoperating assets (e.g., marketable securities, investments in other companies, etc.)
  • 27.
    P/E Ratio orEarnings Multiplier Approach • Alternative approach often used by security analysts • P/E ratio is the strength with which investors value earnings as expressed in stock price – Divide the current market price of the stock by the latest 12-month earnings – Price paid for each $1 of earnings
  • 28.
    Cont’d • The priceearnings ratio: The ratio of the market price per share to the earnings per share: PE = Market Price per share / Earnings per share • E.g., If the current stock price is $50, and earnings per share on the stock is $20, then the P/E=50/20=2.5 8-31
  • 29.
    Cont’d • If thefinancial analysts believe the appropriate P/E ratio (m) for a particular stock should be, say 5, and the earning per share (EPS) for this stock is $3.5, then the value of this stock is P=m*EPS=5*$3.5=$17.5
  • 30.
    * 33 High vs.Low P/Es • A high P/E ratio: – indicates positive expectations for the future of the company – means the stock is more expensive relative to earnings – typically represents a successful and fast-growing company • A low P/E ratio: – indicates negative expectations for the future of the company
  • 31.