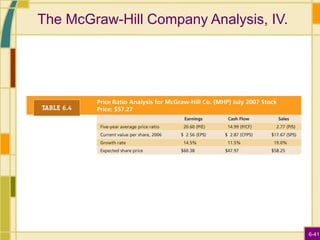
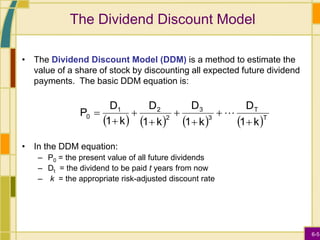
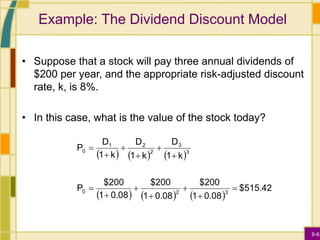
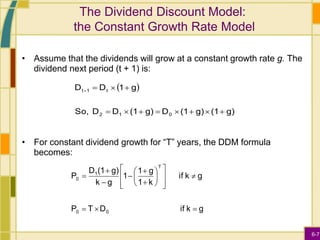
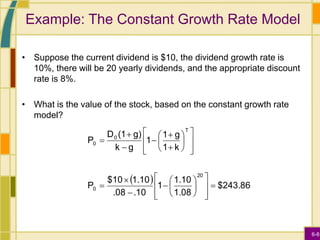
The document discusses various methods for valuing common stock, including dividend discount models, residual income models, and price ratio models. It provides examples and formulas for the basic dividend discount model, two-stage dividend growth model, and constant growth dividend discount model. It also discusses approaches for estimating growth rates, such as using historical averages, industry averages, and sustainable growth rates. The examples show how to apply the models to value stocks and estimate what a fair price would be based on expected future dividends and appropriate discount rates.
![6-20
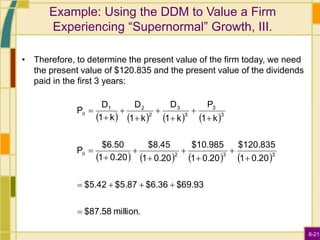
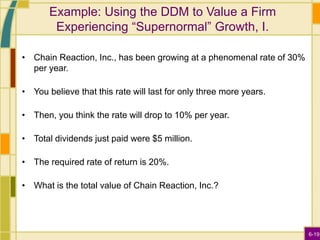
Example: Using the DDM to Value a Firm
Experiencing “Supernormal” Growth, II.
• First, calculate the total dividends over the “supernormal” growth
period:
• Using the long run growth rate, g, the value of all the shares at Time
3 can be calculated as:
P3 = [D3 x (1 + g)] / (k – g)
P3 = [$10.985 x 1.10] / (0.20 – 0.10) = $120.835
Year Total Dividend: (in $millions)
1 $5.00 x 1.30 = $6.50
2 $6.50 x 1.30 = $8.45
3 $8.45 x 1.30 = $10.985](https://image.slidesharecdn.com/commonstock-221208042948-3aabaeeb/85/Common-stock-ppt-20-320.jpg)