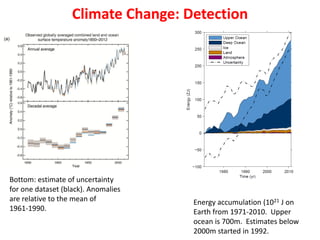
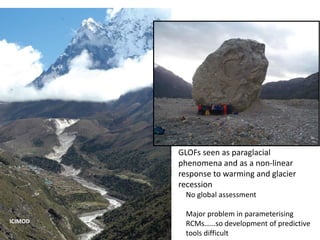
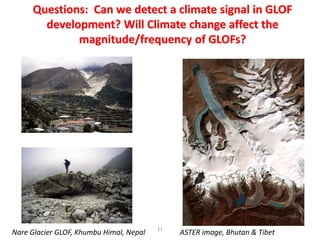
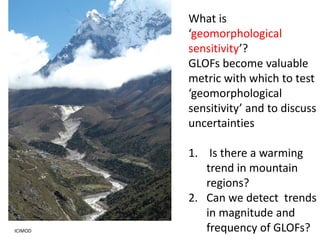
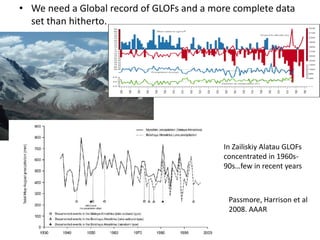
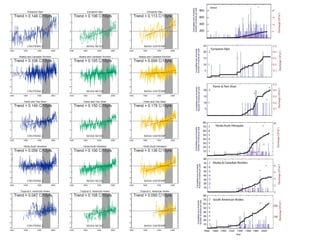
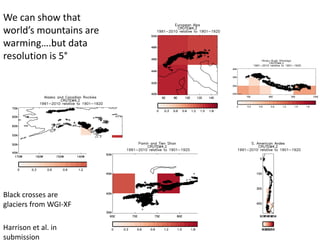
Linking the Quasi-Biennial Oscillation and Projected Arctic Sea-Ice Loss to S...Zachary Labe
20th Conference on Middle Atmosphere at the 99th Annual Meeting of the American Meteorological Society (abstract: https://ams.confex.com/ams/2019Annual/meetingapp.cgi/Paper/352664)
Climate change scenarios in context of the less than 2C global temperature ta...NAP Events
Presented by: Wilfran Moufouma-Okia
3.1 Technical guidance on NAPs
The session will take the participants through the technical guidance for NAPs, including: NAP guidelines, guiding principles for adaptation under the Convention, and subsequent products developed by the LEG such as the sample NAP process. It will further look detailed aspects on undertaking assessments by going through best available methods and tools for assessing for assessing crop production as an example. Countries will further provide practical experiences in applying the guidance in the formulation of their NAPs.
Modeling the Climate System: Is model-based science like model-based engineer...Steve Easterbrook
Keynote Talk given at the ACM/IEEE 18th International Conference on Model Driven Engineering Languages and Systems (Models 2015), Ottawa, September 2015.
Slides from a presentation about modeling past and future climate as part of the "School of Ice" workshop for educators at Oregon State University on Aug. 2, 2021.
To aid in understanding many complex interactions, scientists often build mathematical models that represent simple climate systems. This module highlights the fundamentals of climate models.
Communicating Arctic climate change through data-driven storiesZachary Labe
Arctic Science Summit Week 2021 (Session 2: “The 4 Essential Cs - Coordination, Communication, Community, and Collaboration”):
In this presentation, I will discuss the power of sharing Arctic climate change information through accessible and engaging data visualizations. In particular, I will focus on using social media (Twitter) as one tool for communicating science to broad audiences.
Climate science part 3 - climate models and predicted climate changeLPE Learning Center
Many lines of evidence, from ice cores to marine deposits, indicate that Earth’s temperature, sea level, and distribution of plant and animal species have varied substantially throughout history. Ice cores from Antarctica suggest that over the past 400,000 years global temperature has varied as much as 10 degrees Celsius through ice ages and periods warmer than today. Before human influence, natural factors (such as the pattern of earth’s orbit and changes in ocean currents) are believed to be responsible for climate changes. For more, visit: http://www.extension.org/69150
The Pan-Arctic Impacts of Thinning Sea IceZachary Labe
The Arctic is rapidly changing. However, long-term observations of trends in Arctic sea-ice thickness are still quite limited. In this presentation, Zachary will discuss the different methods (satellite instruments and climate model simulations) of observing sea-ice thickness in order to understand changes in the recent Arctic amplification era. He will also highlight the far-reaching environmental and societal impacts from a thinning Arctic sea-ice cover.
The 14th Summer Environmental Health Sciences Institute took place in Houston, TX the week of 7/14/2014. This workshop on climate change, comes from educational designers from the National Center for Atmospheric Research. While you may not have been able to join us, you can still review content and download all the activities at our website: https://scied.ucar.edu/events/clone-climate-change-connections-2014
Summary of key findings of "Climate Change 2013: The Physical Science Basis, Working Group I contribution to the IPCC 5th Assessment Report" by Matt Collins, University of Exeter, UK
SICCME open session, 17 September 2014, ICES Annual Science Conference, A Coruña, Spain
We present a survey of computational and applied mathematical techniques that have the potential to contribute to the next generation of high-fidelity, multi-scale climate simulations. Examples of the climate science problems that can be investigated with more depth with these computational improvements include the capture of remote forcings of localized hydrological extreme events, an accurate representation of cloud features over a range of spatial and temporal scales, and parallel, large ensembles of simulations to more effectively explore model sensitivities and uncertainties.
Numerical techniques, such as adaptive mesh refinement, implicit time integration, and separate treatment of fast physical time scales are enabling improved accuracy and fidelity in simulation of dynamics and allowing more complete representations of climate features at the global scale. At the same time, partnerships with computer science teams have focused on taking advantage of evolving computer architectures such as many-core processors and GPUs. As a result, approaches which were previously considered prohibitively costly have become both more efficient and scalable. In combination, progress in these three critical areas is poised to transform climate modeling in the coming decades.
Incorporating Climate Tipping Points Into Policy AnalysisOECD Environment
Presentation given during the OECD Expert workshop on Economic Modelling of Climate and Related Tipping Points by Elizabeth Kopits, US Environmental Protection Agency
First lecture:
Climate Change and the New industrial revolution -
What we risk and how we should cast the economics and ethics
Speaker(s): Professor Lord Stern
Chair: Professor Lord Richard Layard
Recorded on 21 February 2012 in Old Theatre, Old Building
Dr Andrew Rawson: Soil Carbon Sequestration in a Changing ClimateCarbon Coalition
Dr Andrew Rawson of the NSW Department of the Environment and Climate Change, explains why climate change is blamed for more than it can be held to have caused. This presentation was given at the Carbon farming Expo & Conference in Orange NSW Australia in November 2008.
The real reason for climate change and what is driving the changes. No model is any batter then the predictive results, the validation is therefore very easy to determine.
This is the 7th lesson the course - Climate Change & Global Environment taught at the Faculty of Social Sciences and Humanities of the Rajarata University of Sri Lanka
Presentation by Chris Swanston to support the Adaptive Silviculture for Climate Change (ASCC) J.W. Jones Ecological Research Center Workshop held January 12-14, 2016
1. Global pattern of moraine-dammed
Gacial Lake Outburst Floods
Stephan Harrison
John Reynolds (Aberystwyth)
Christian Hugel (Zurich)
Jeff Kargel (Arizona)
Andy Wiltshire (UKMO)
Richard Betts (UKMO)
Liam Reinhardt (Exeter)
hulme Trust Helix
2. Rationale and structure
• AR5 stress on adaptation to climate change
• New focus on Detection and Attribution as important for
extreme events (includes litigation as well as development)
• Important debates on Equilibrium Climate Sensitivity,
Transient Climate Response and policy implications
• Geomorphological sensitivity and D&A for GLOFs
• Stress global scale approach needed
3. Climate Change: Detection
Bottom: estimate of uncertainty
for one dataset (black). Anomalies
are relative to the mean of
1961-1990.
Energy accumulation (1021 J on
Earth from 1971-2010. Upper
ocean is 700m. Estimates below
2000m started in 1992.
4. The Radiative Forcing of
WMGHG in AR5 is 2.83 ±
0.28 Wm–2
Milankovitch cycles
around 1.5 Wm–2
The range of
climate sensitivities in
climate models used for
IPCC AR4 is a warming of
0.6–1.2K per Wm–2 of
forcing.
Attribution: Global average radiative forcing
estimates and ranges
5. We can show a response to this:
• Glacier recession
• Paraglaciation
• GLOFs
– Important as responsible for thousands of deaths per
year
– Huge infrastructure costs
– Implications for economic and social development in
remote mountain regions
7. West Rongbuk Glacier in
1921 and 2008.
(RGS & David Breashears)
Imja Glacier, central
Himalaya in 1955 and
2009
(Fritz Müller and Alton Byers).
8. Does paraglaciation become the
dominant mechanism of
sediment movement in
glaciated mountain systems?
Implications for changes in the
magnitude/frequency of natural hazards?
10. GLOFs seen as paraglacial
phenomena and as a non-linear
response to warming and glacier
recession
No global assessment
Major problem in parameterising
RCMs……so development of predictive
tools difficult
ICIMOD
11. 11
Nare Glacier GLOF, Khumbu Himal, Nepal ASTER image, Bhutan & Tibet
Questions: Can we detect a climate signal in GLOF
development? Will Climate change affect the
magnitude/frequency of GLOFs?
12. Three issues have to be addressed
• Climate sensitivity
• Geomorphological sensitivity
• Attribution and glacial systems
13. How much will the temperature warm? i.e.
what is climate sensitivity?
AR5 definitions:
Equilibrium climate sensitivity (ECS): “defined as the equilibrium
change in global surface temperature following a doubling of the
atmospheric equivalent CO2 concentration”*
Transient climate response (TCR): “the change in global surface
temperature in a global coupled climate model in a 1%yr-1 CO2
increase experiment at the time of CO2 doubling”*
*Note: Units are in degrees Celsius (°C).
14. PDFs, distribution and ranges
for ECS (IPCC AR5)
• no central figure given
• lower limit may be reduced
(problem of using recent data sets to
constrain this?)
• long tail…..although figures greater
than 6°C unlikely (and palaeo record
doesn’t suggest this)
• TCR lower than this….but may be
more relevant for adaptation policy
15. What is
‘geomorphological
sensitivity’?
GLOFs become valuable
metric with which to test
‘geomorphological
sensitivity’ and to discuss
uncertainties
1. Is there a warming
trend in mountain
regions?
2. Can we detect trends
in magnitude and
frequency of GLOFs?ICIMOD
16. However, Attribution problem....How can we
Attribute Extreme Events to Human Forcing
• Difficult problem to solve because:
– Relates to a set of small scale events
– These may be stochastic and/or display chaos
– Understanding them depends on assessing nature of
initial conditions as well as forcing (i.e. the precise
conditions of the system before the event began as
well as whatever might be acting on the system)
– To model events we need probabilistic framework...lots
of model runs (ensembles)….and with a suitable
model!
17. Event based attribution
Approach:
Find out how many times
a specific event of interest
occurs in a model with
predindustrial GHG forcing
(‘natural world’).
Find out how many times
a specific event of interest
occurs in a model with
current levels of GHG
forcing (‘actual world’).
Assess the difference
(Fraction of Attributable
Risk).
Requires:
a model capable of simulating
the event(s) of interest
many runs of the model
FAR = 1 – P0 / P1
18. Problem of running meaningful model
ensembles which can help develop attribution
for GLOFs
Very difficult in mountains:
• Large changes in albedo, water vapour fluxes, ice temperature,
supraglacial debris fluxes, landcover etc over small spatial scales
• Topography difficult to model and model resolution still much too
coarse
• How to model paraglacial triggers?
• How to model initial conditions?
19. Tasman Glacier, New
Zealand
Charles Warren
Attribution and debris
covered glaciers
Debris obscures the
glacier-climate
signal...and difficult to
model and parameterise
Baltoro Glacier
21. • We need a Global record of GLOFs and a more complete data
set than hitherto.
In Zailiskiy Alatau GLOFs
concentrated in 1960s-
90s…few in recent years
Passmore, Harrison et al
2008. AAAR
22. Developing a record for D&A was the
motivation for the GLOF inventory
• 567 glacier hazard events had to be cross-checked
• Problem is that many events named after the
glacial lake in some datasets; in others the same
event named after the glacier or mountain region
• Eventually these whittled down to 191 GLOFs
associated with moraine dam failure…best candidates
for Atrribution
23.
24. We can show that
world’s mountains are
warming….but data
resolution is 5°
Black crosses are
glaciers from WGI-XF
Harrison et al. in
submission
25. • For Attribution….we need integration between
glacier and climate models (RCMs) at scales
where debris supply, lake initiation, trigger
mechanisms can be modelled.
• And we need an uncensored data base of GLOF
magnitude and frequency in the past.
• Pattern so far shows rising temperatures in the
world’s mountains but the number of GLOFs has
fallen and there is no trend in magnitude.
26. Conclusions
• Attributing GLOFs to AGW too early because attribution
studies have not been done (and are problematic).
• Modelling at scale required and in mountain regions also
difficult. Parameterisation of crucial processes needed.
• No global GLOF inventory and data sets are incomplete
(so Detection difficult)
• However, an important task….for adaptation policy,
litigation issues (Climate Justice Programme) and
assessing impact of climate on extreme geomorphological
events.