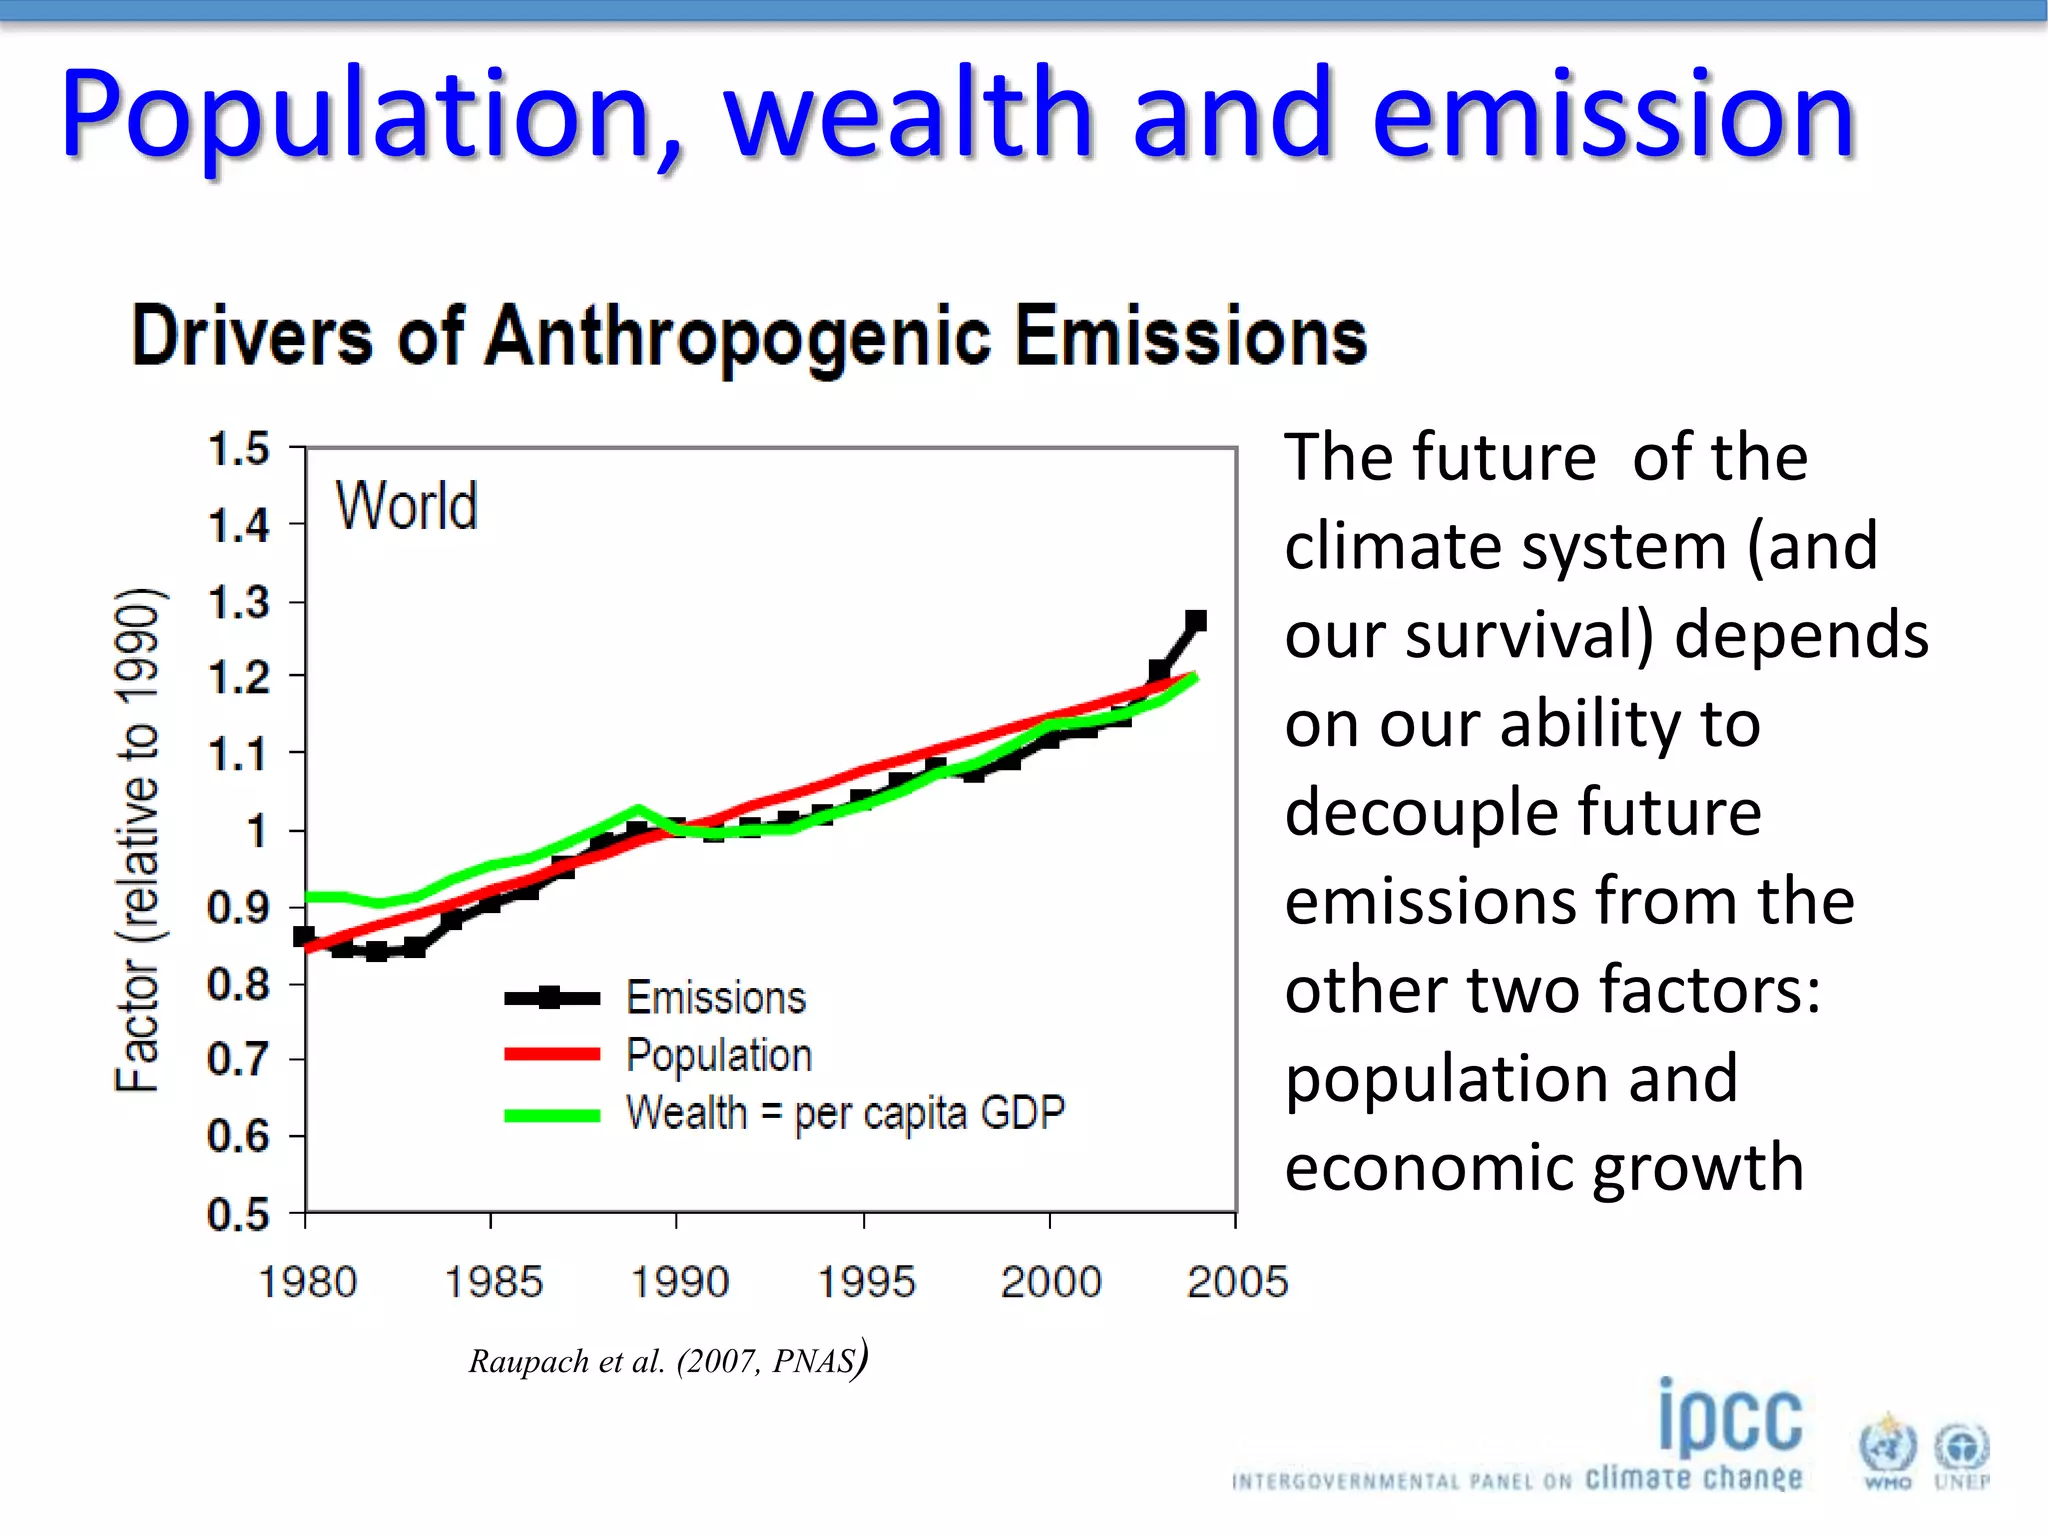
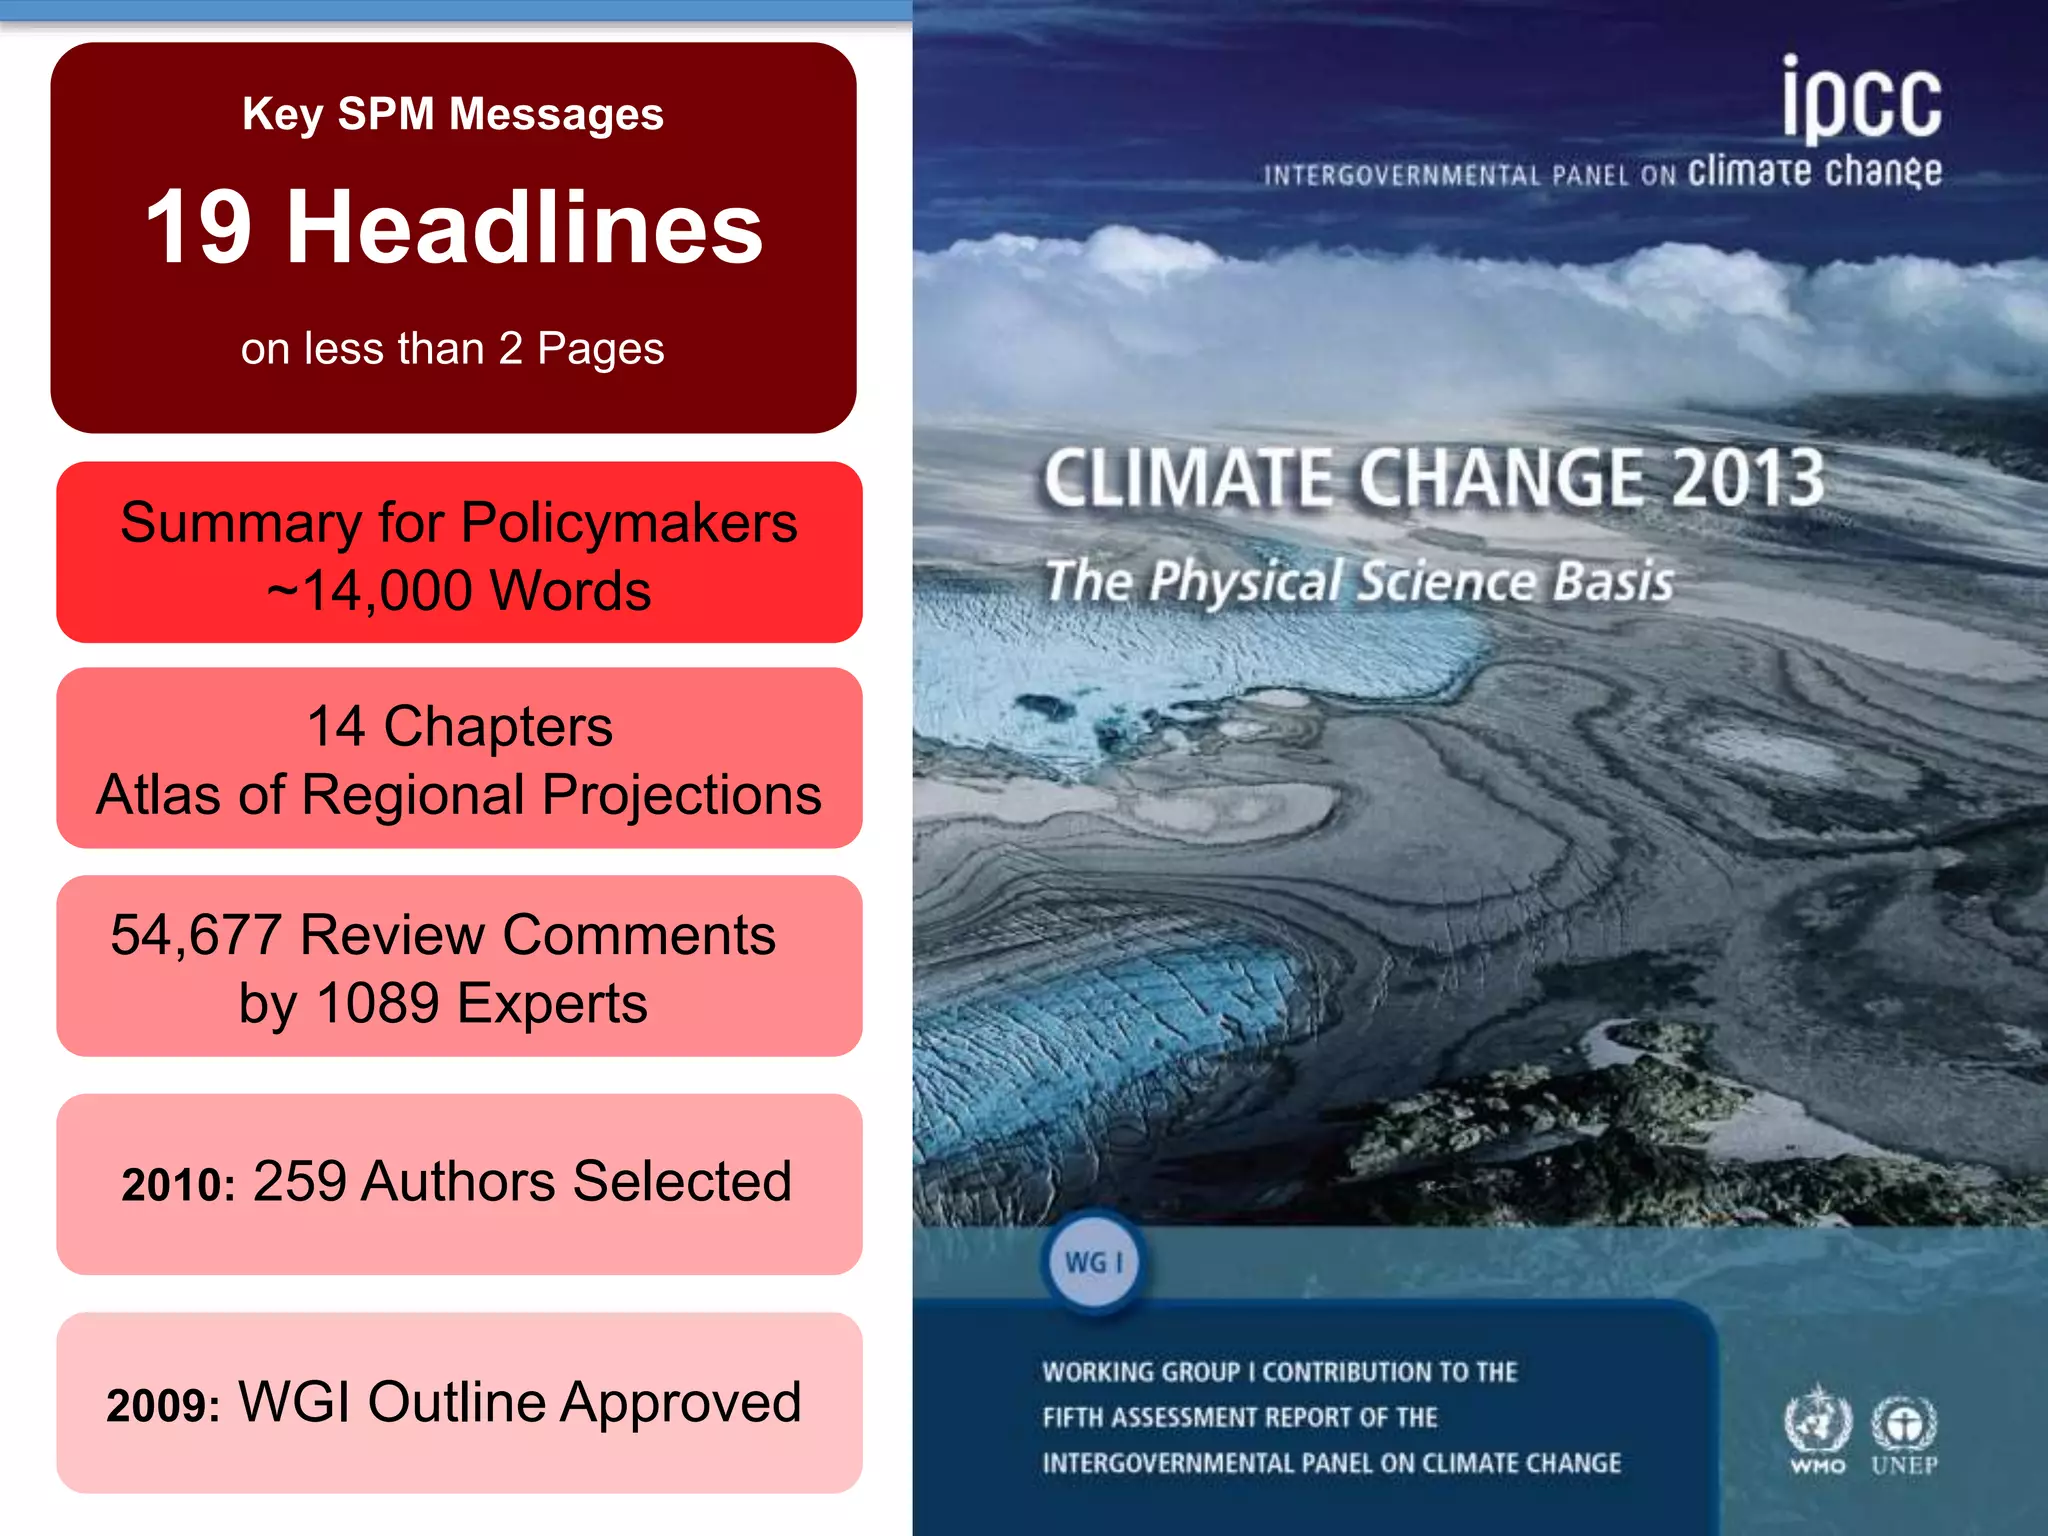
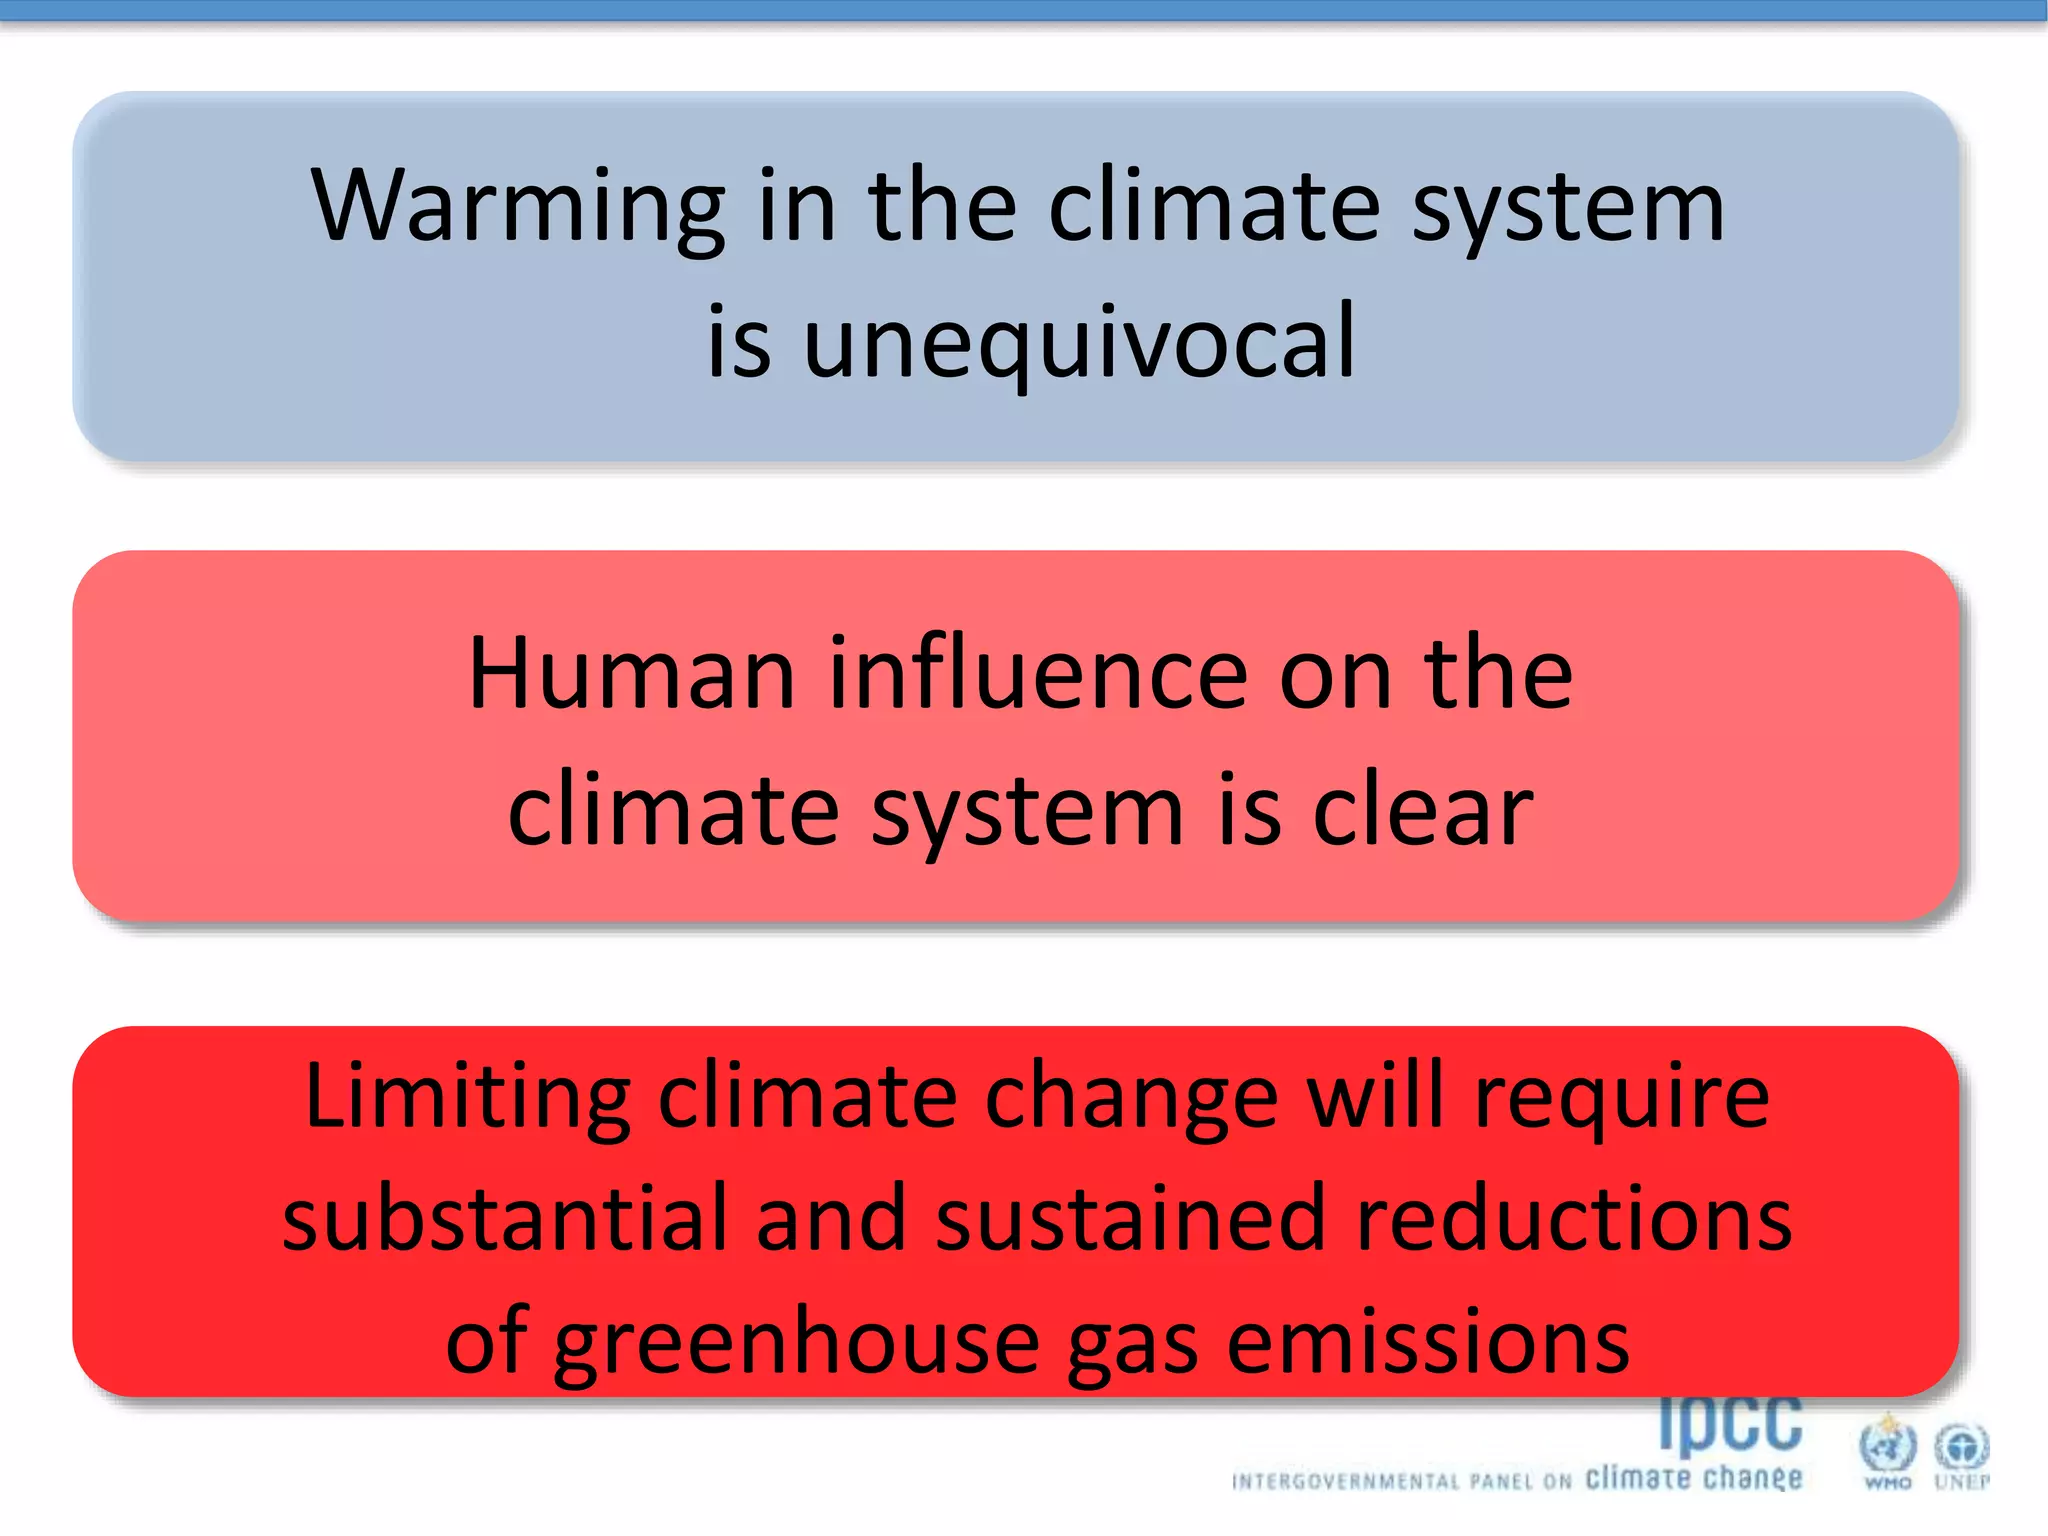
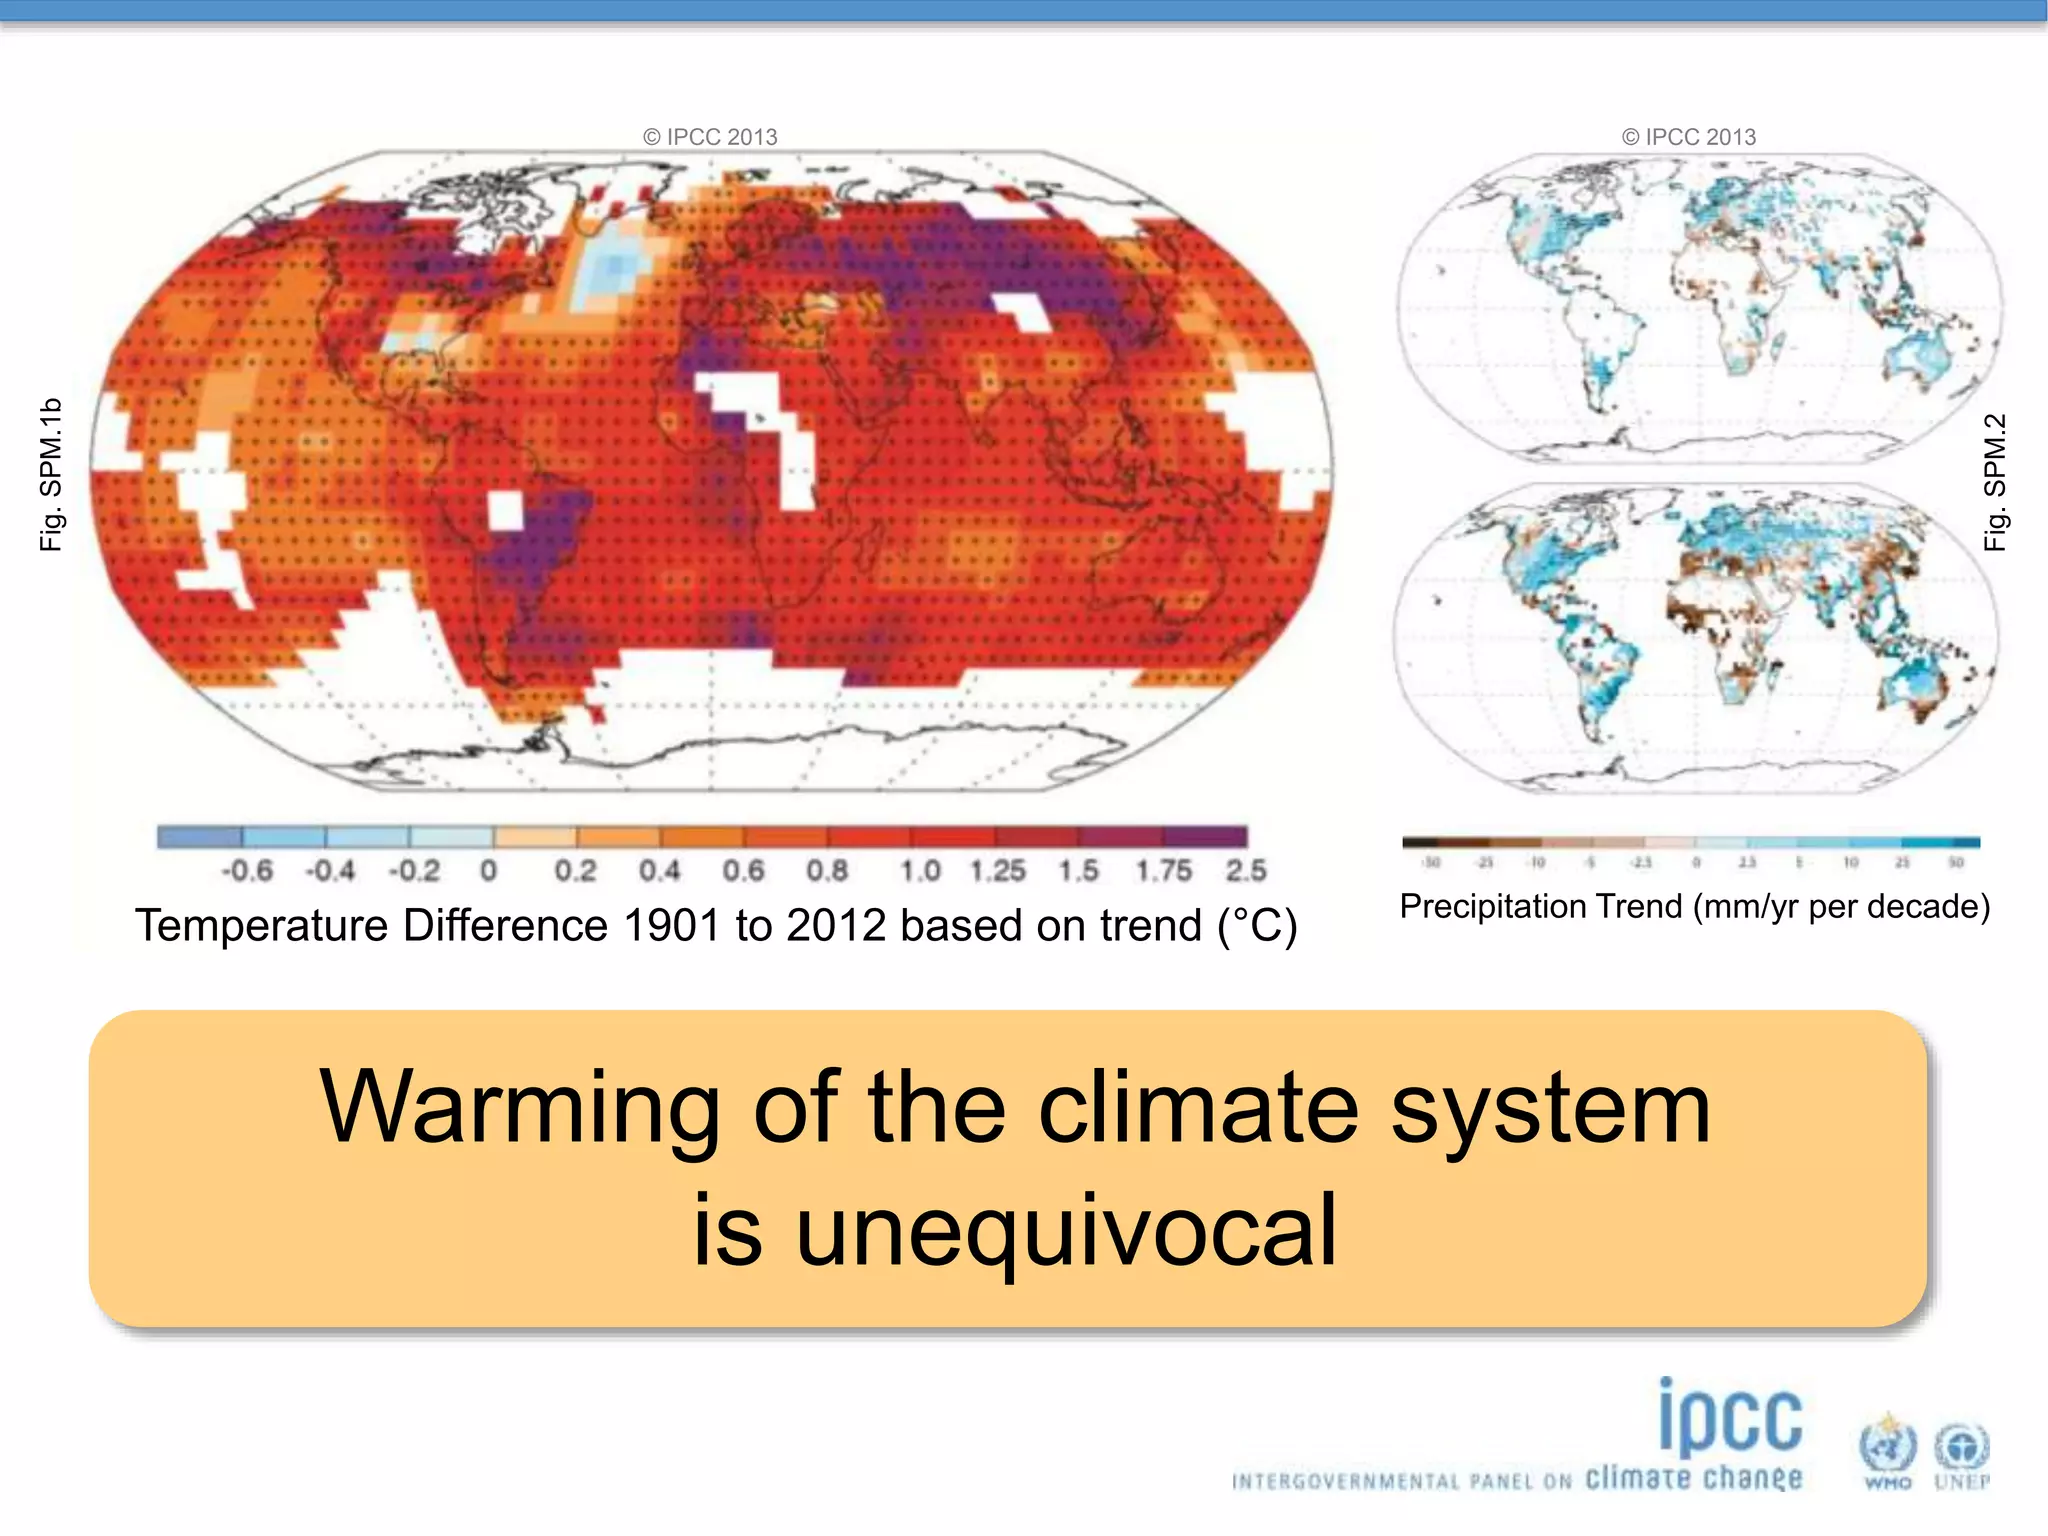
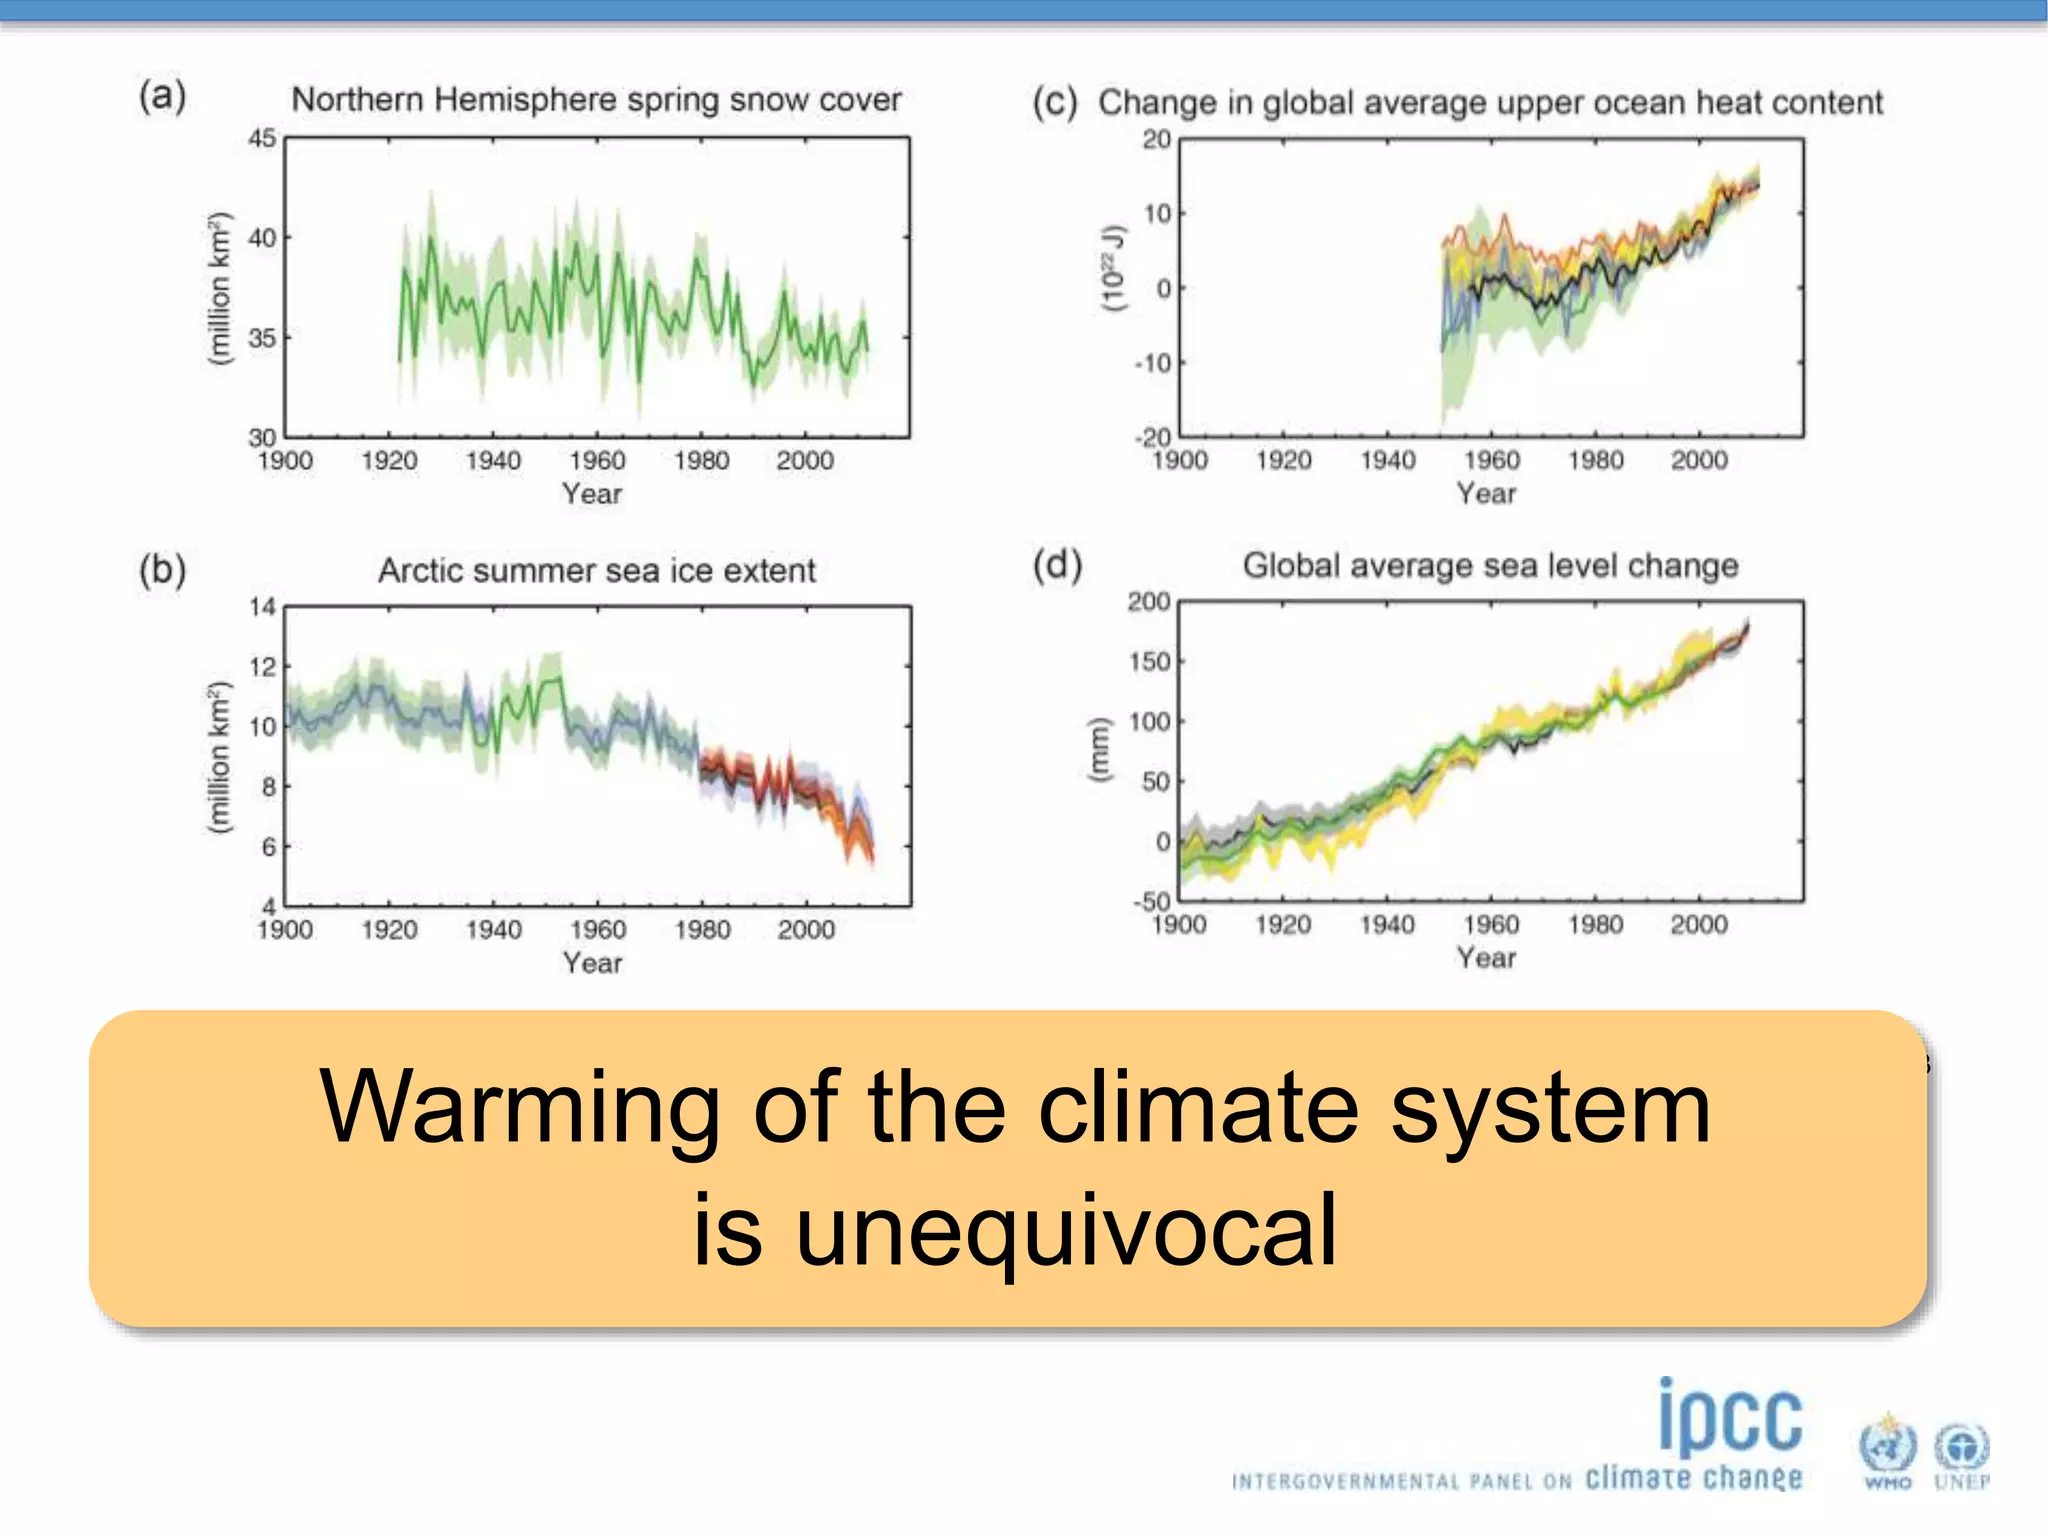
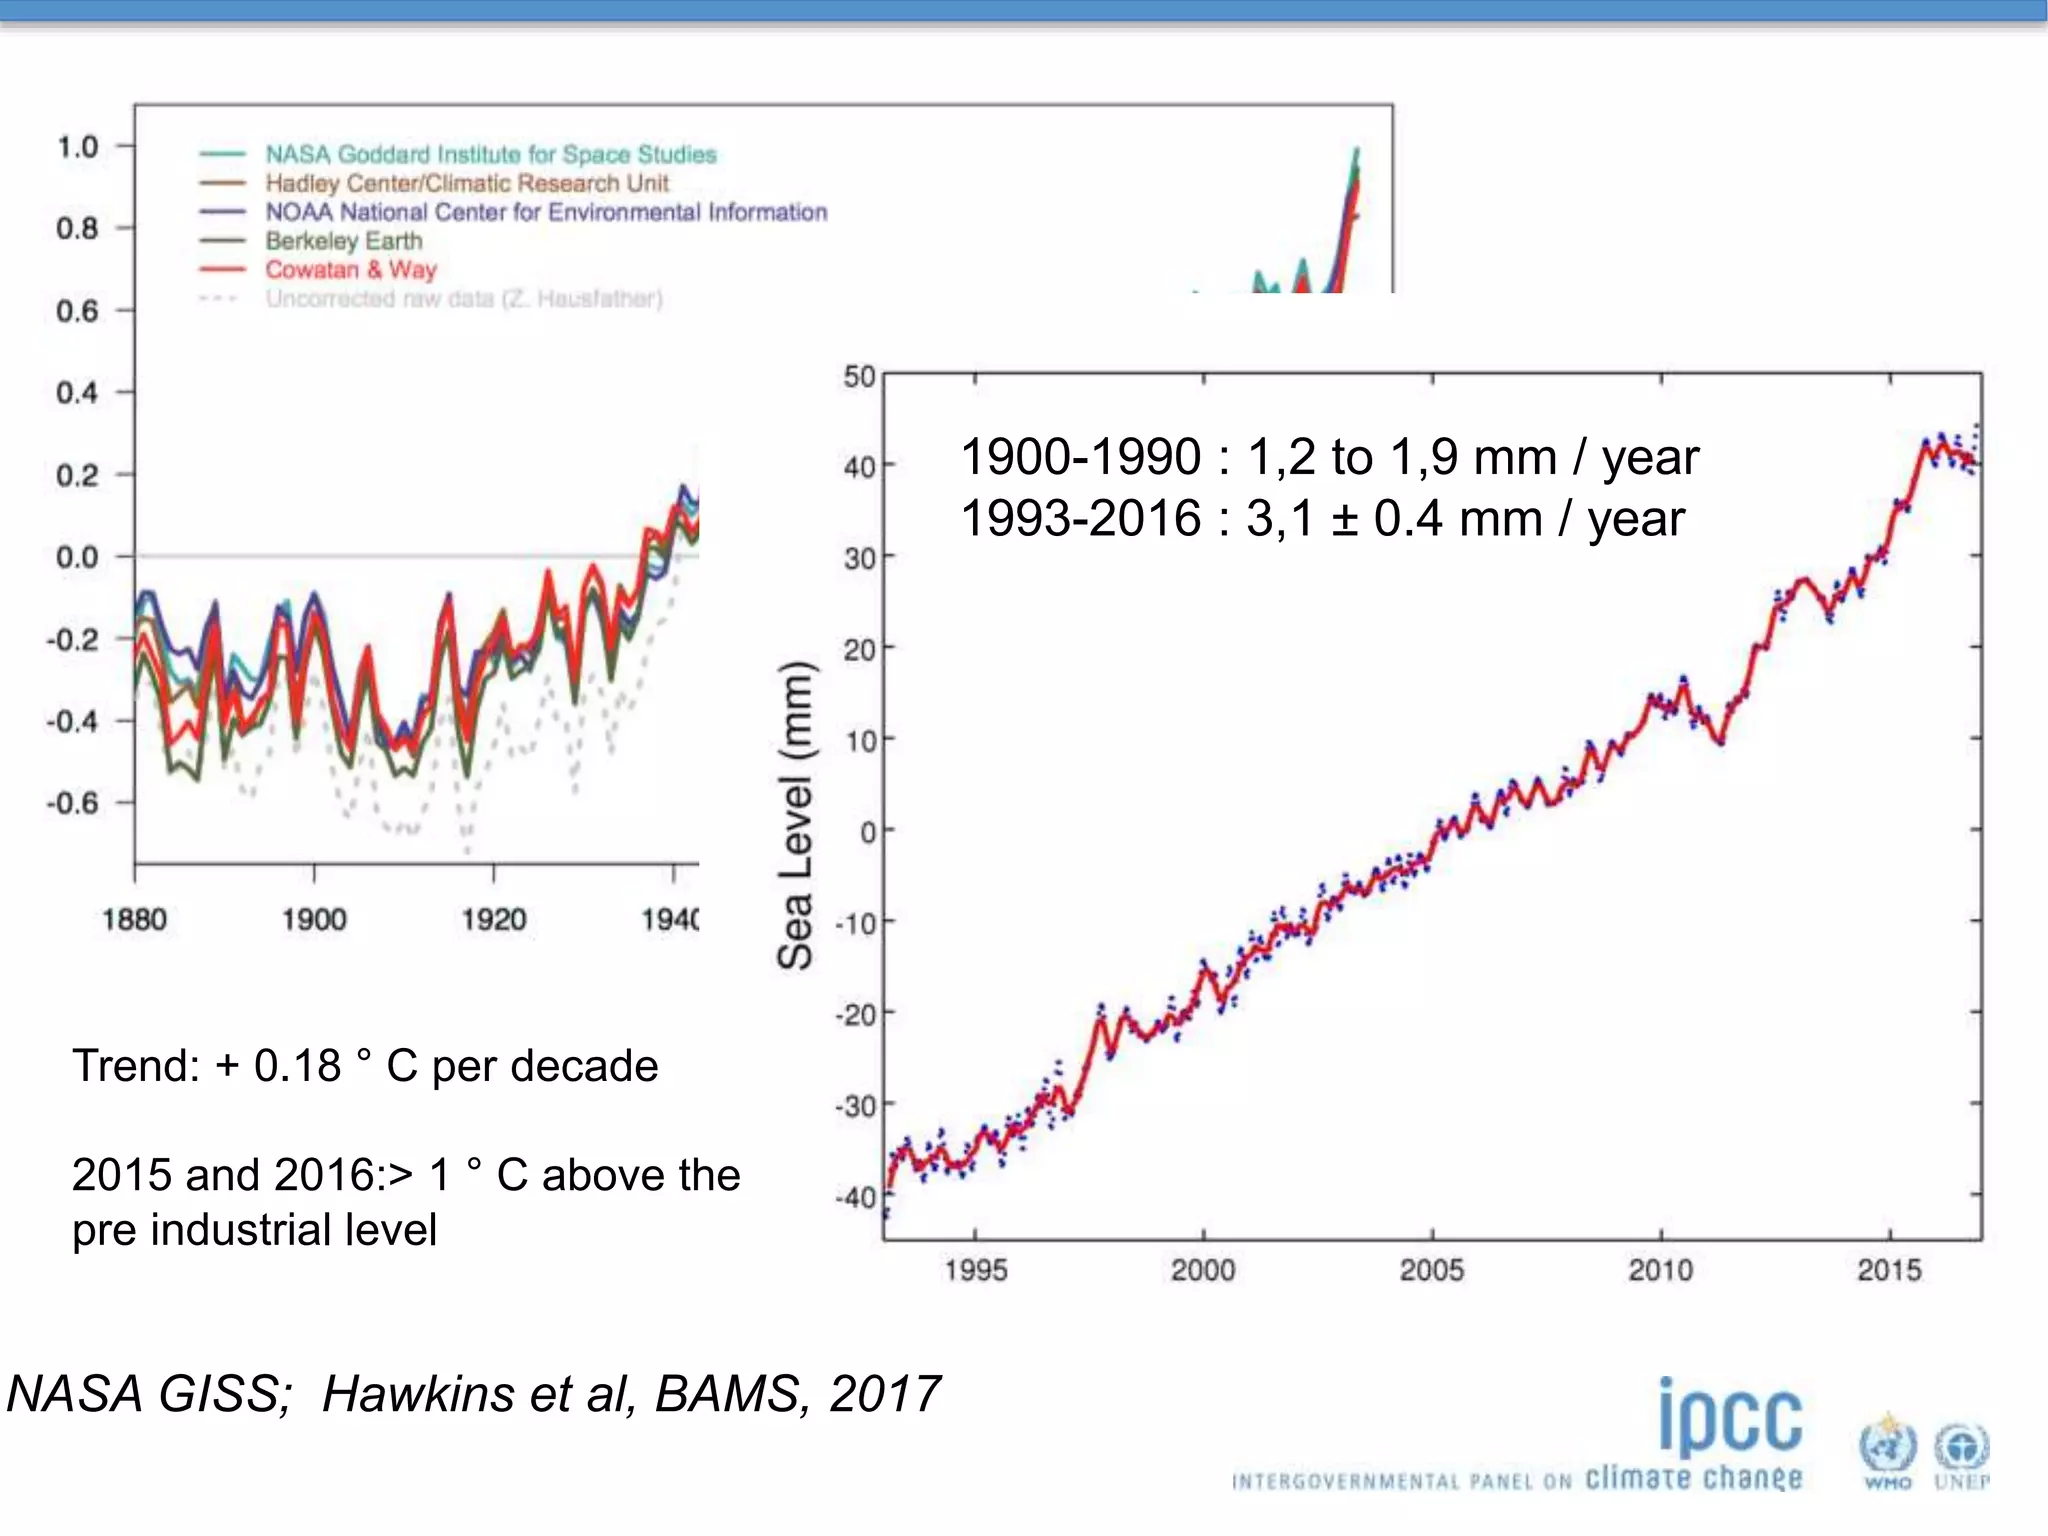
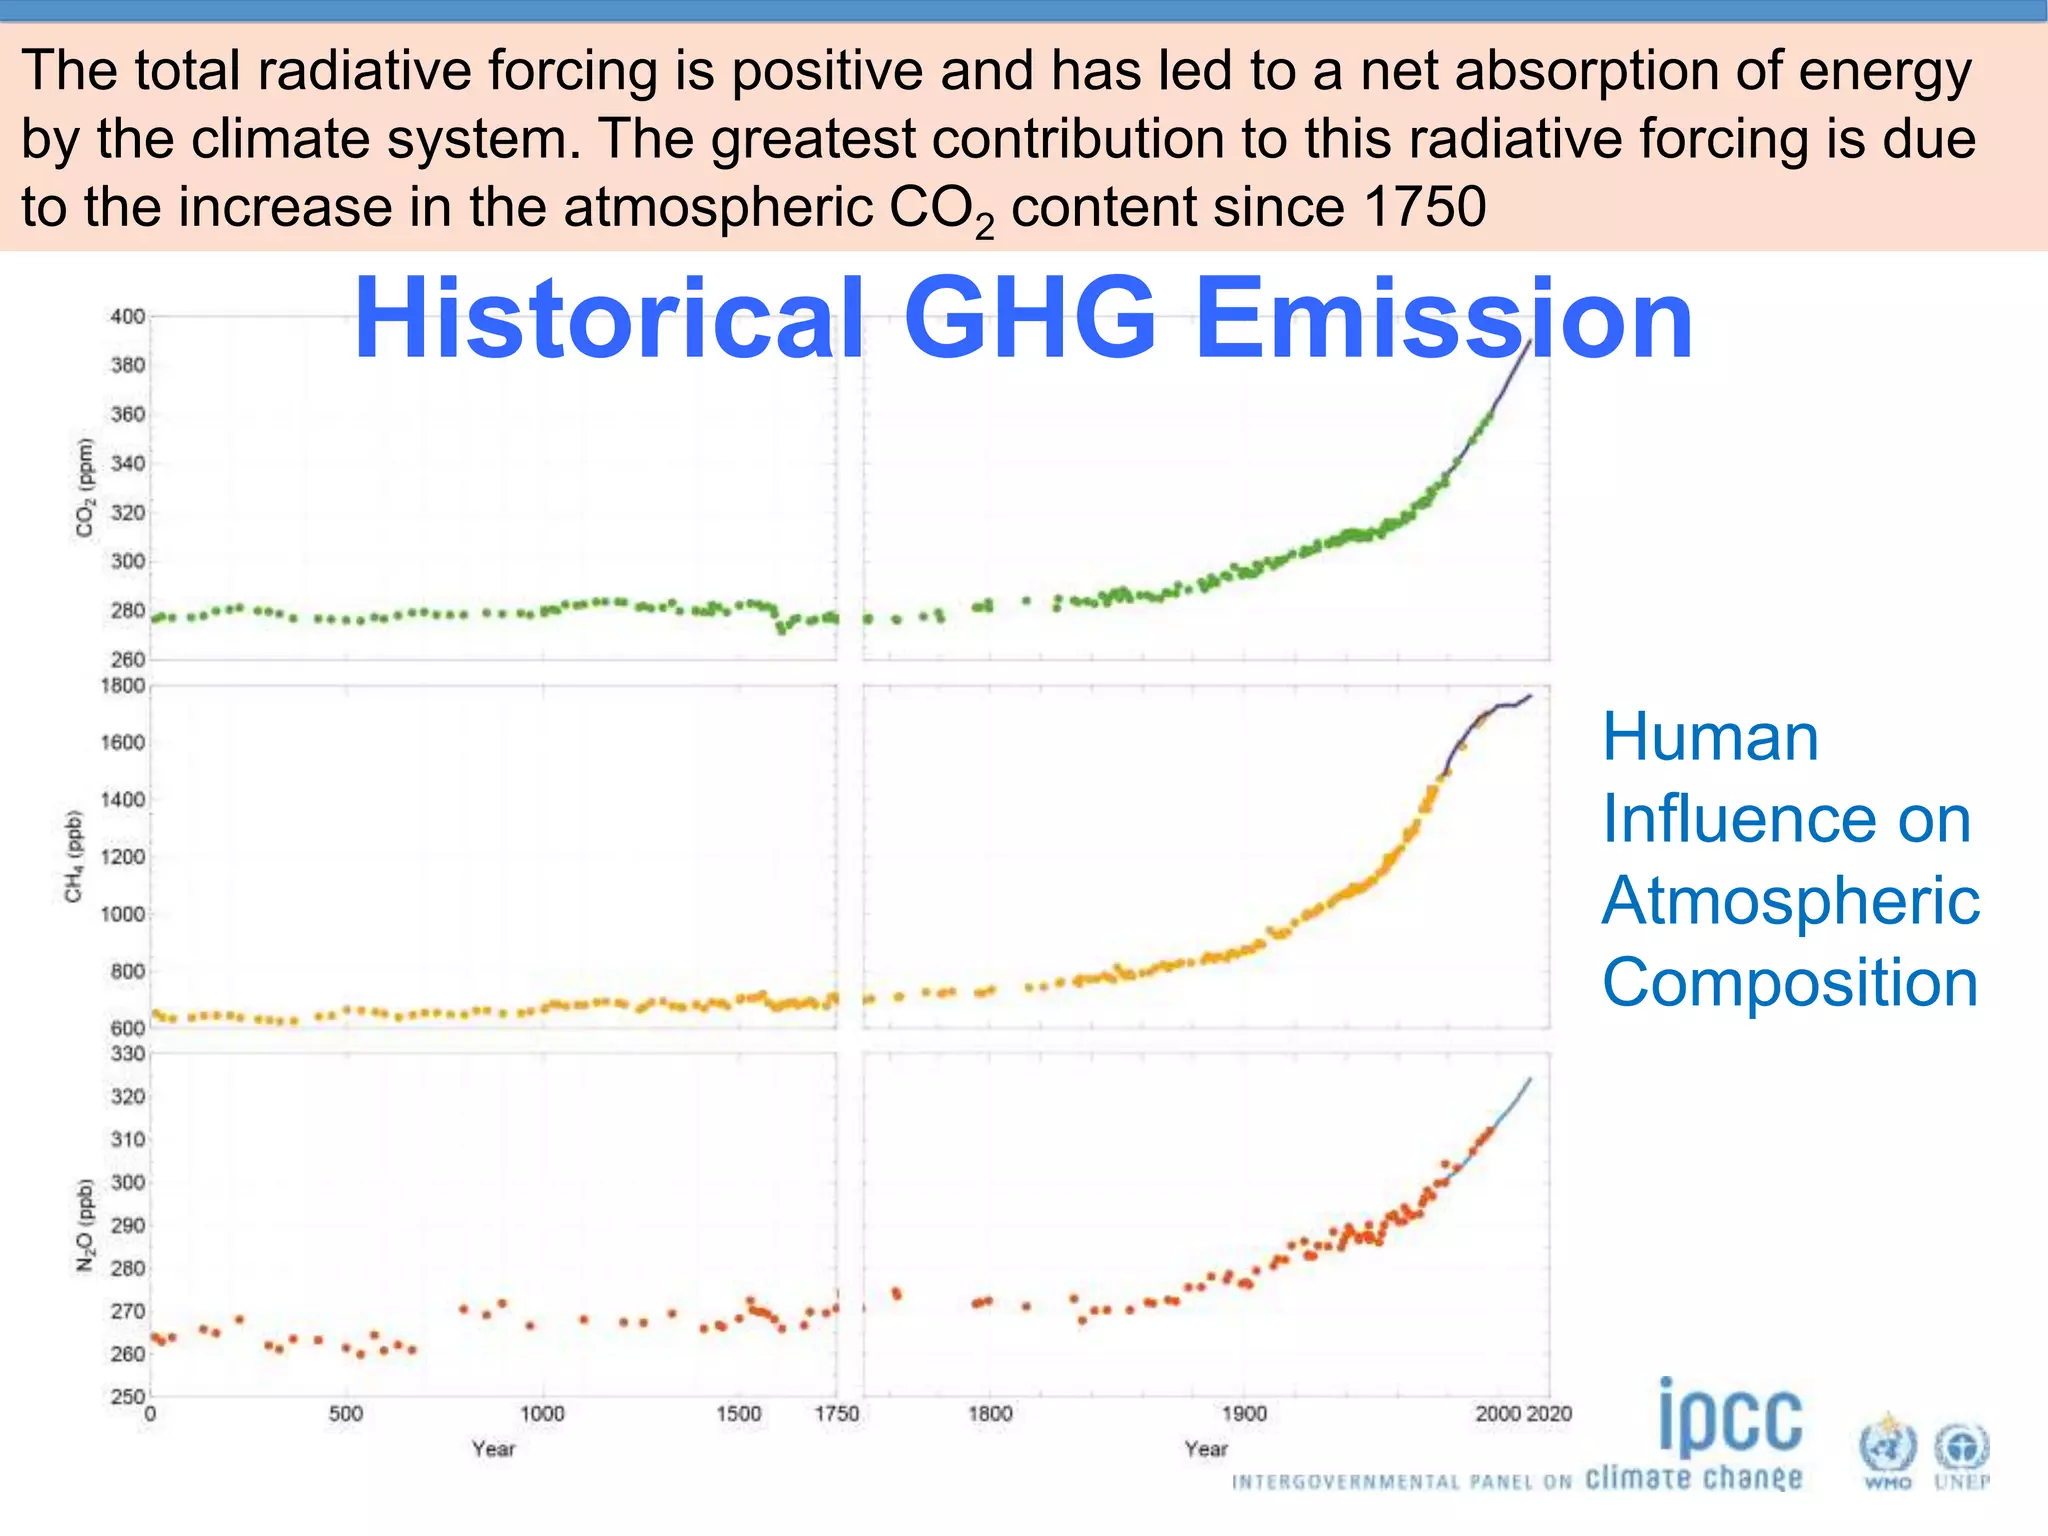
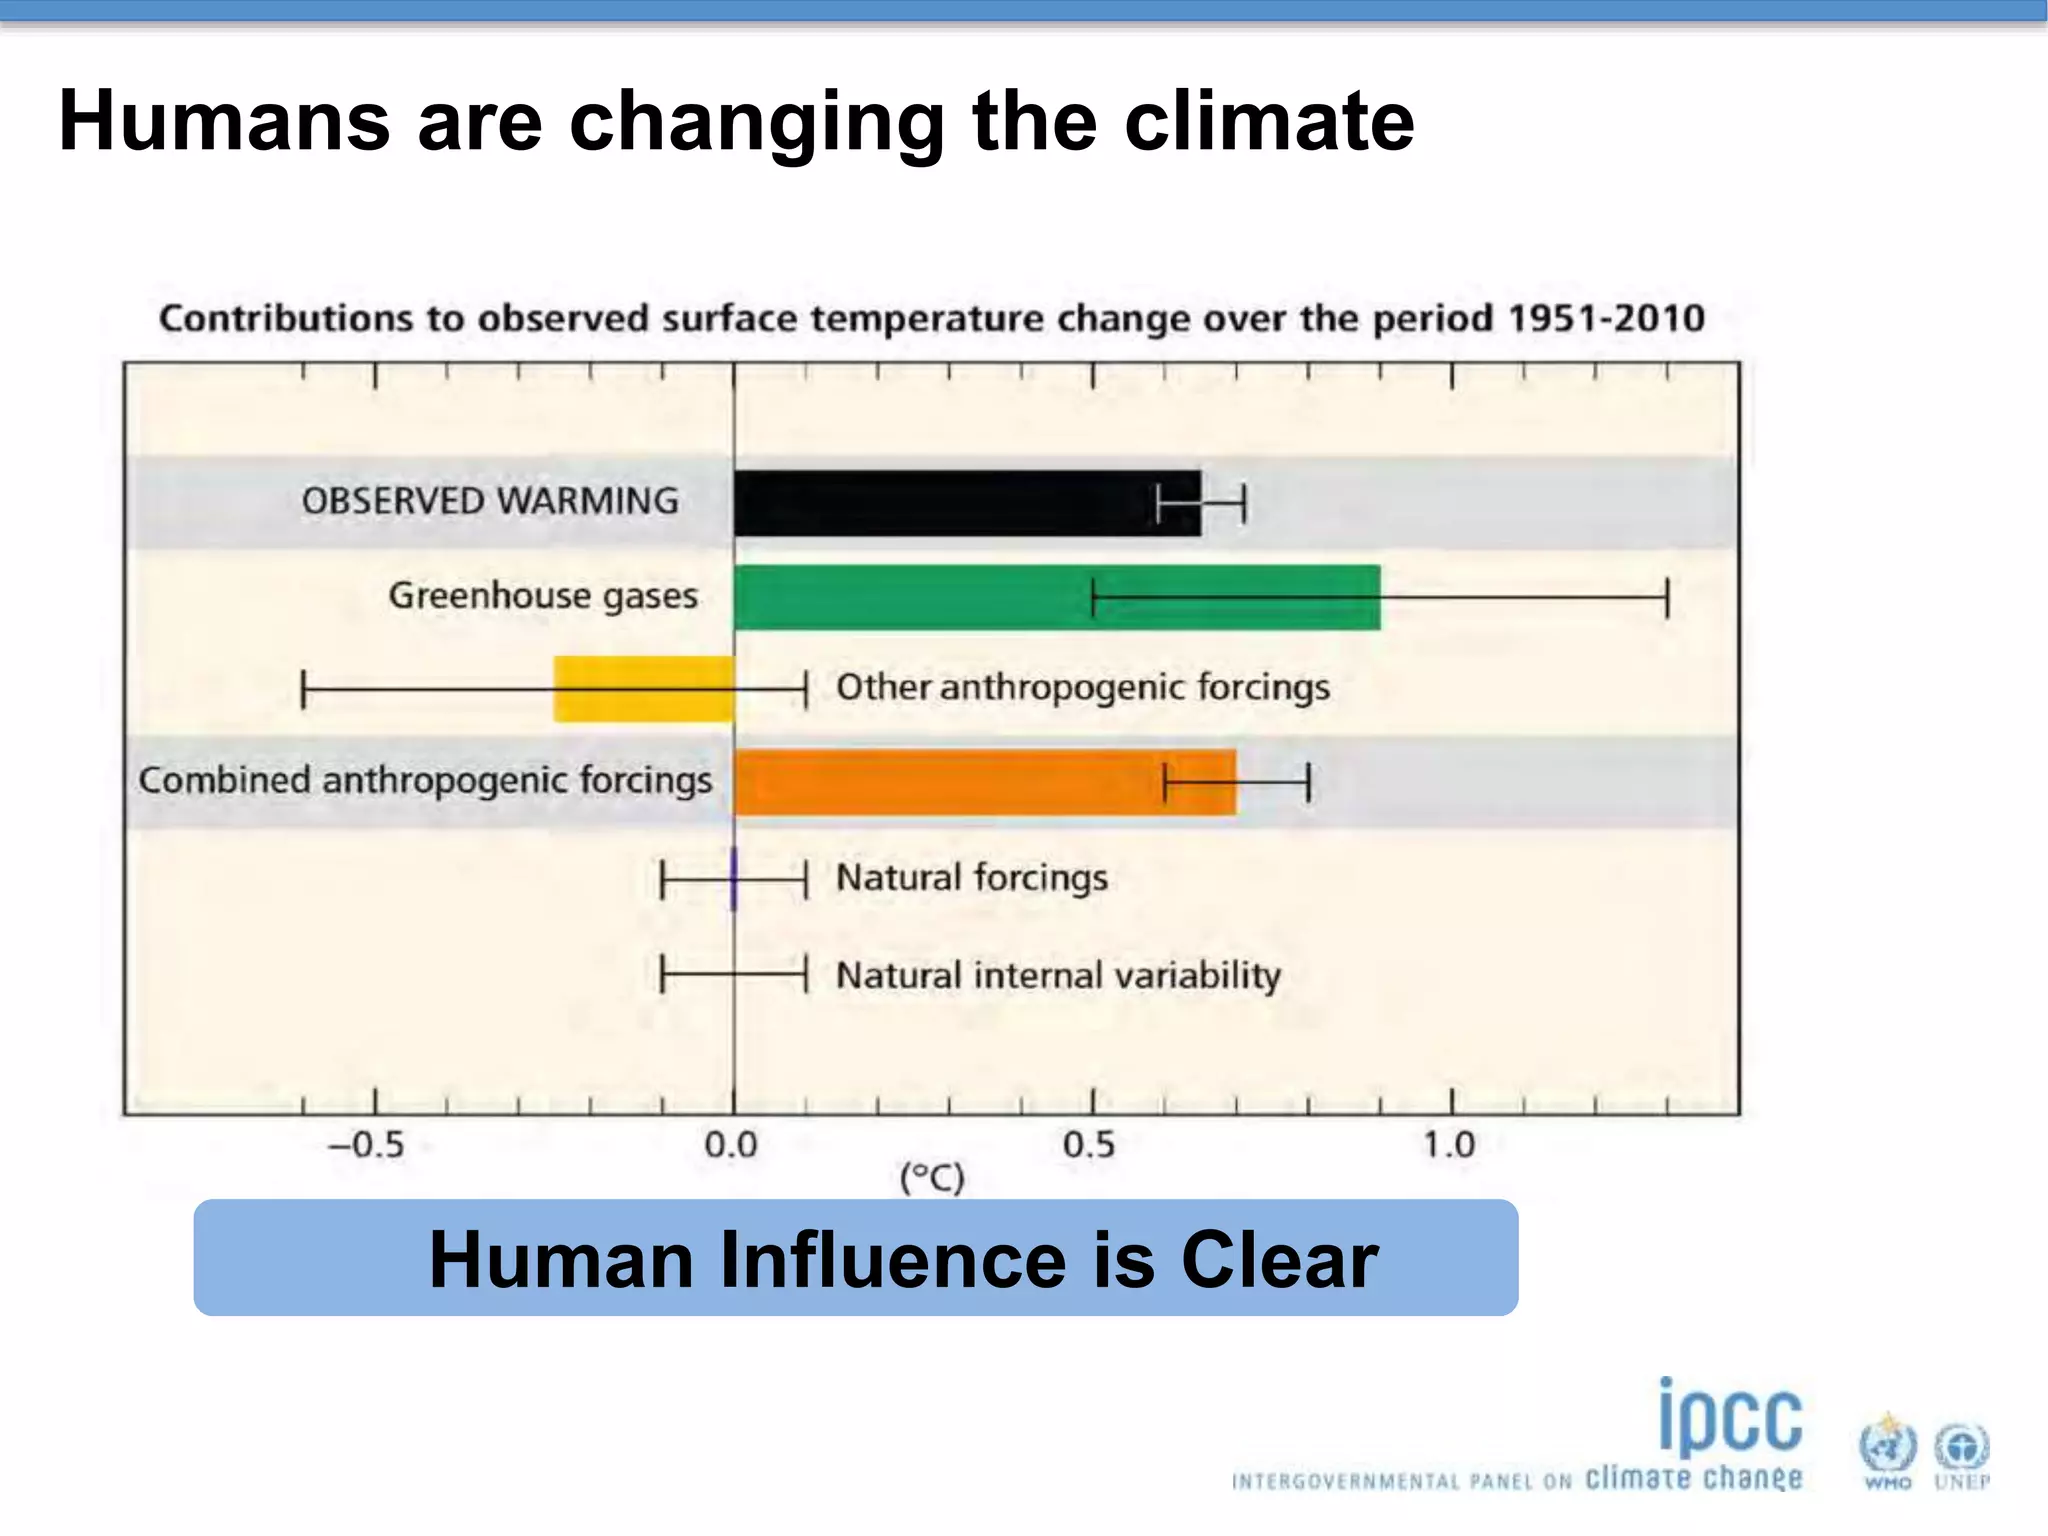
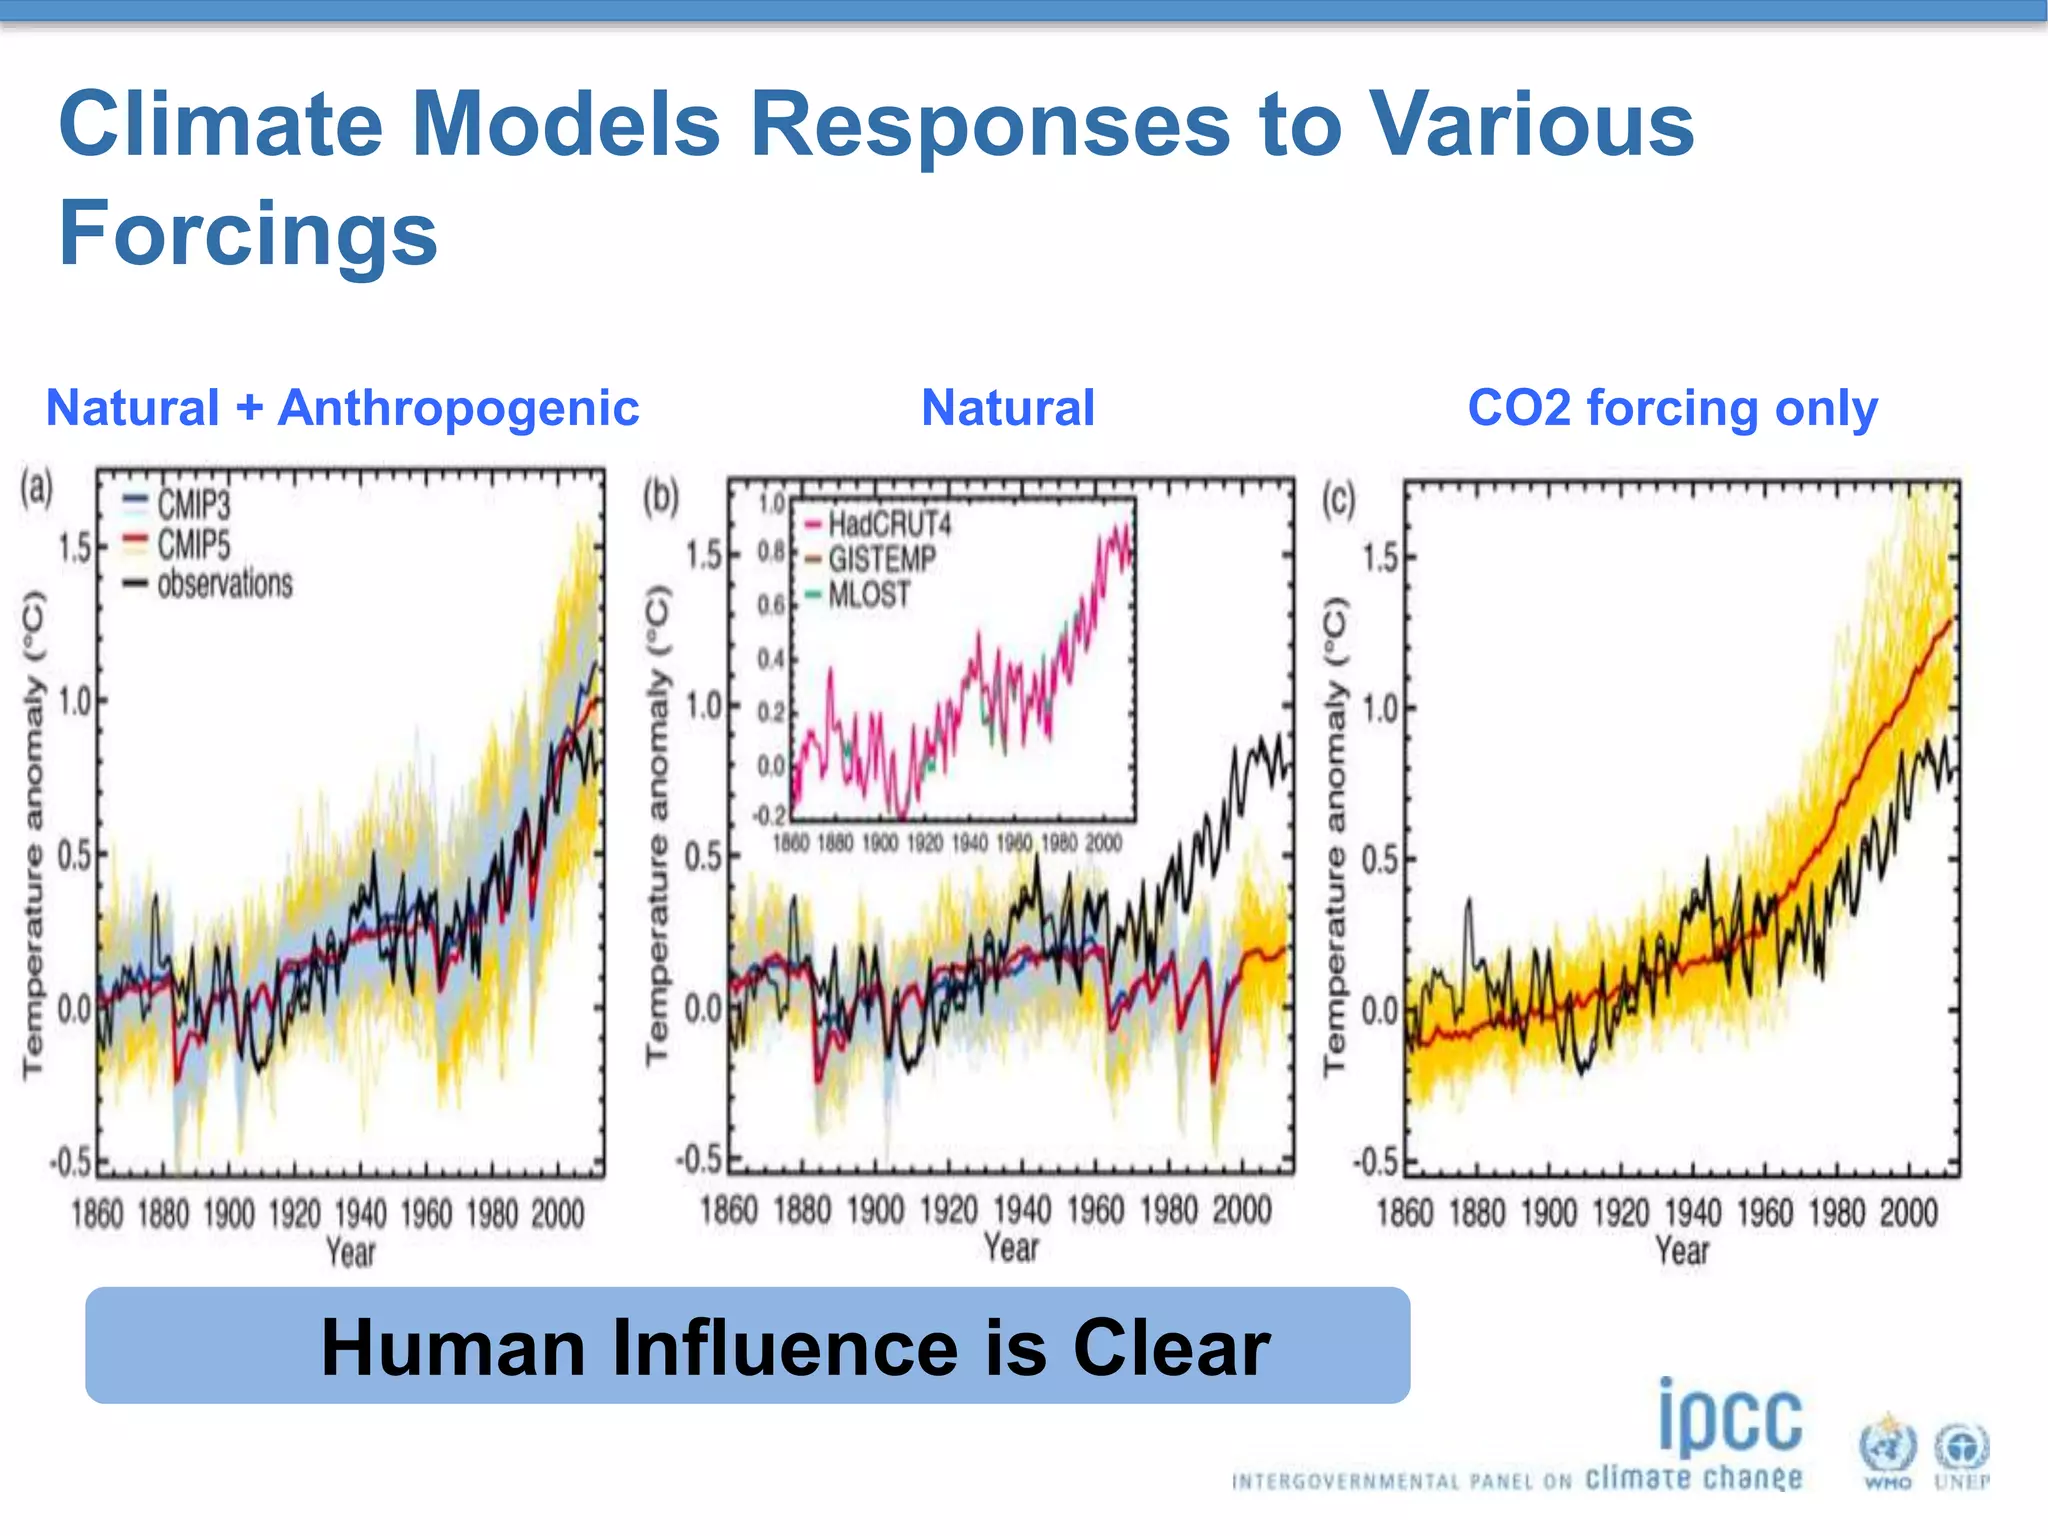
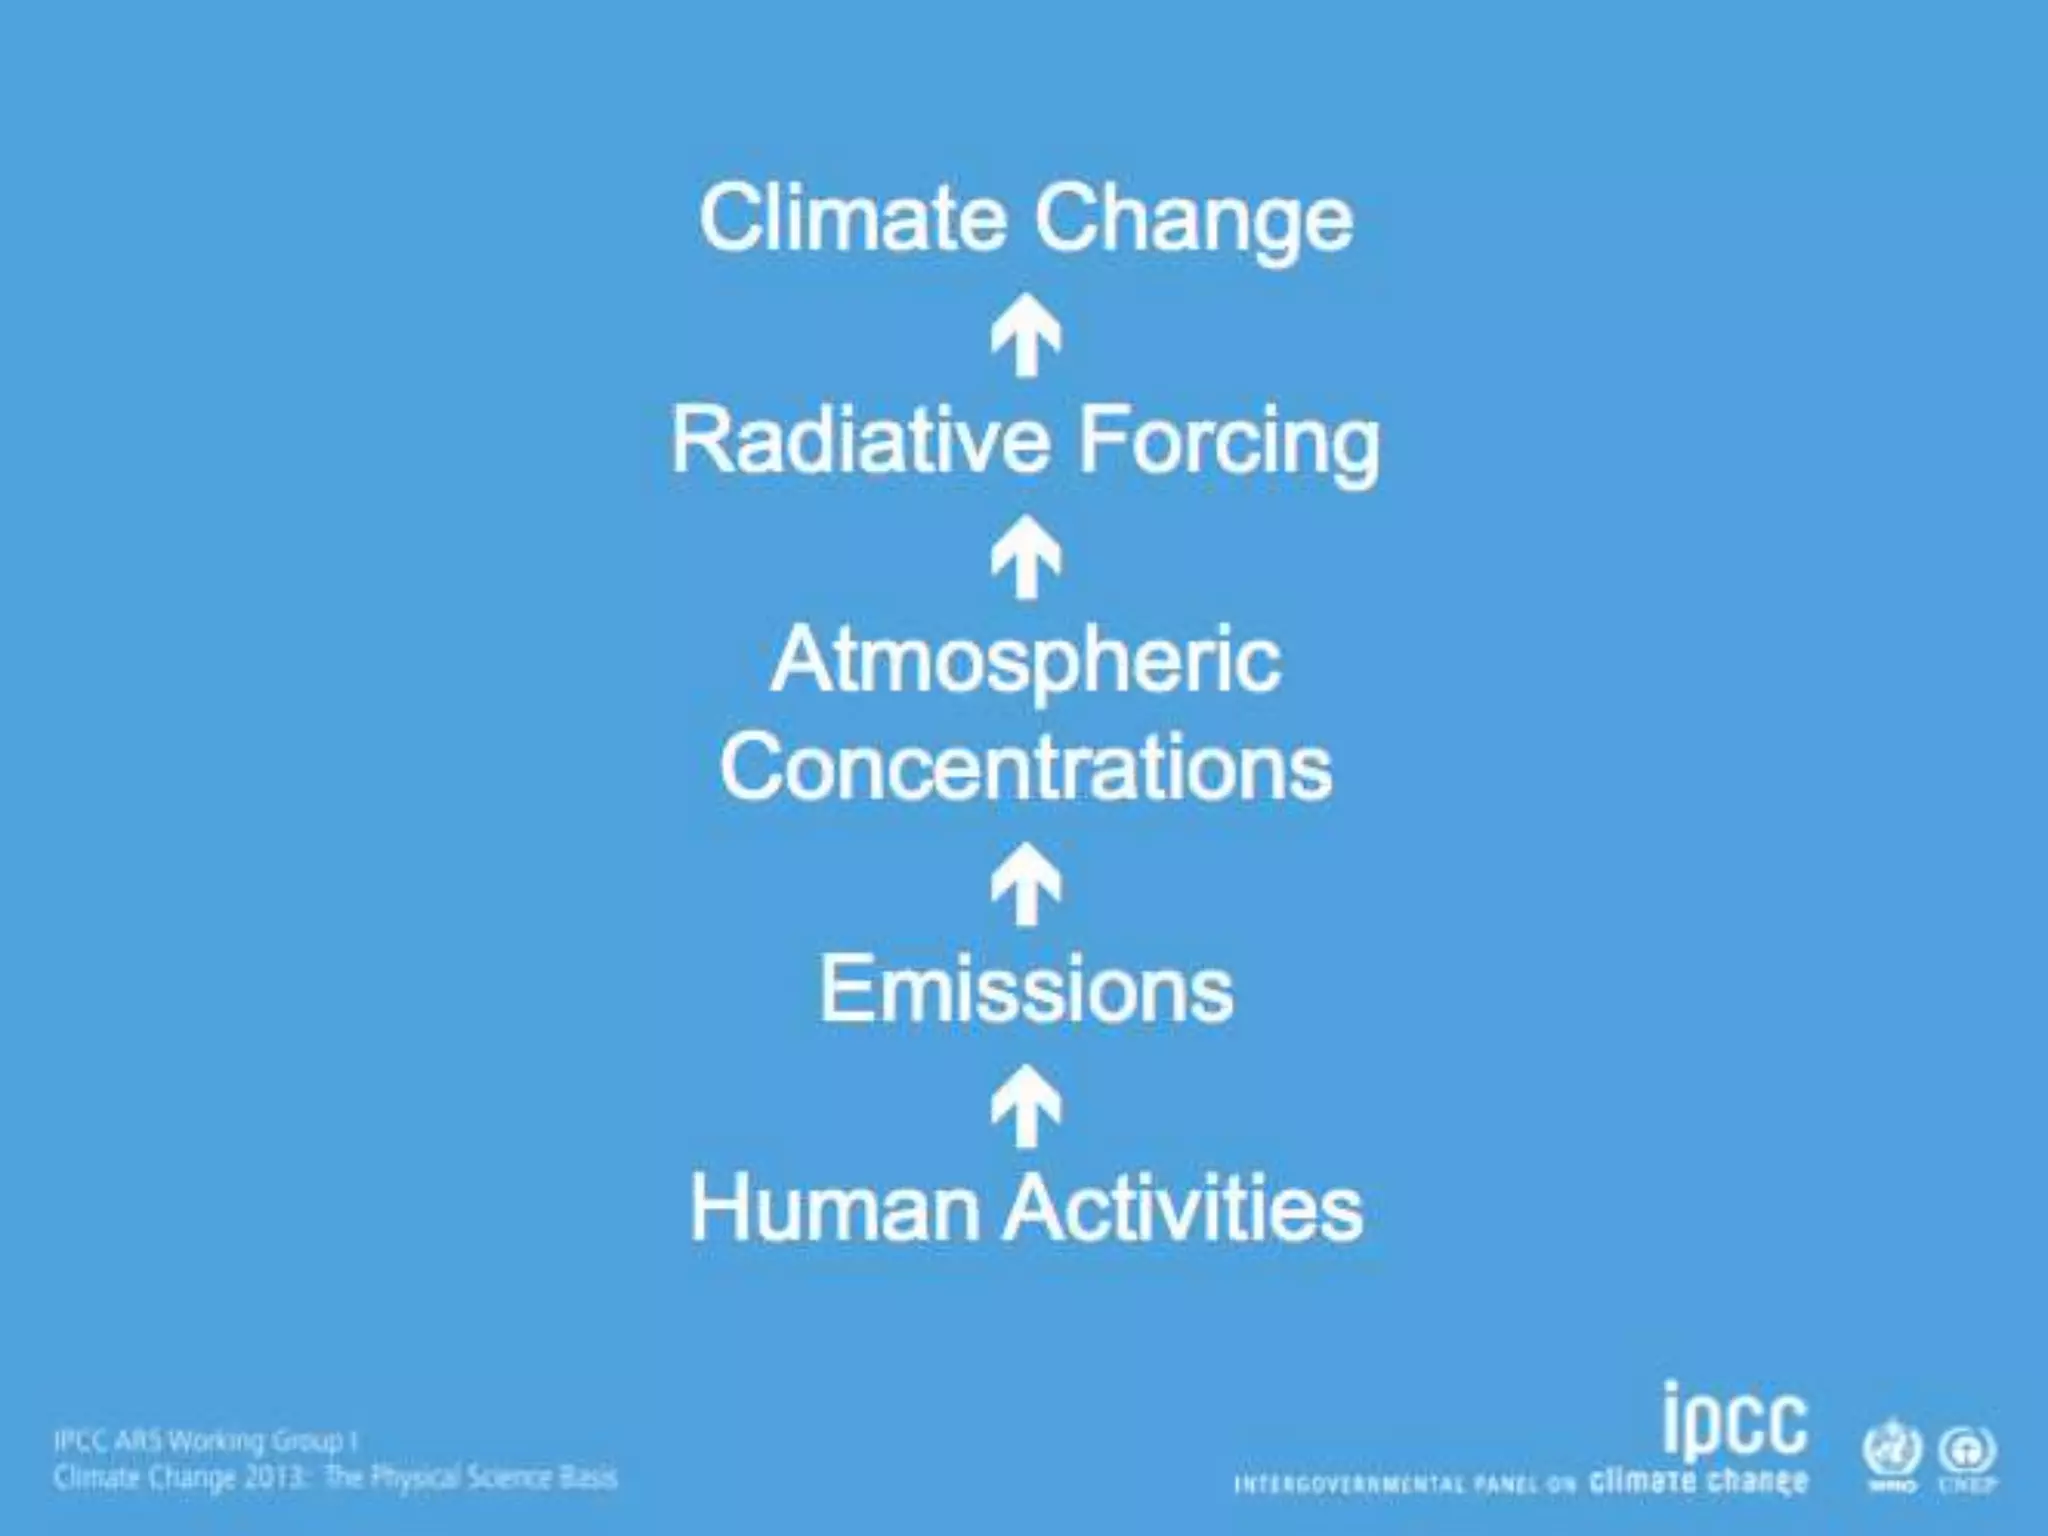
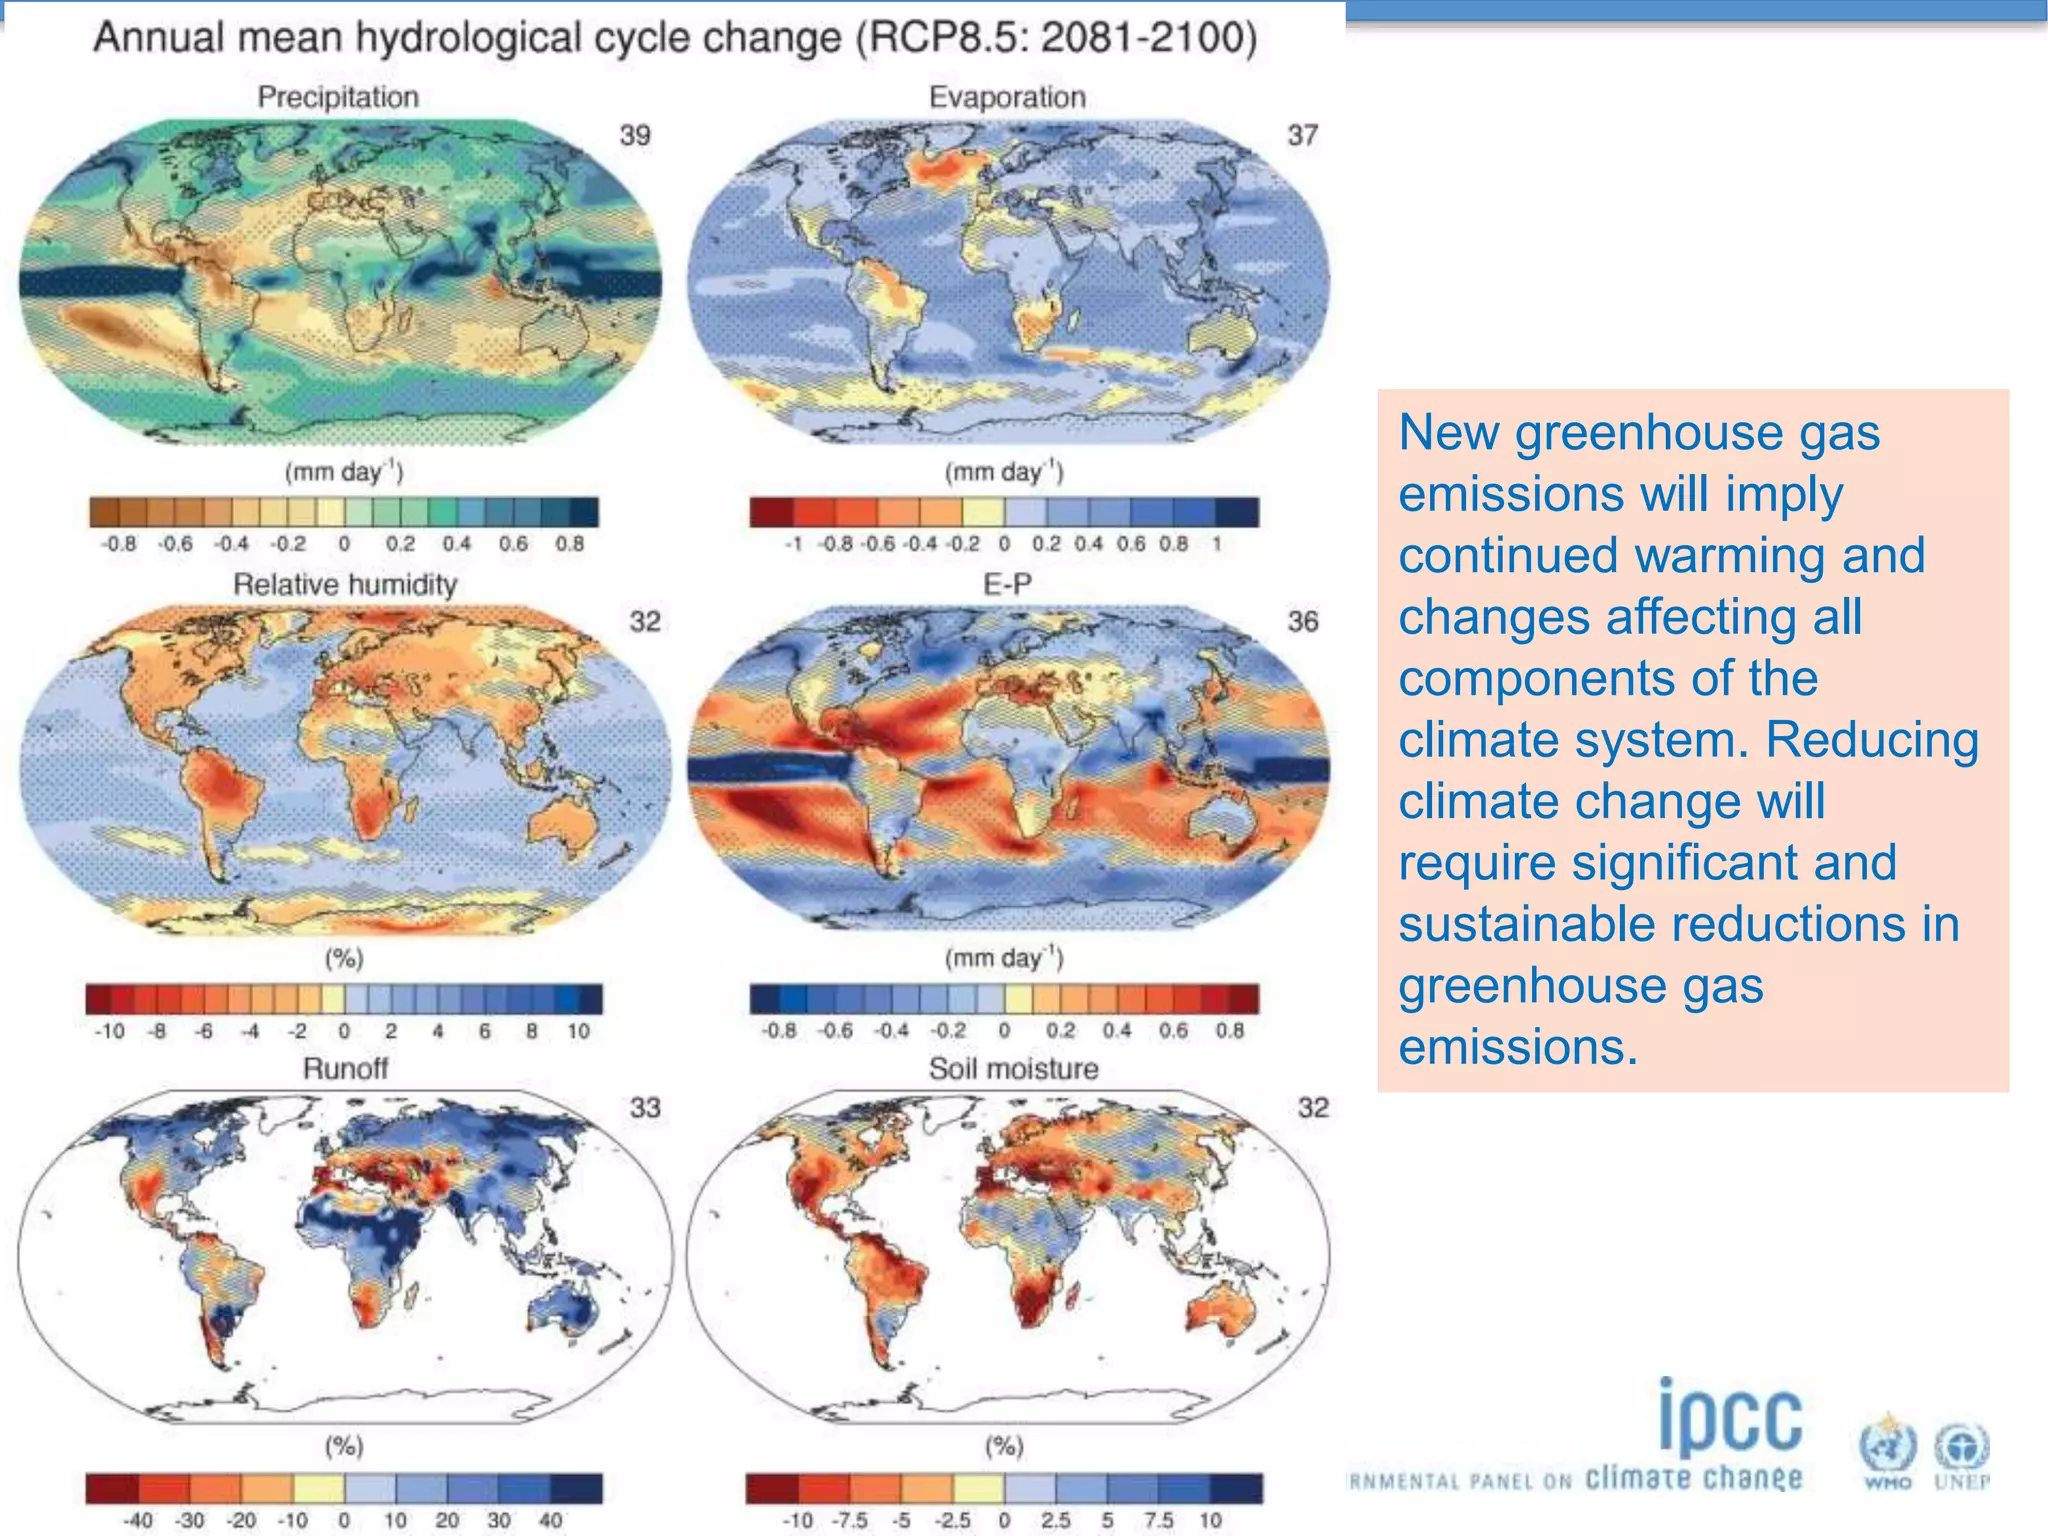
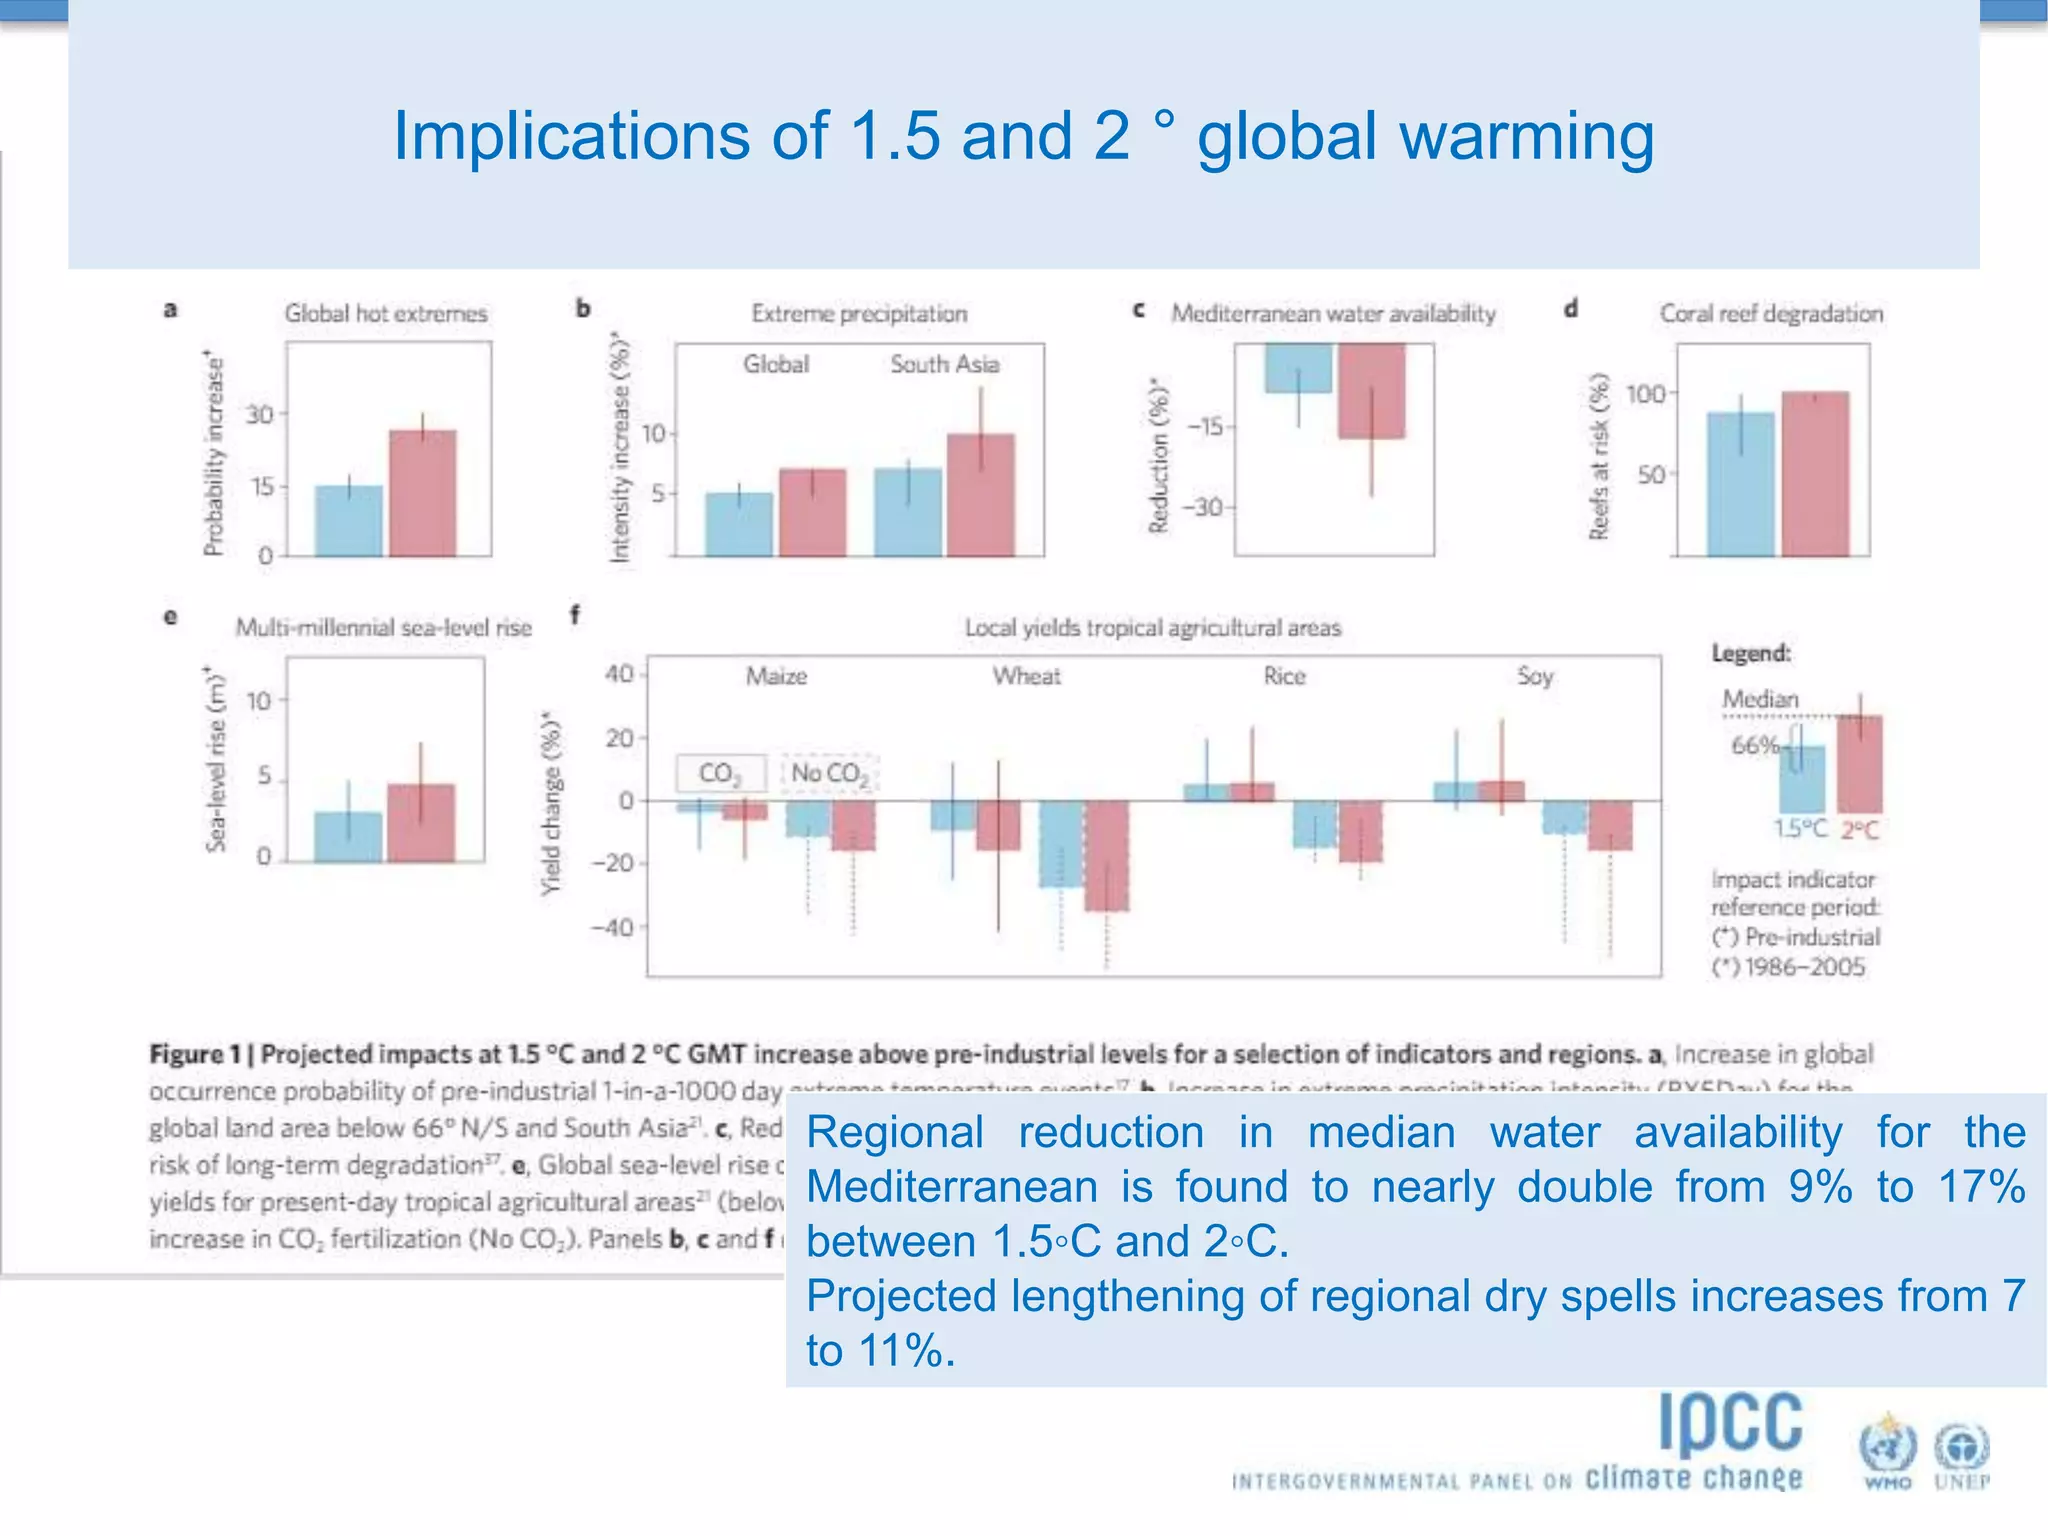
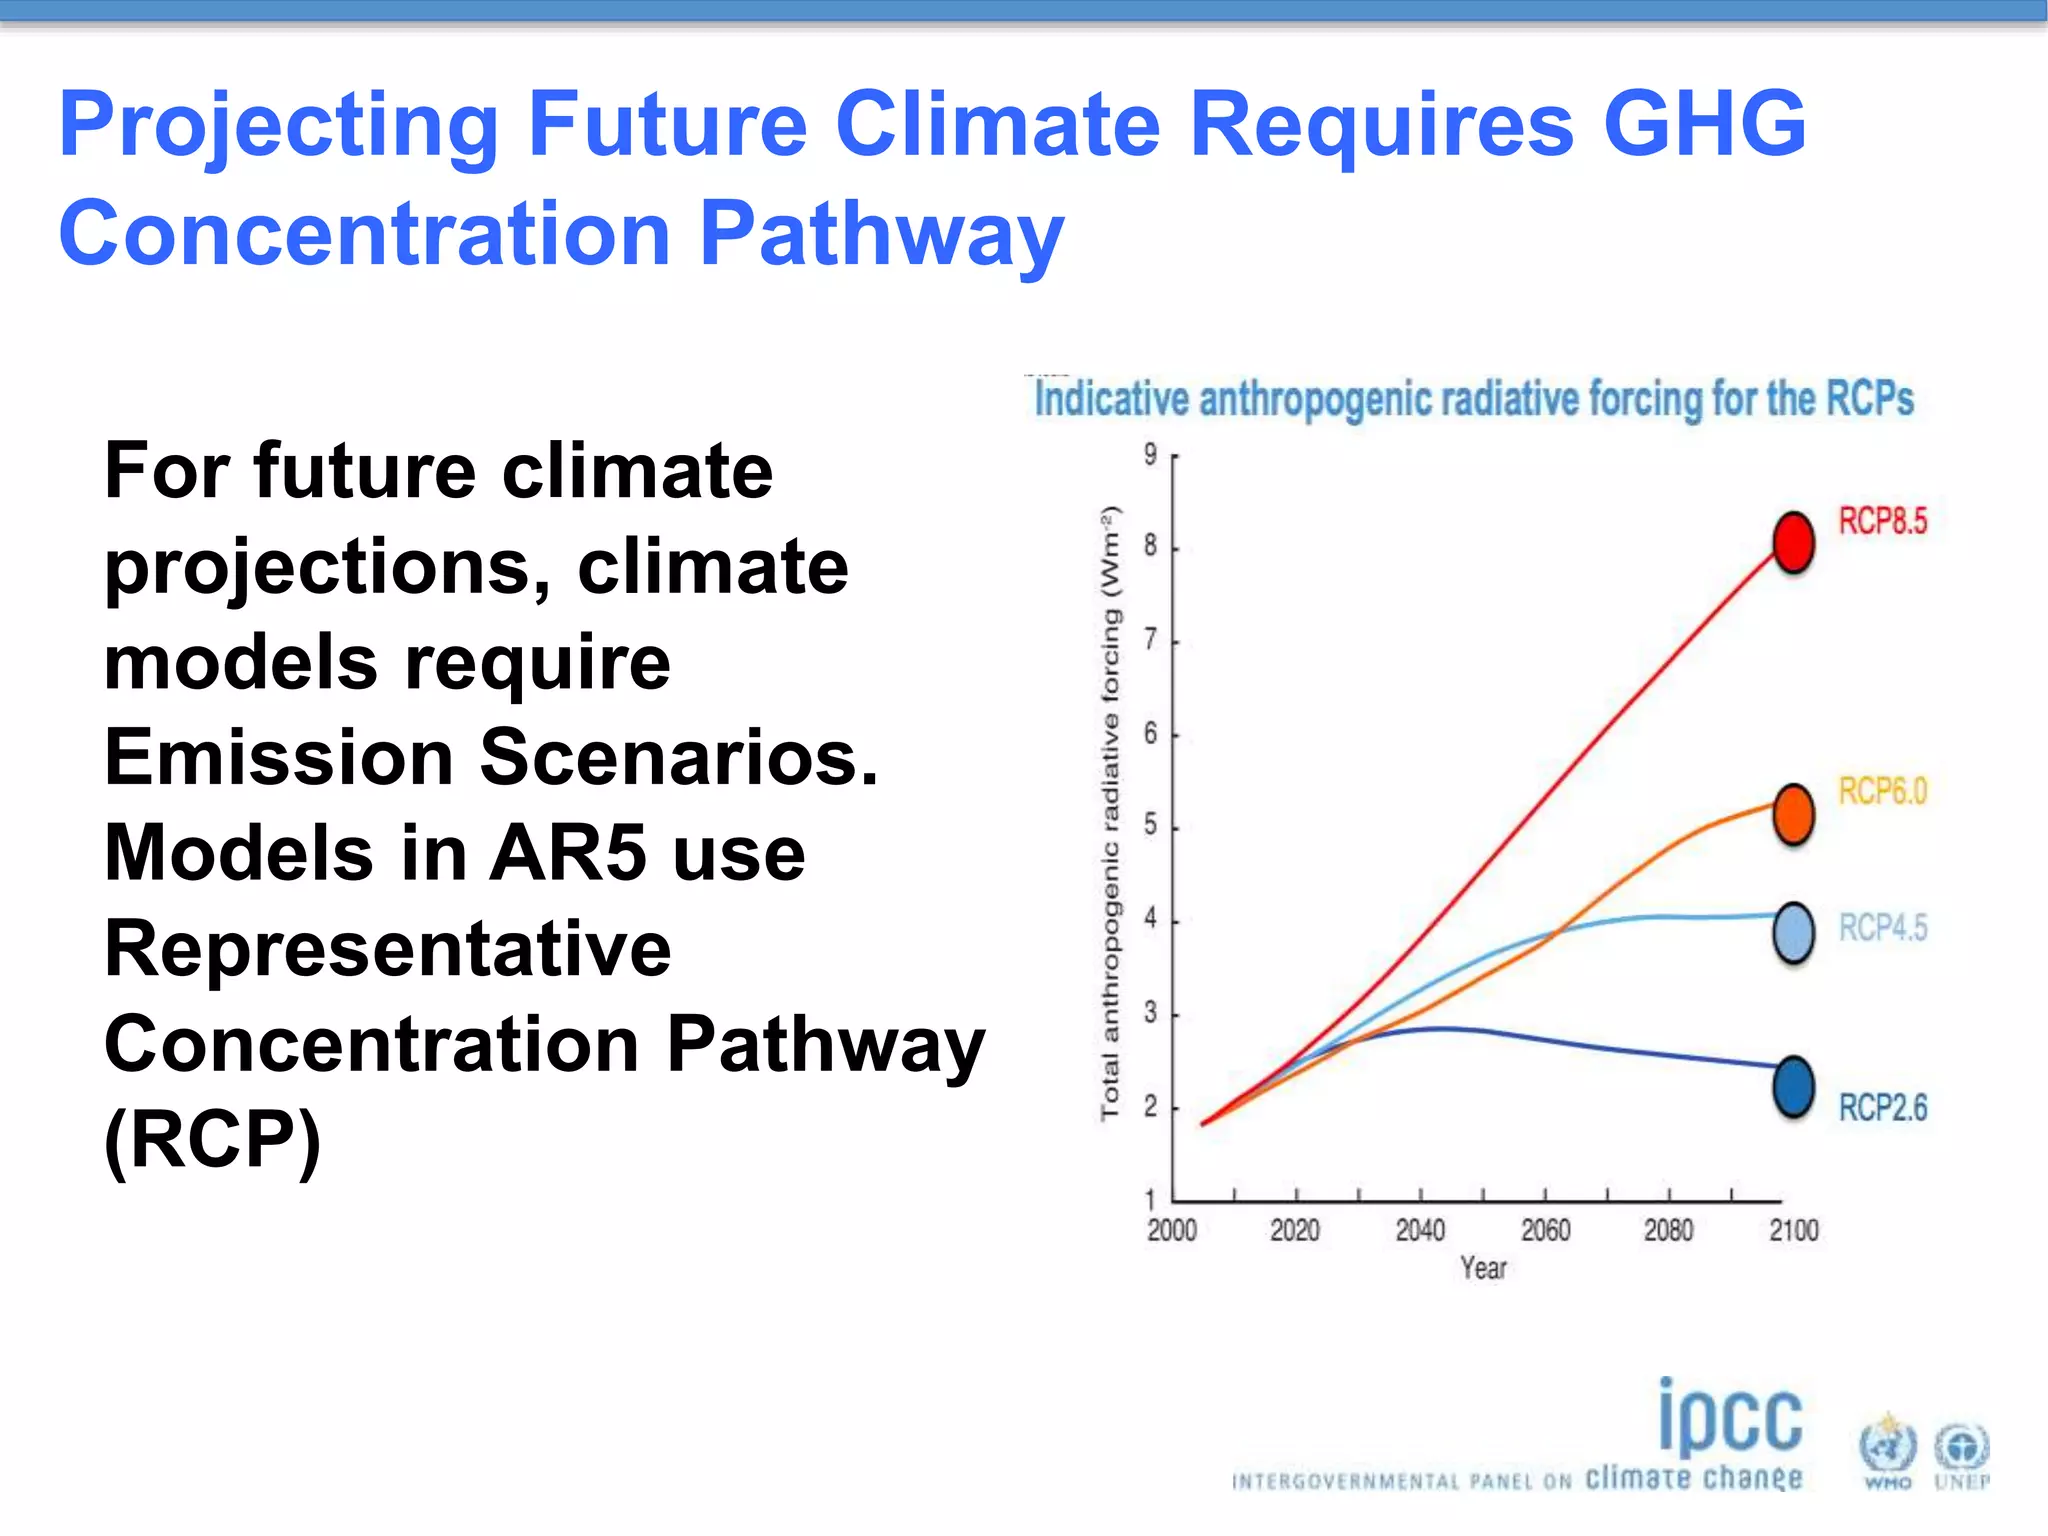
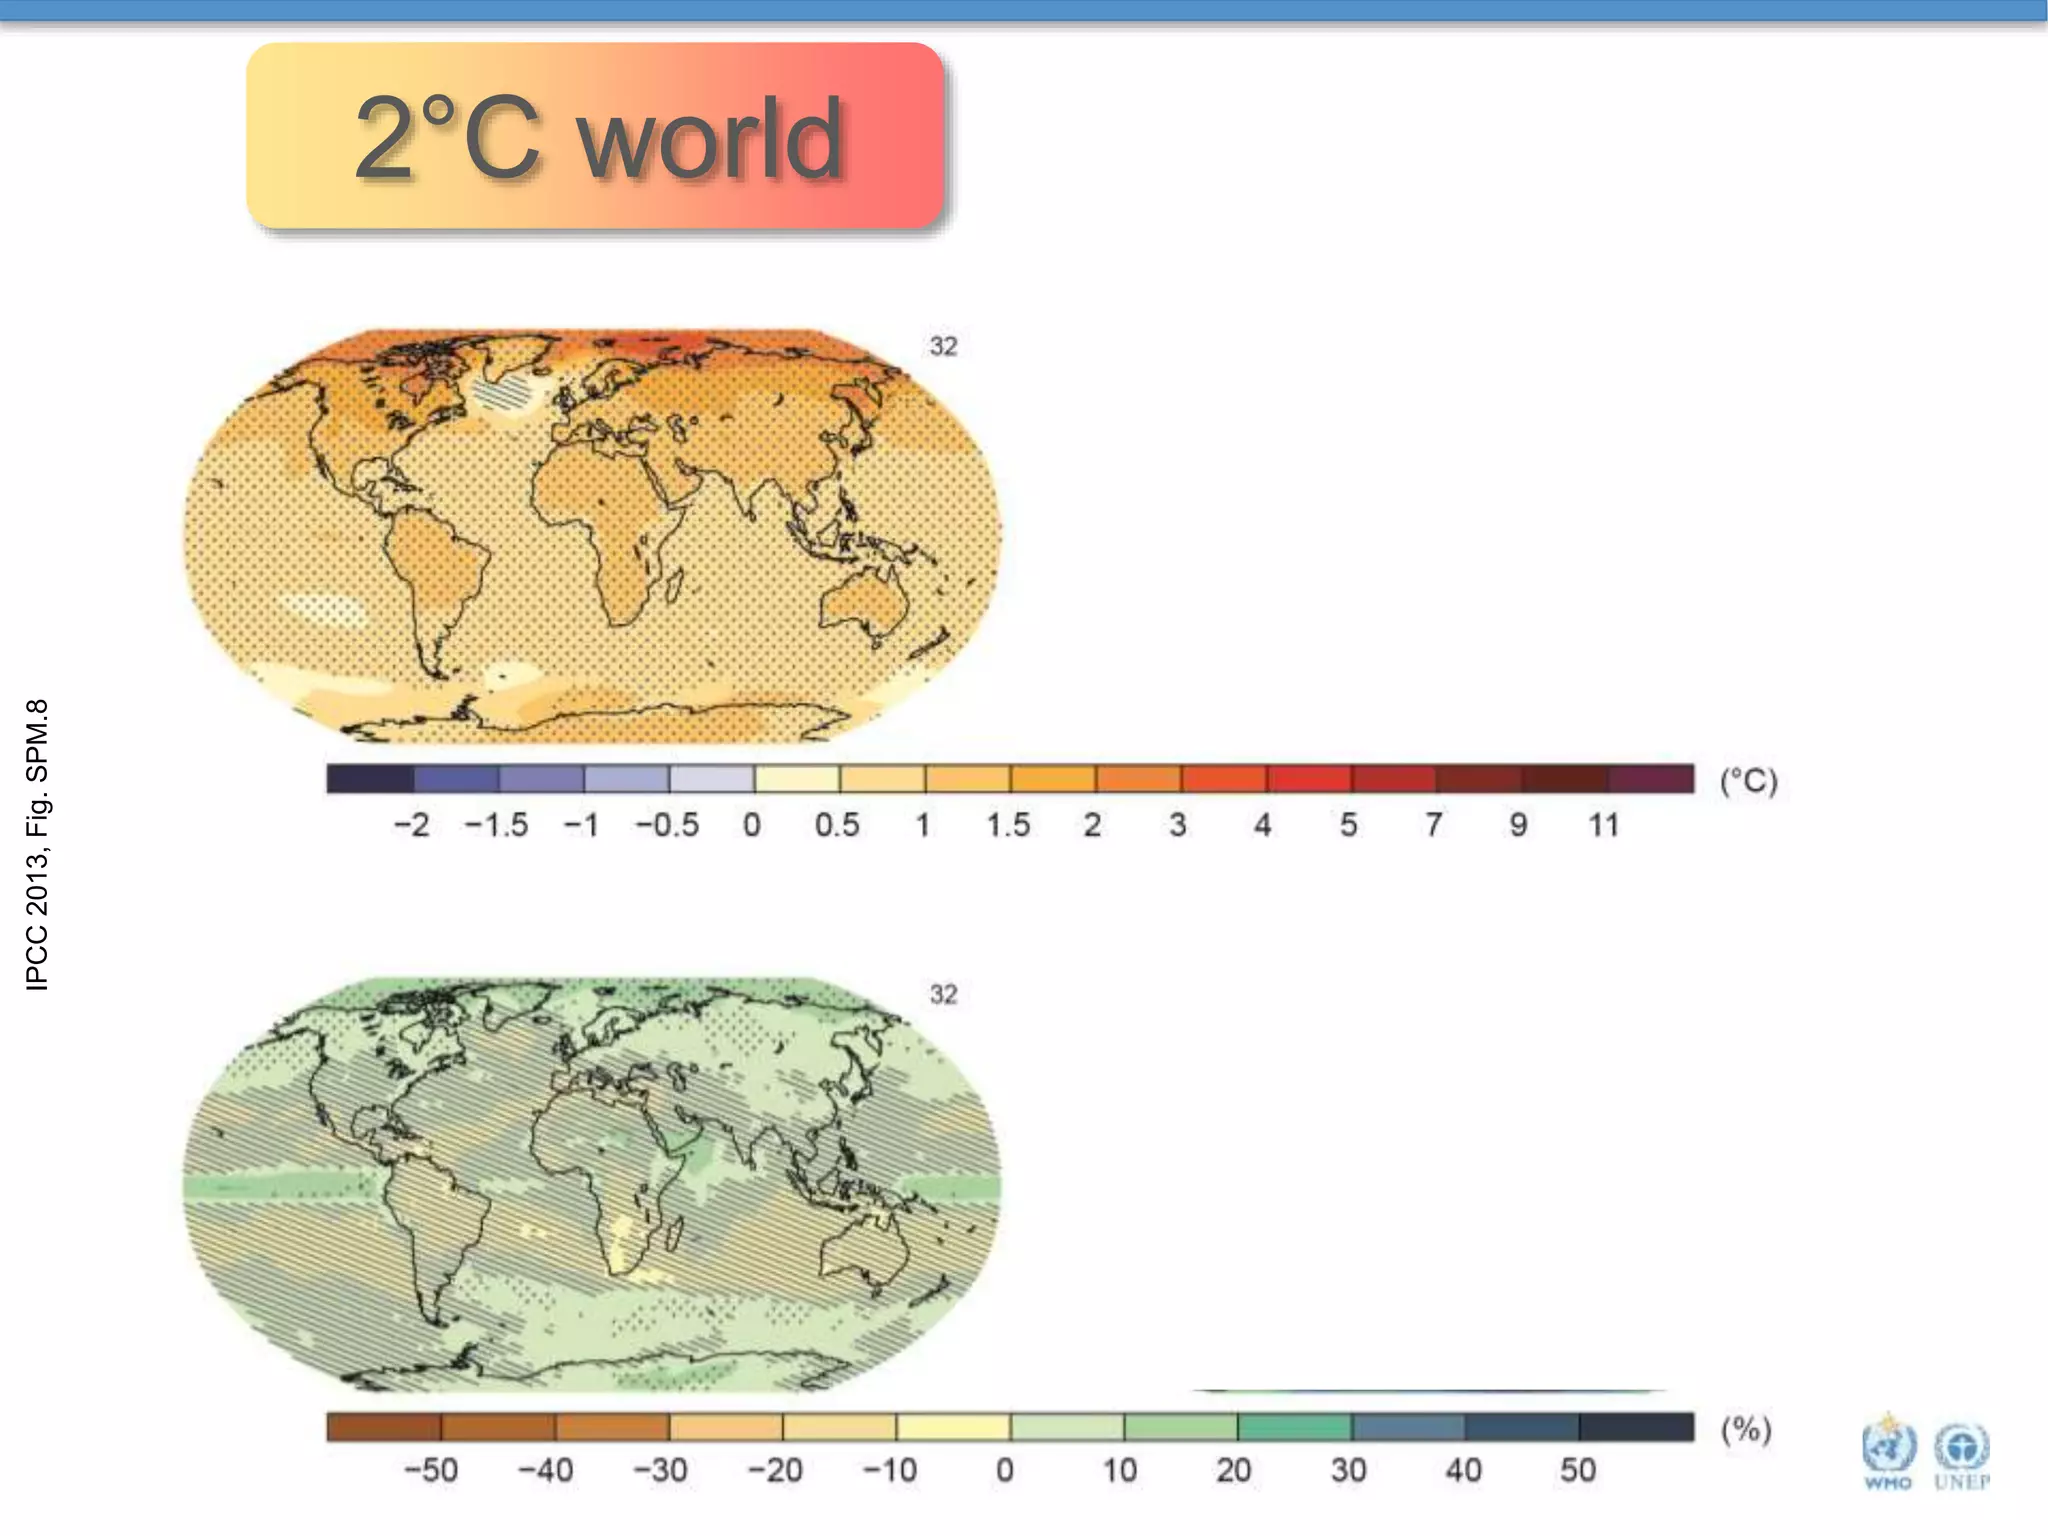
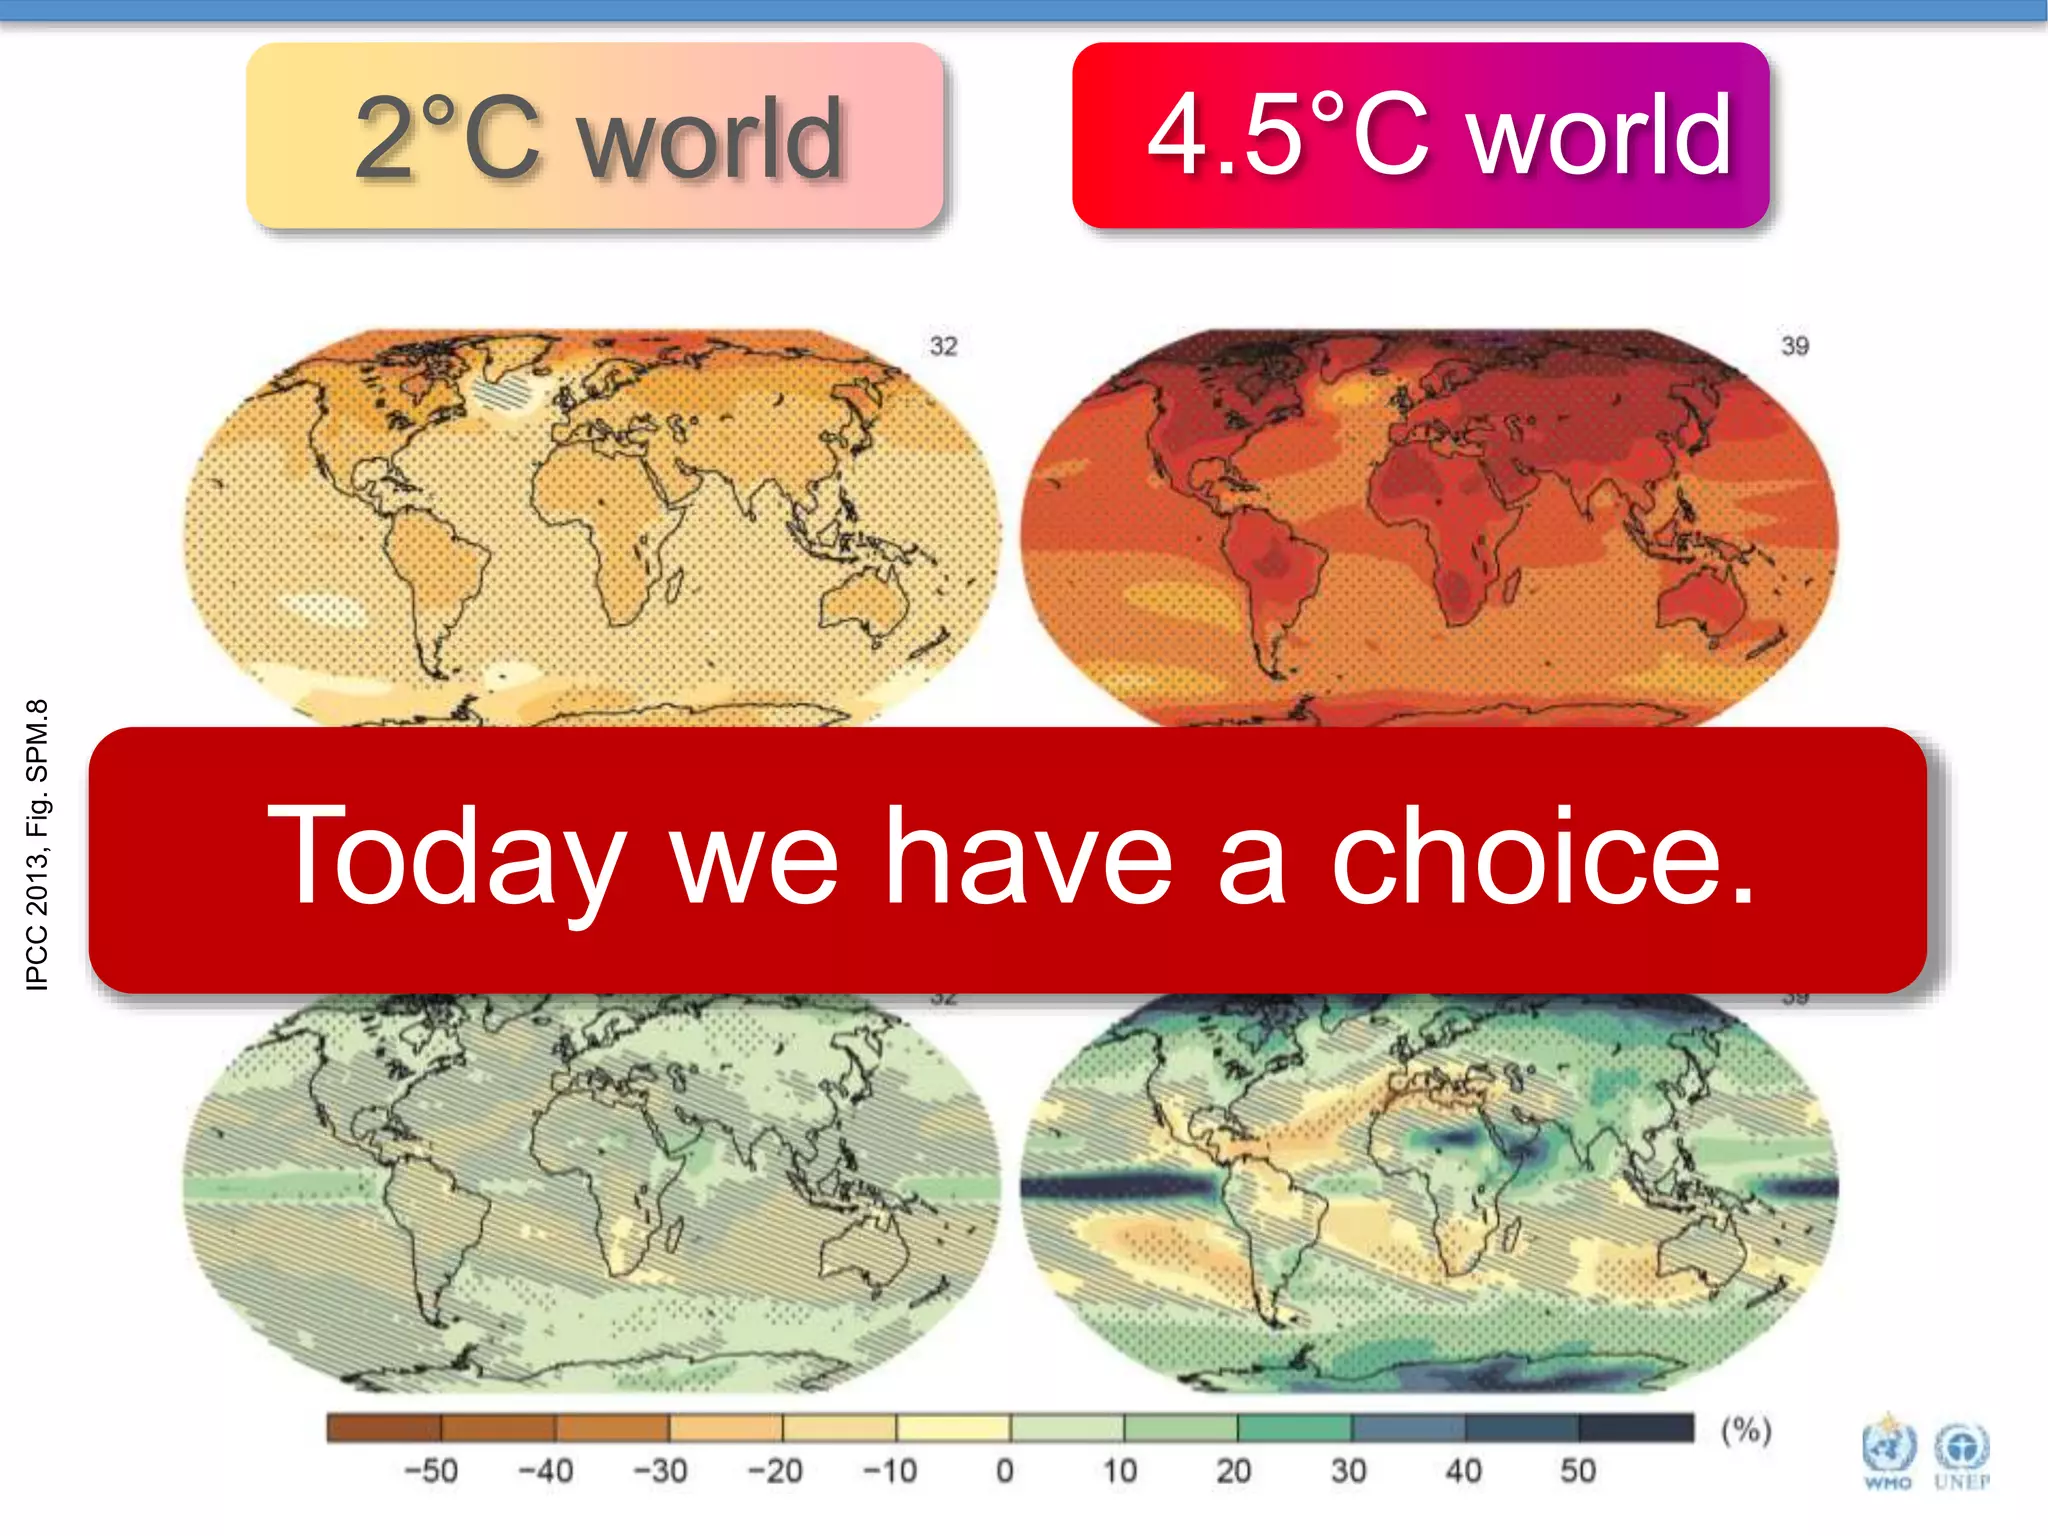
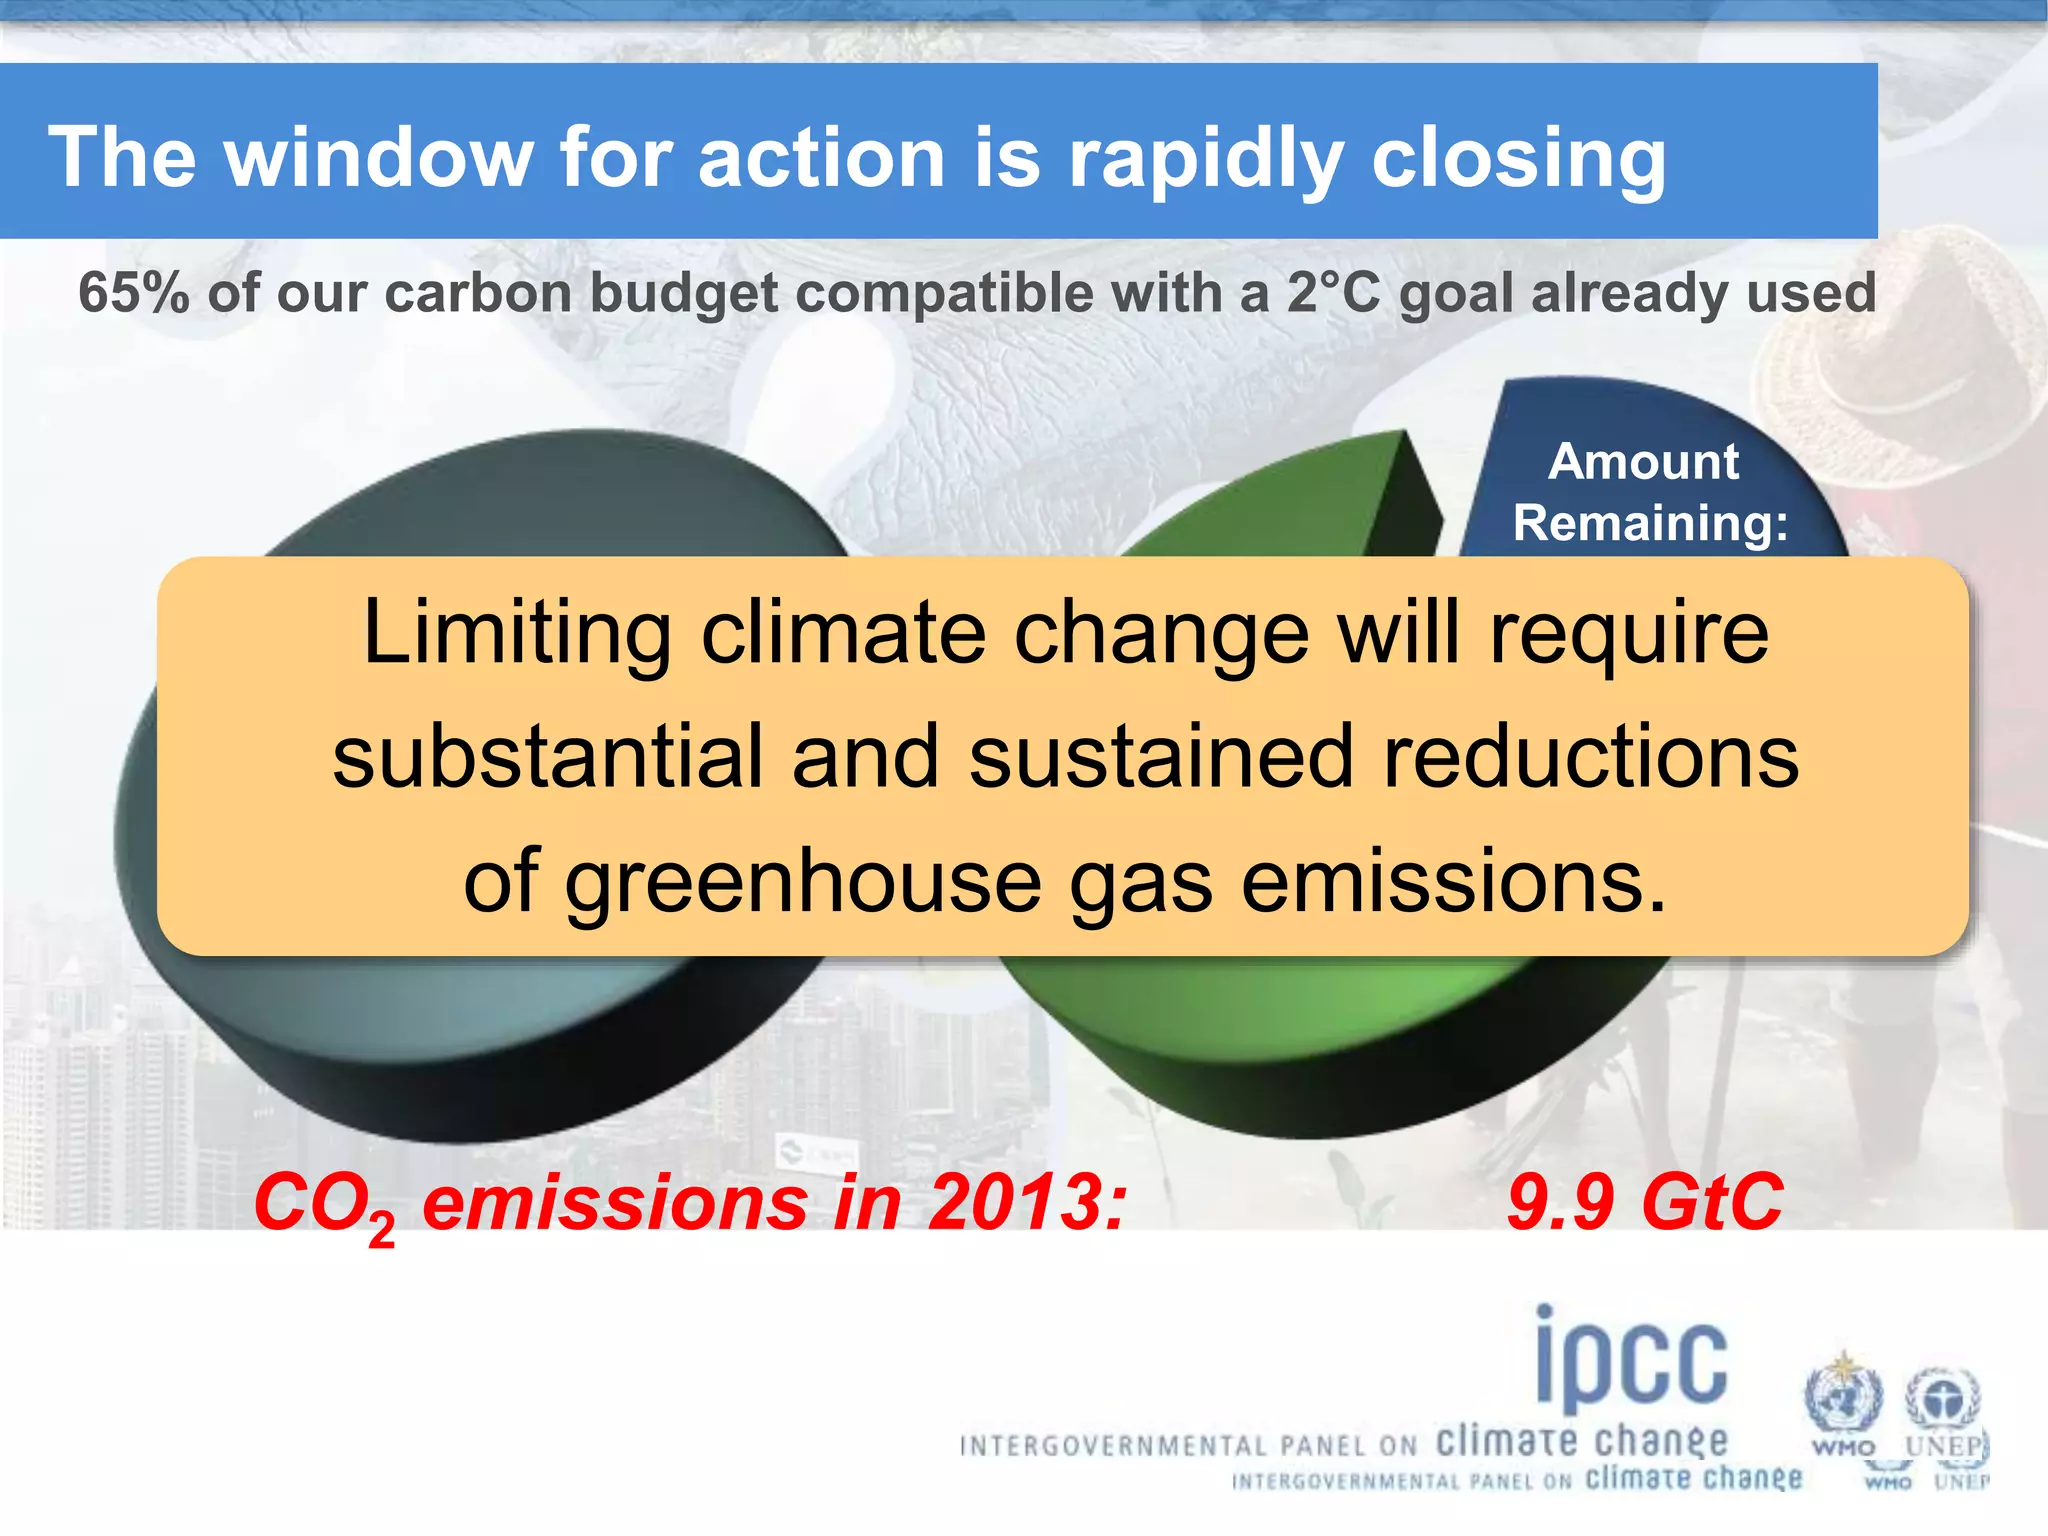
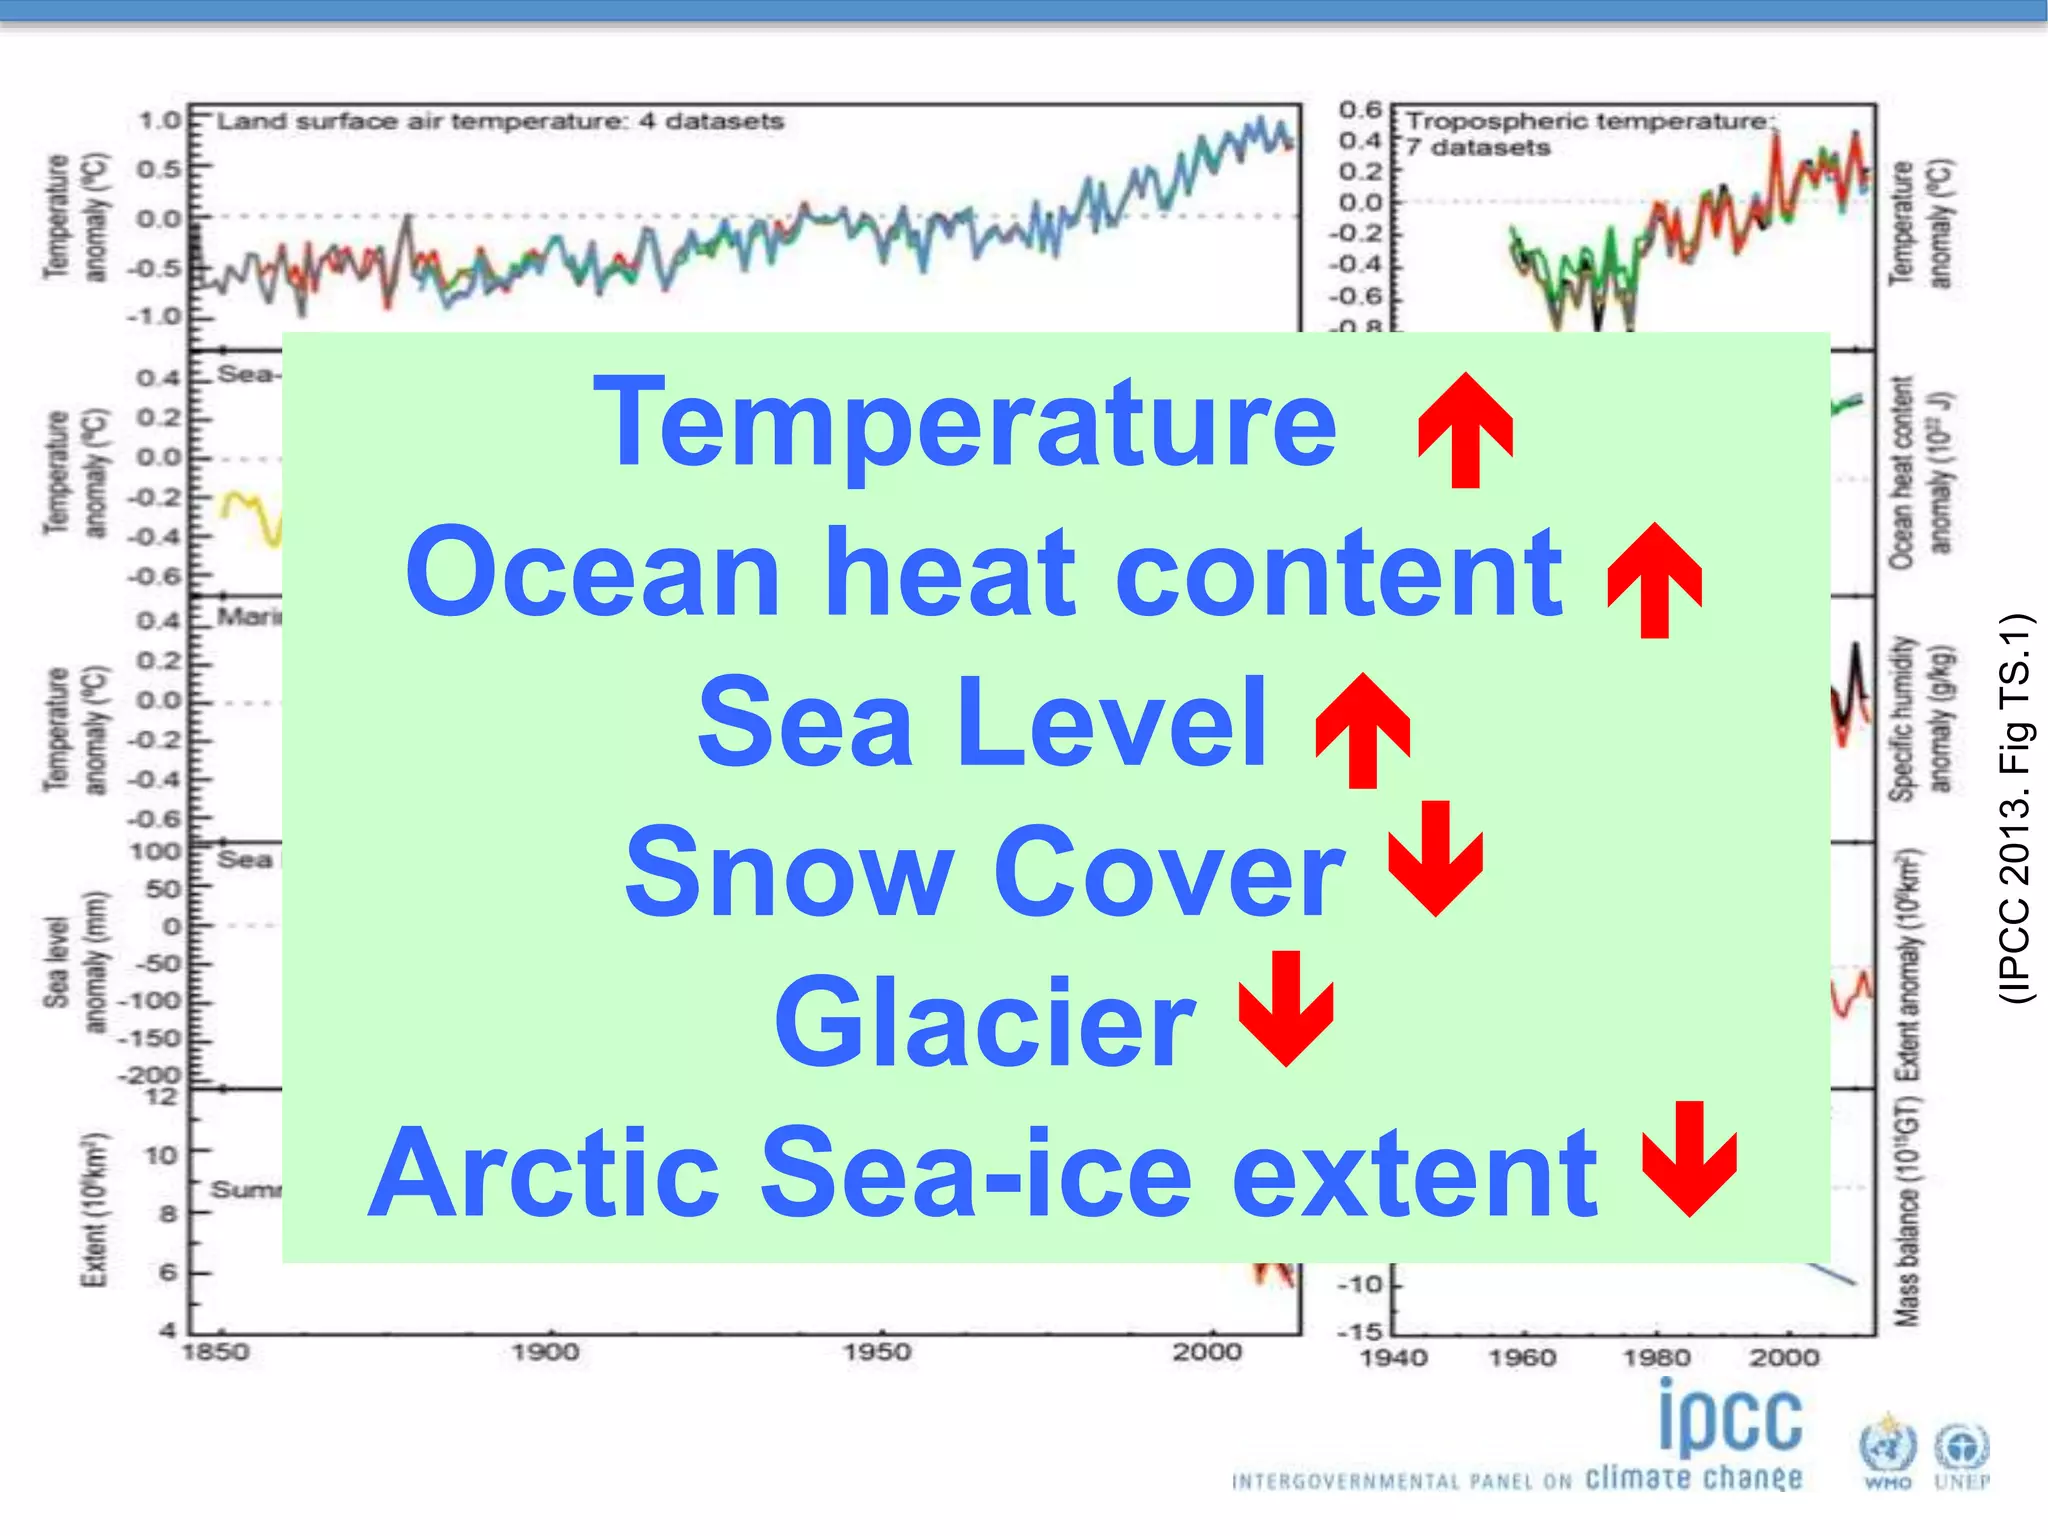
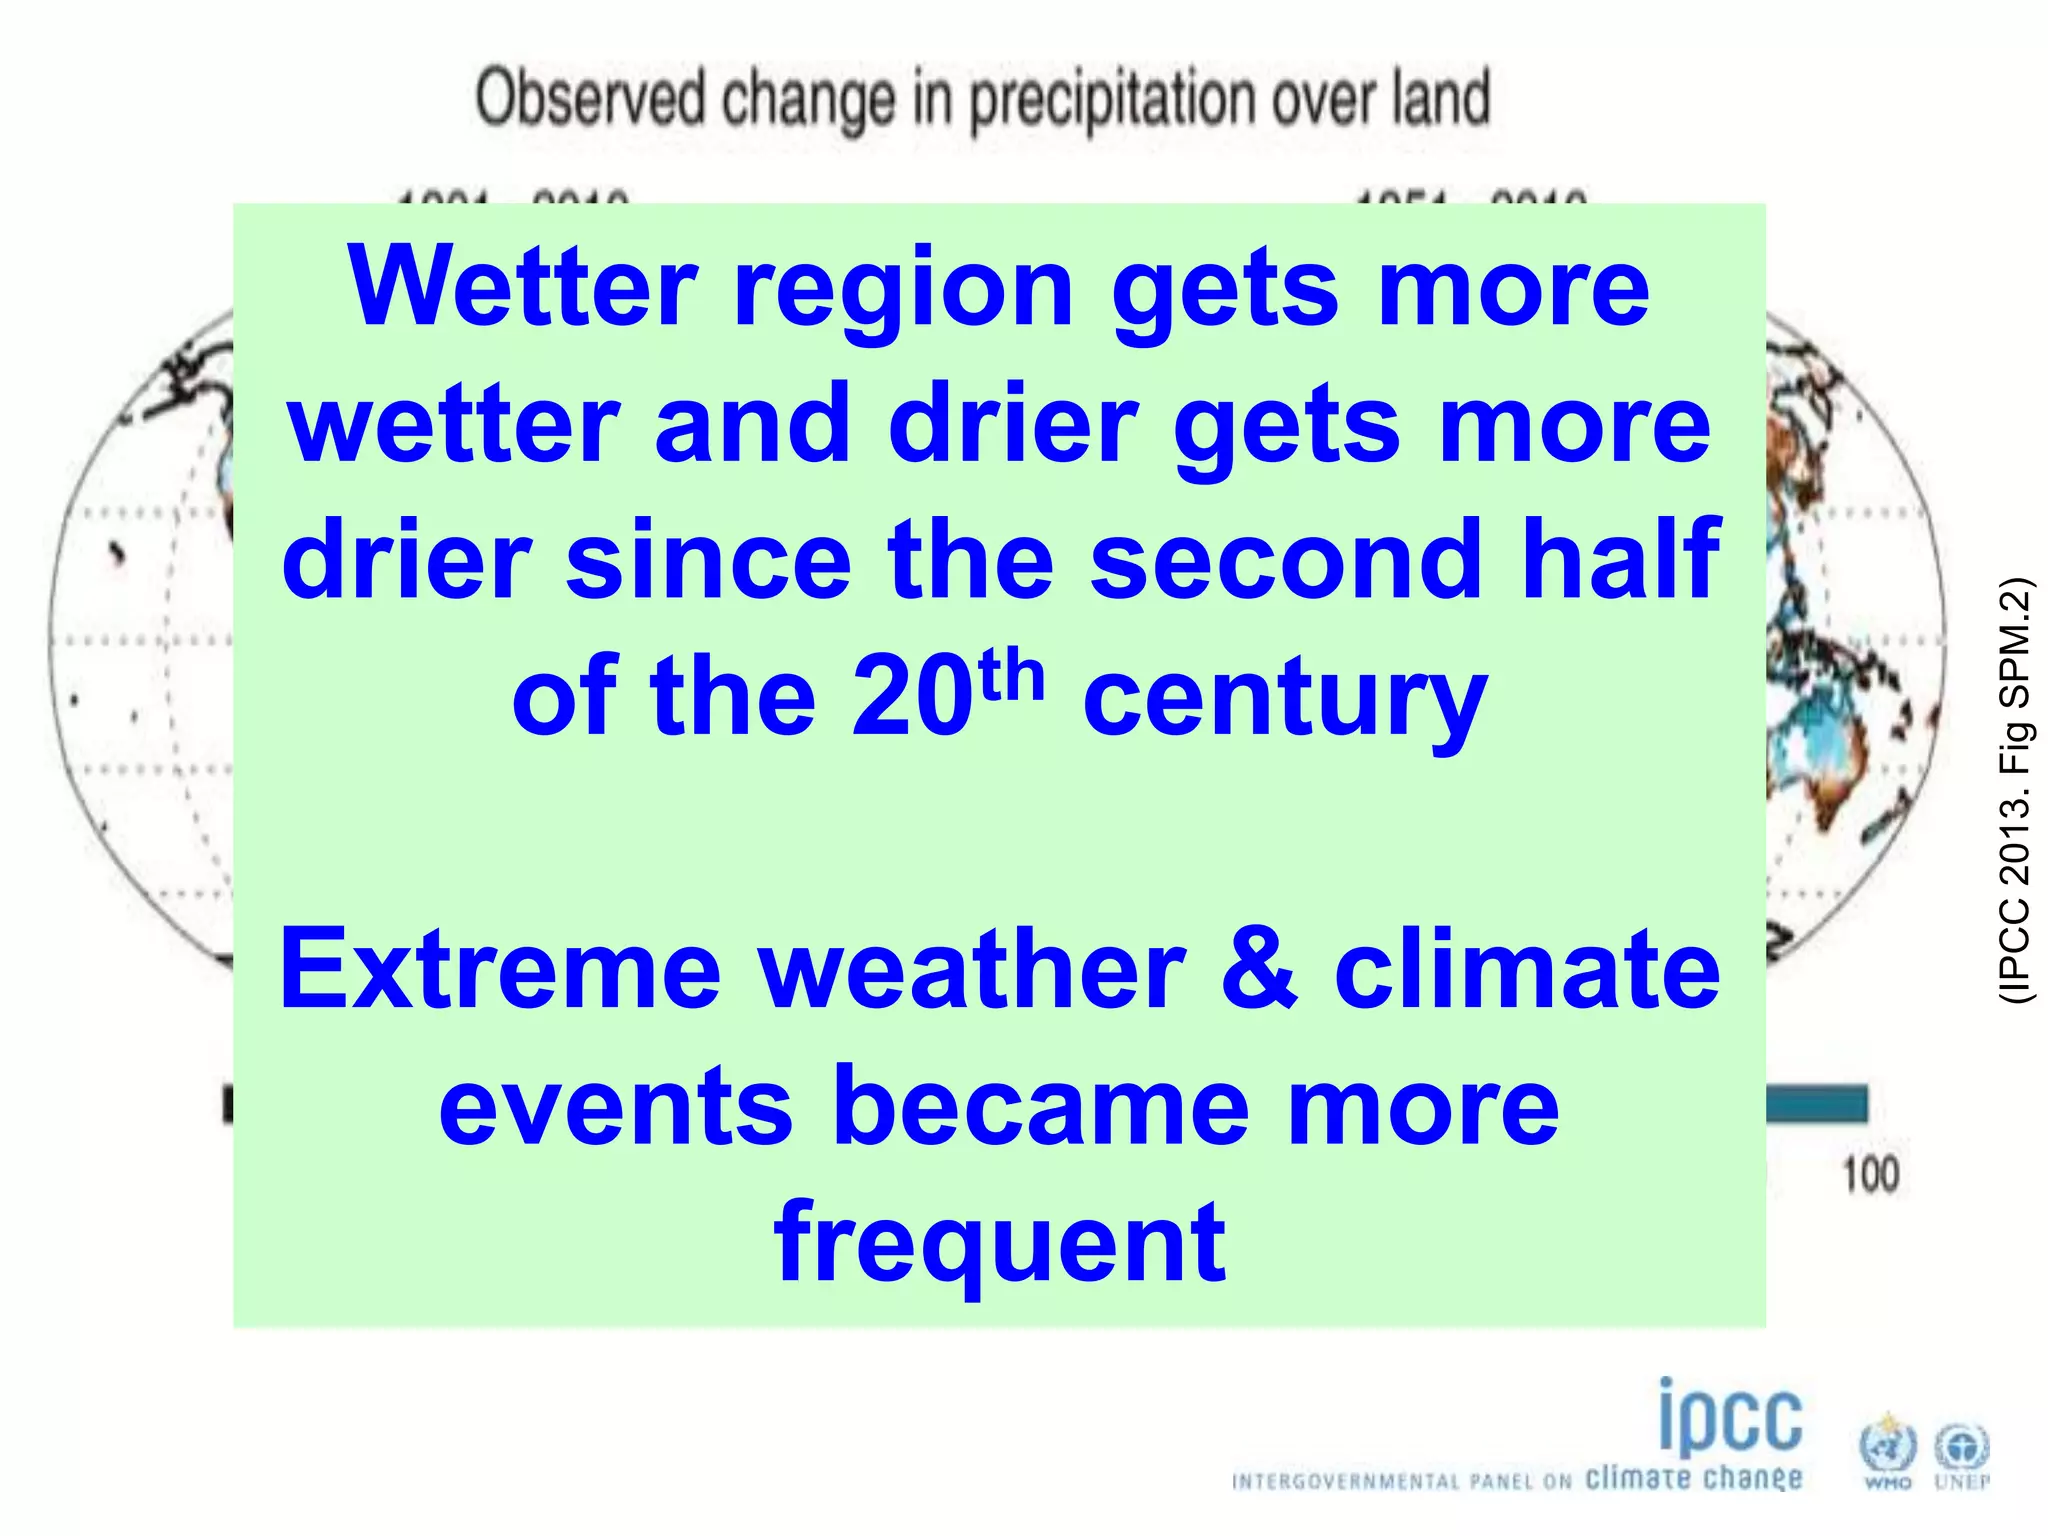
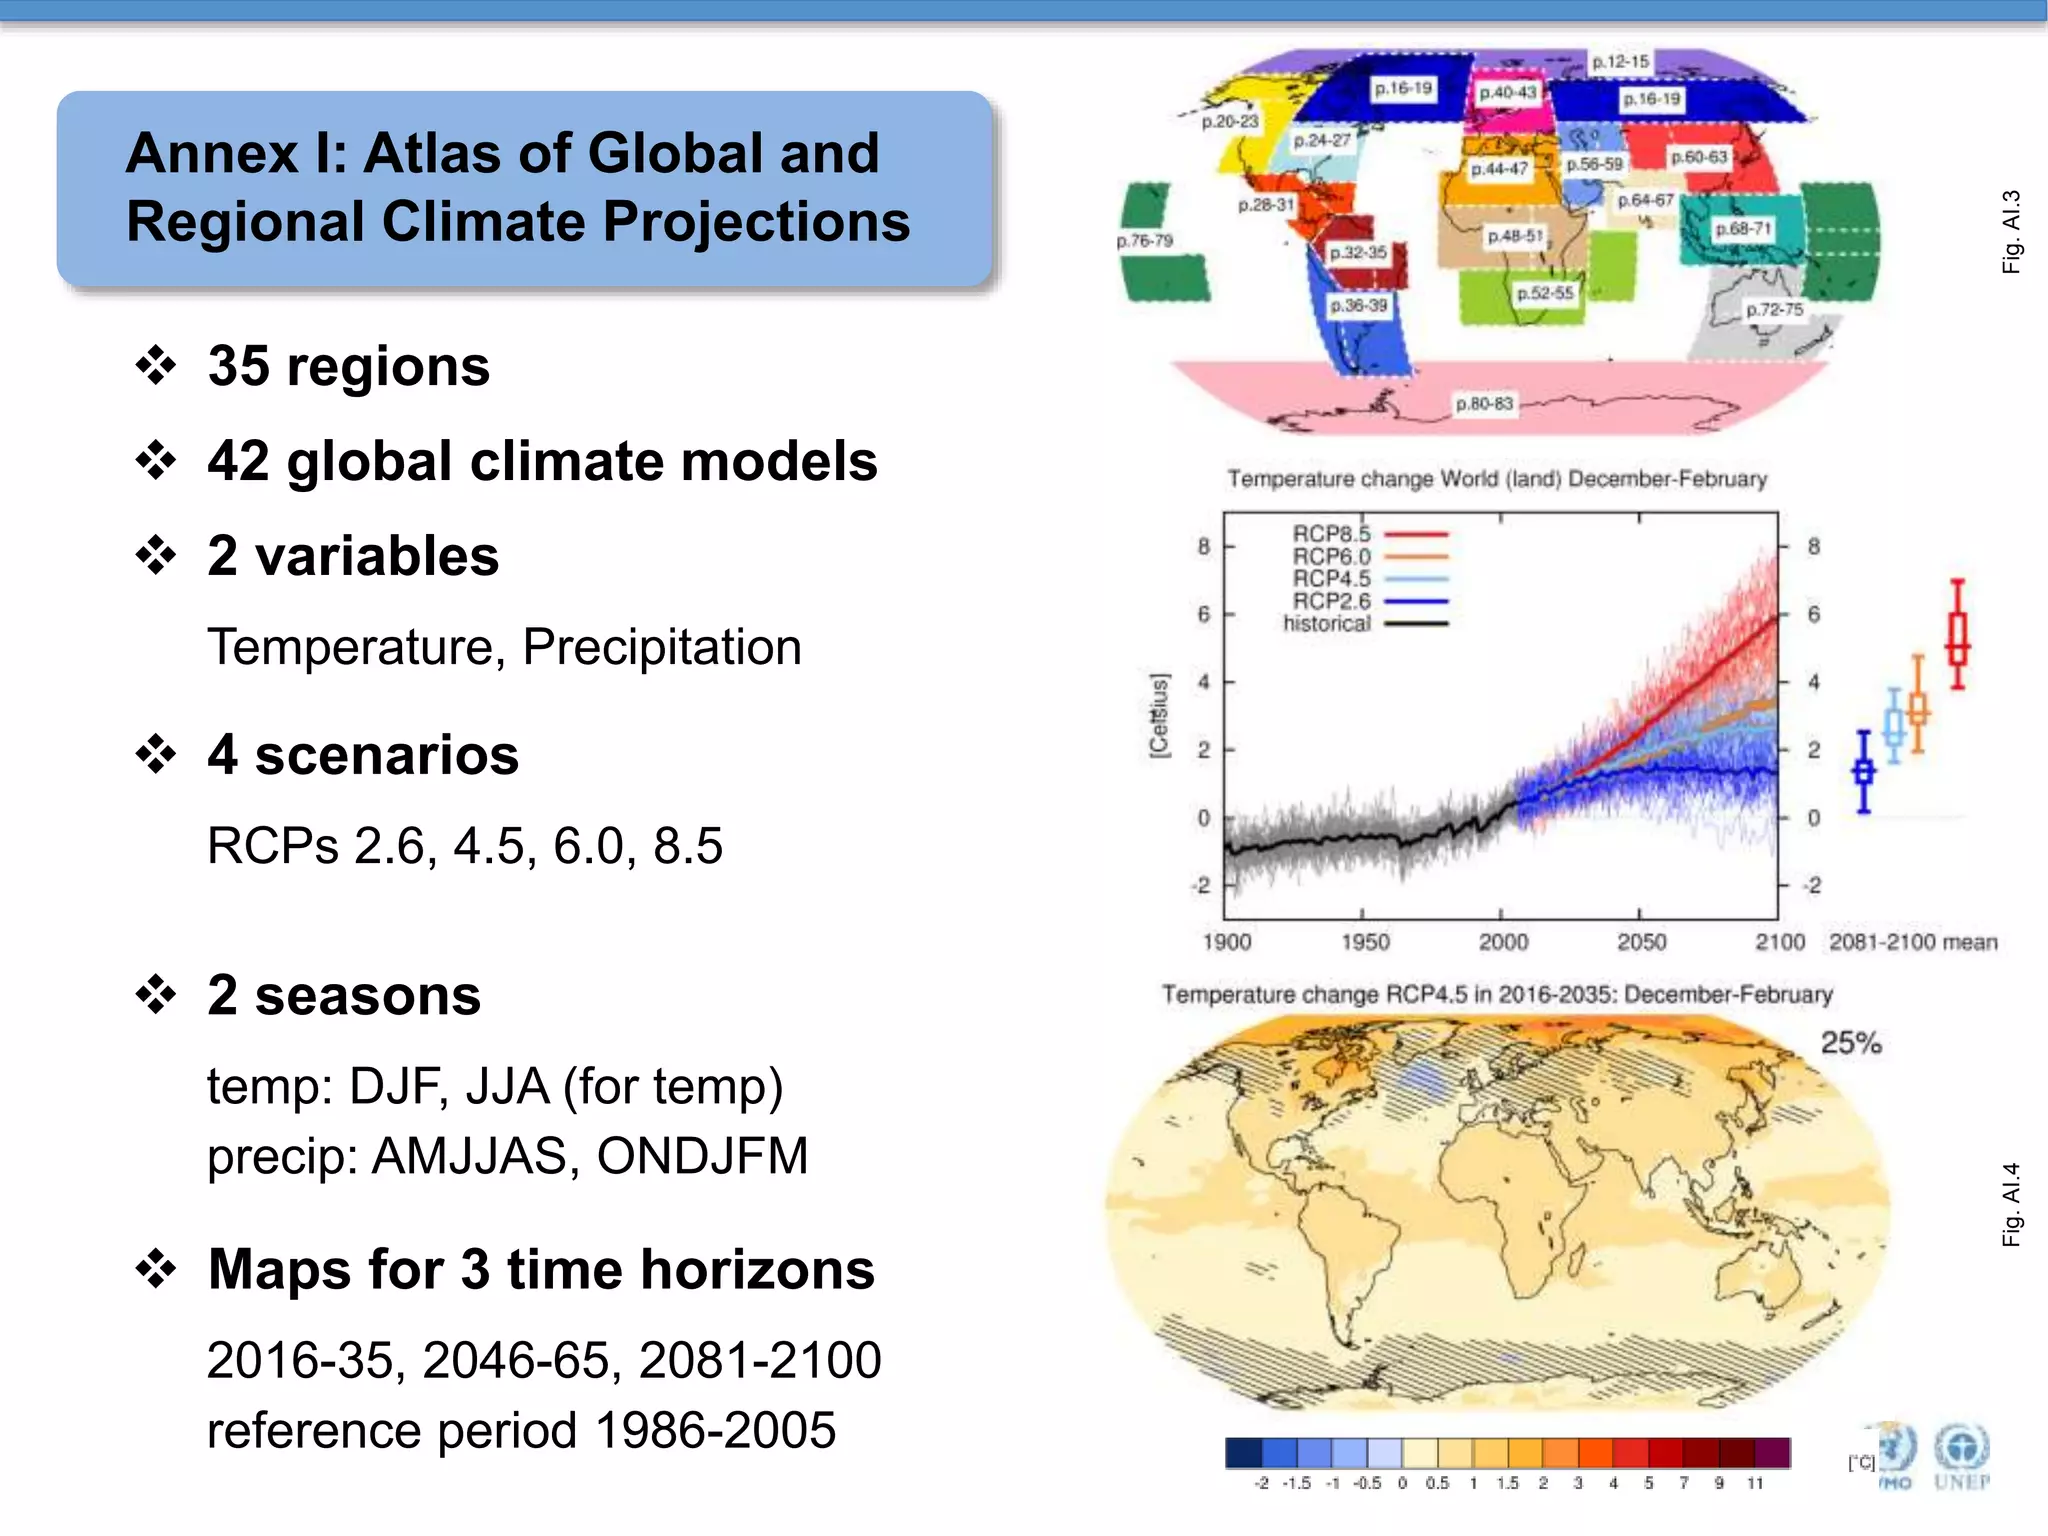
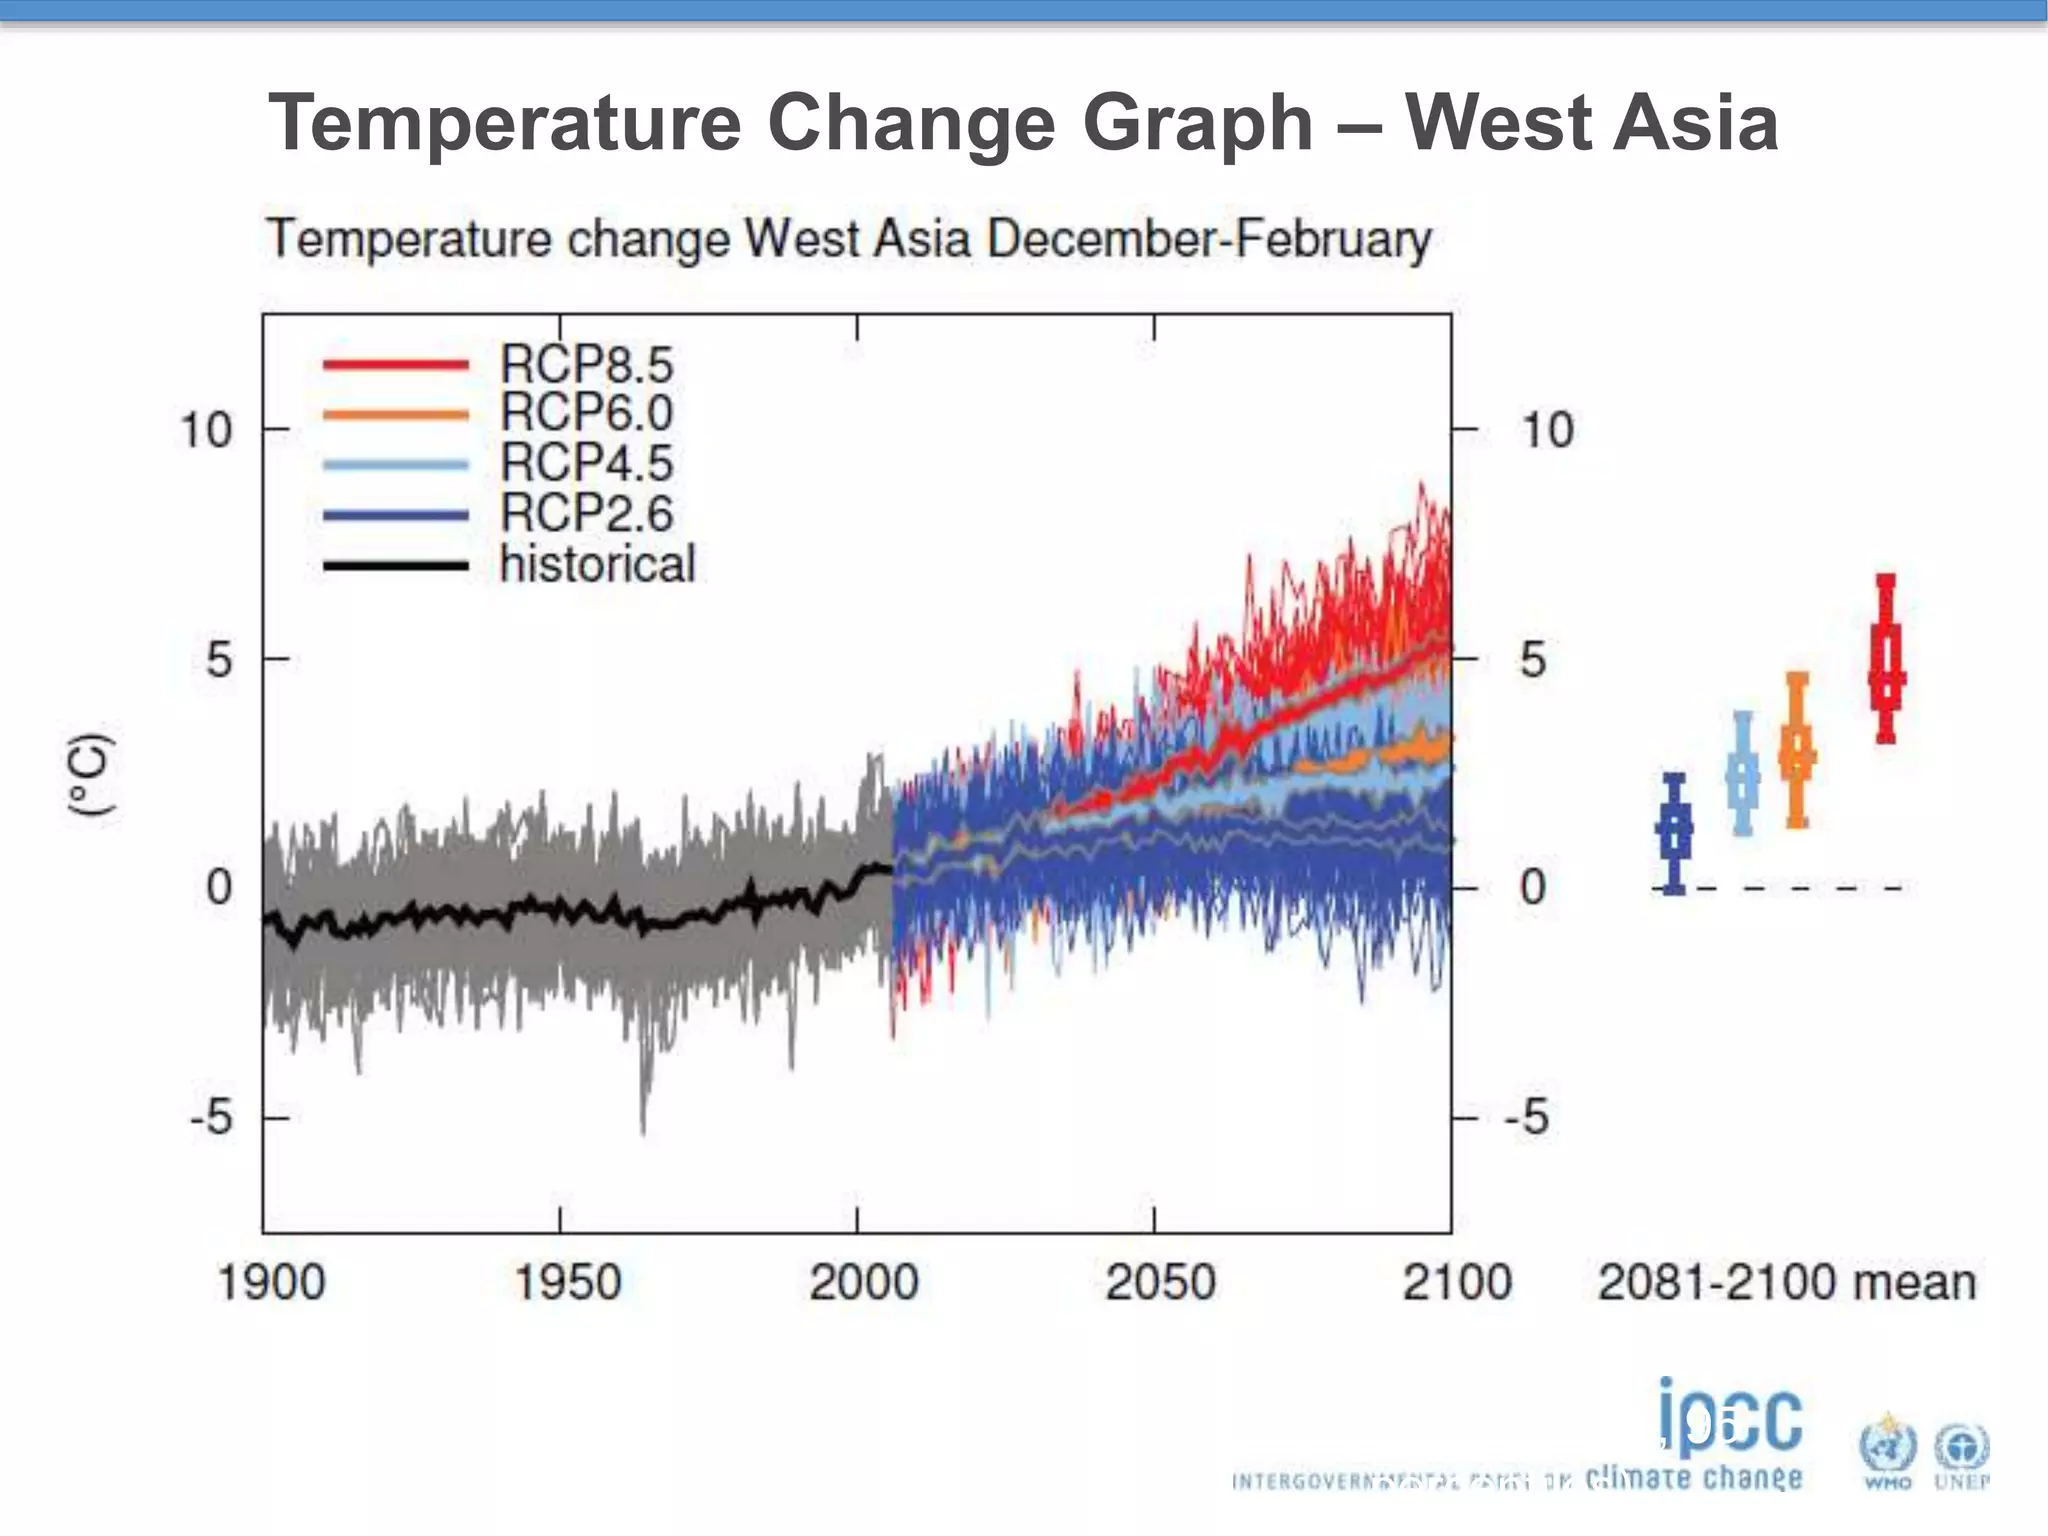
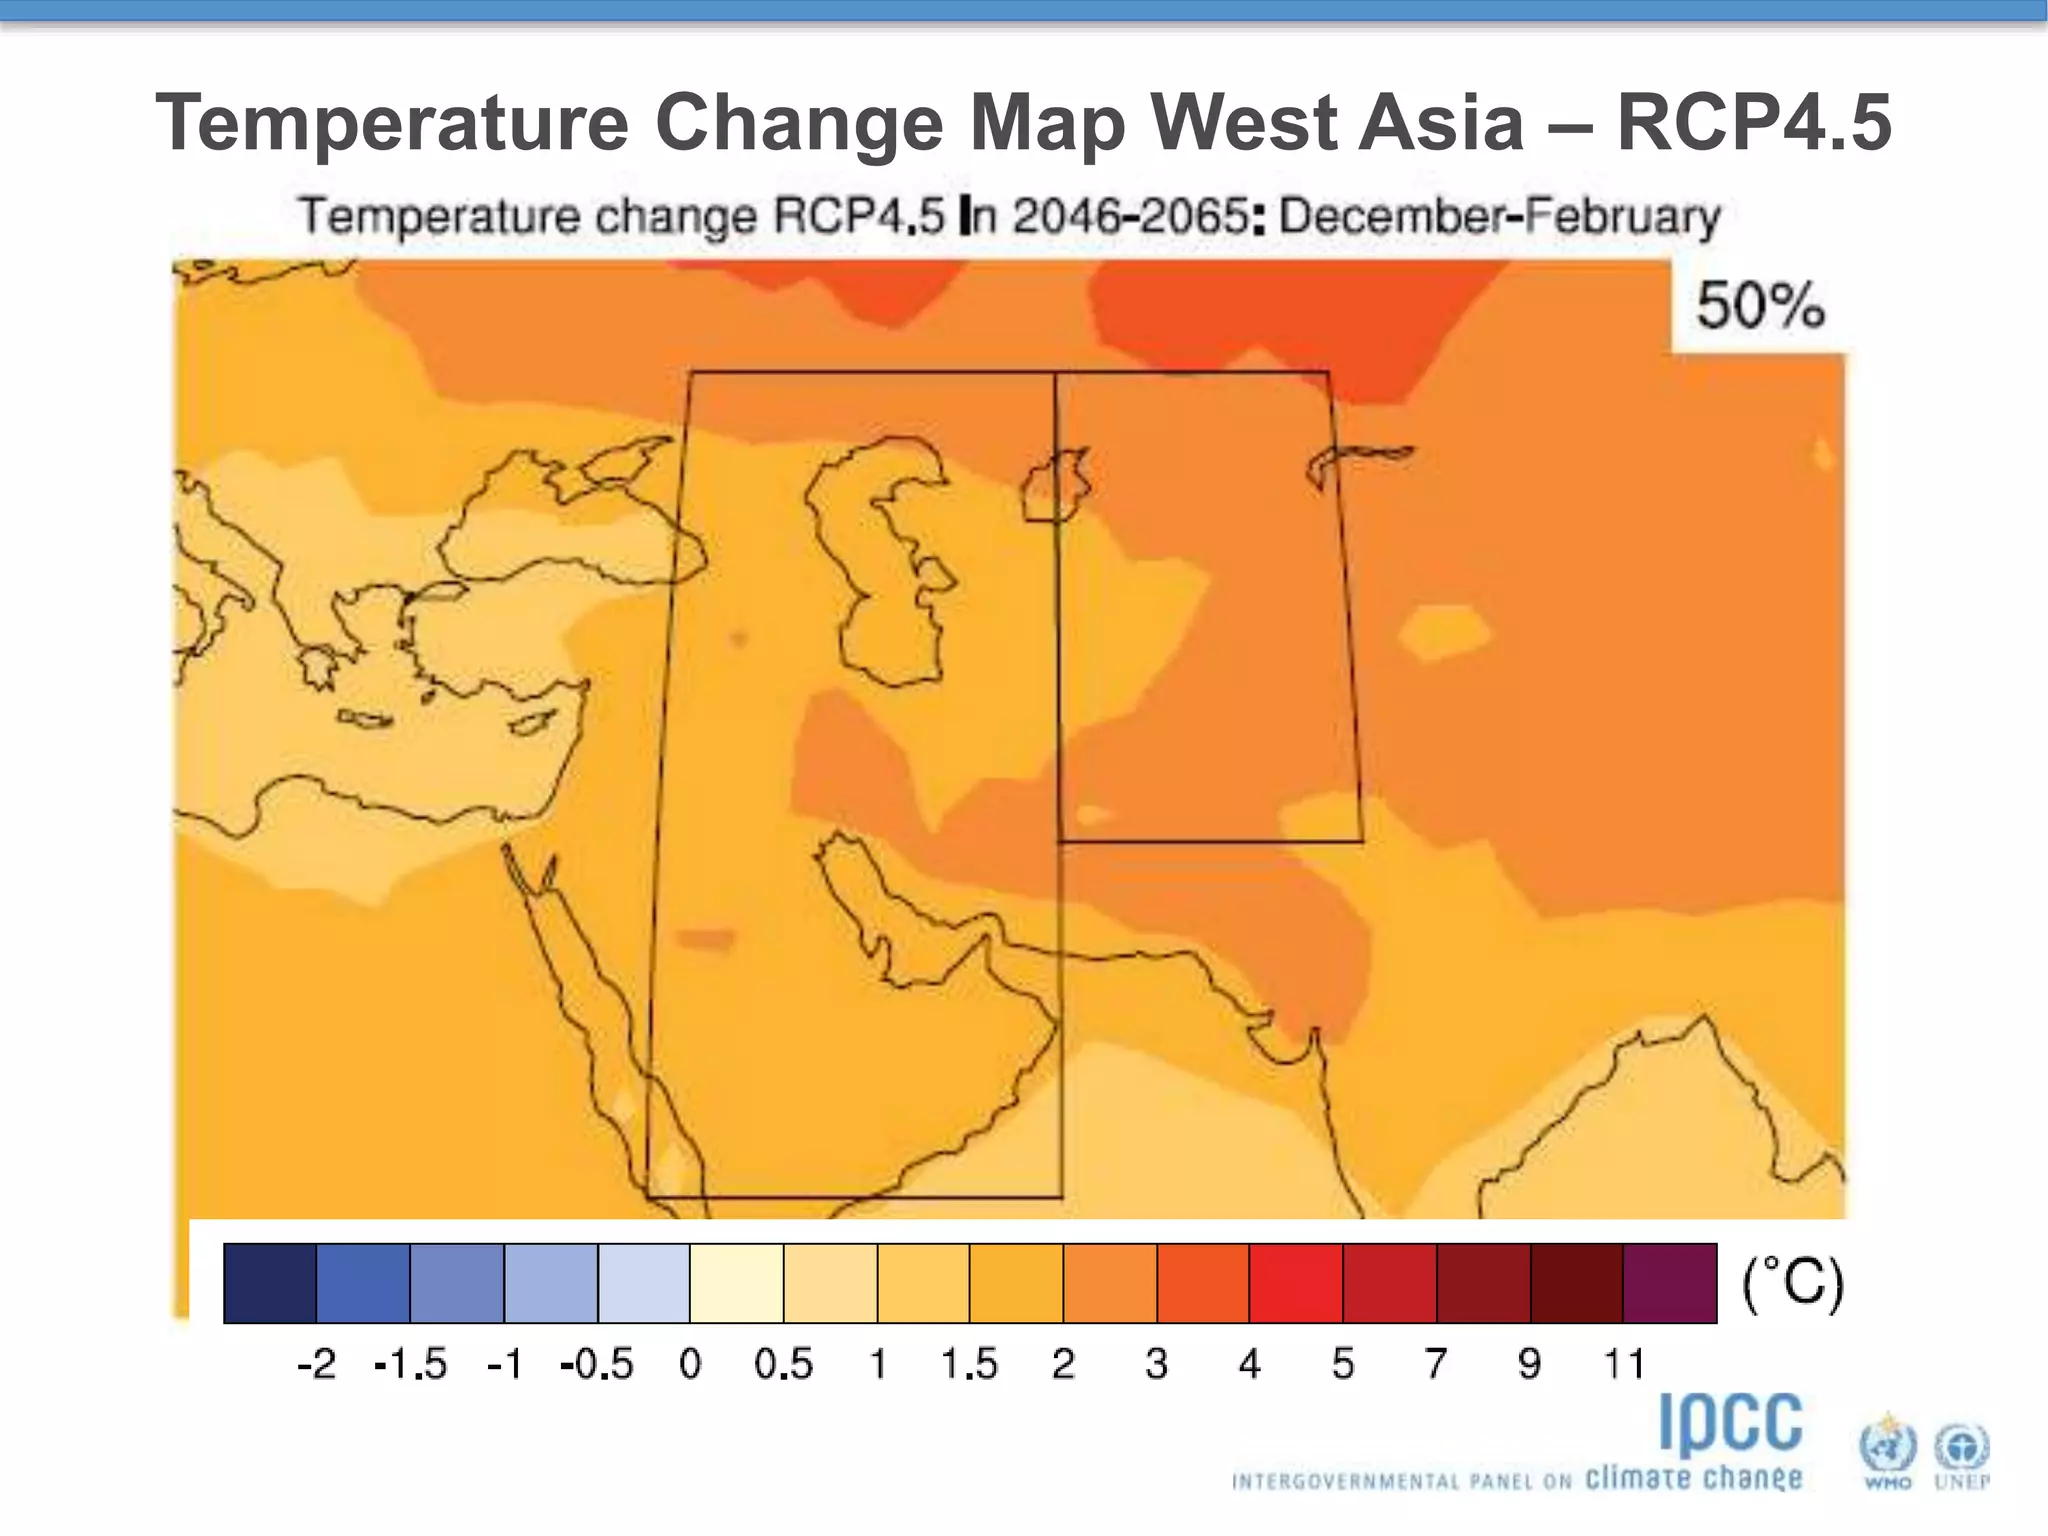
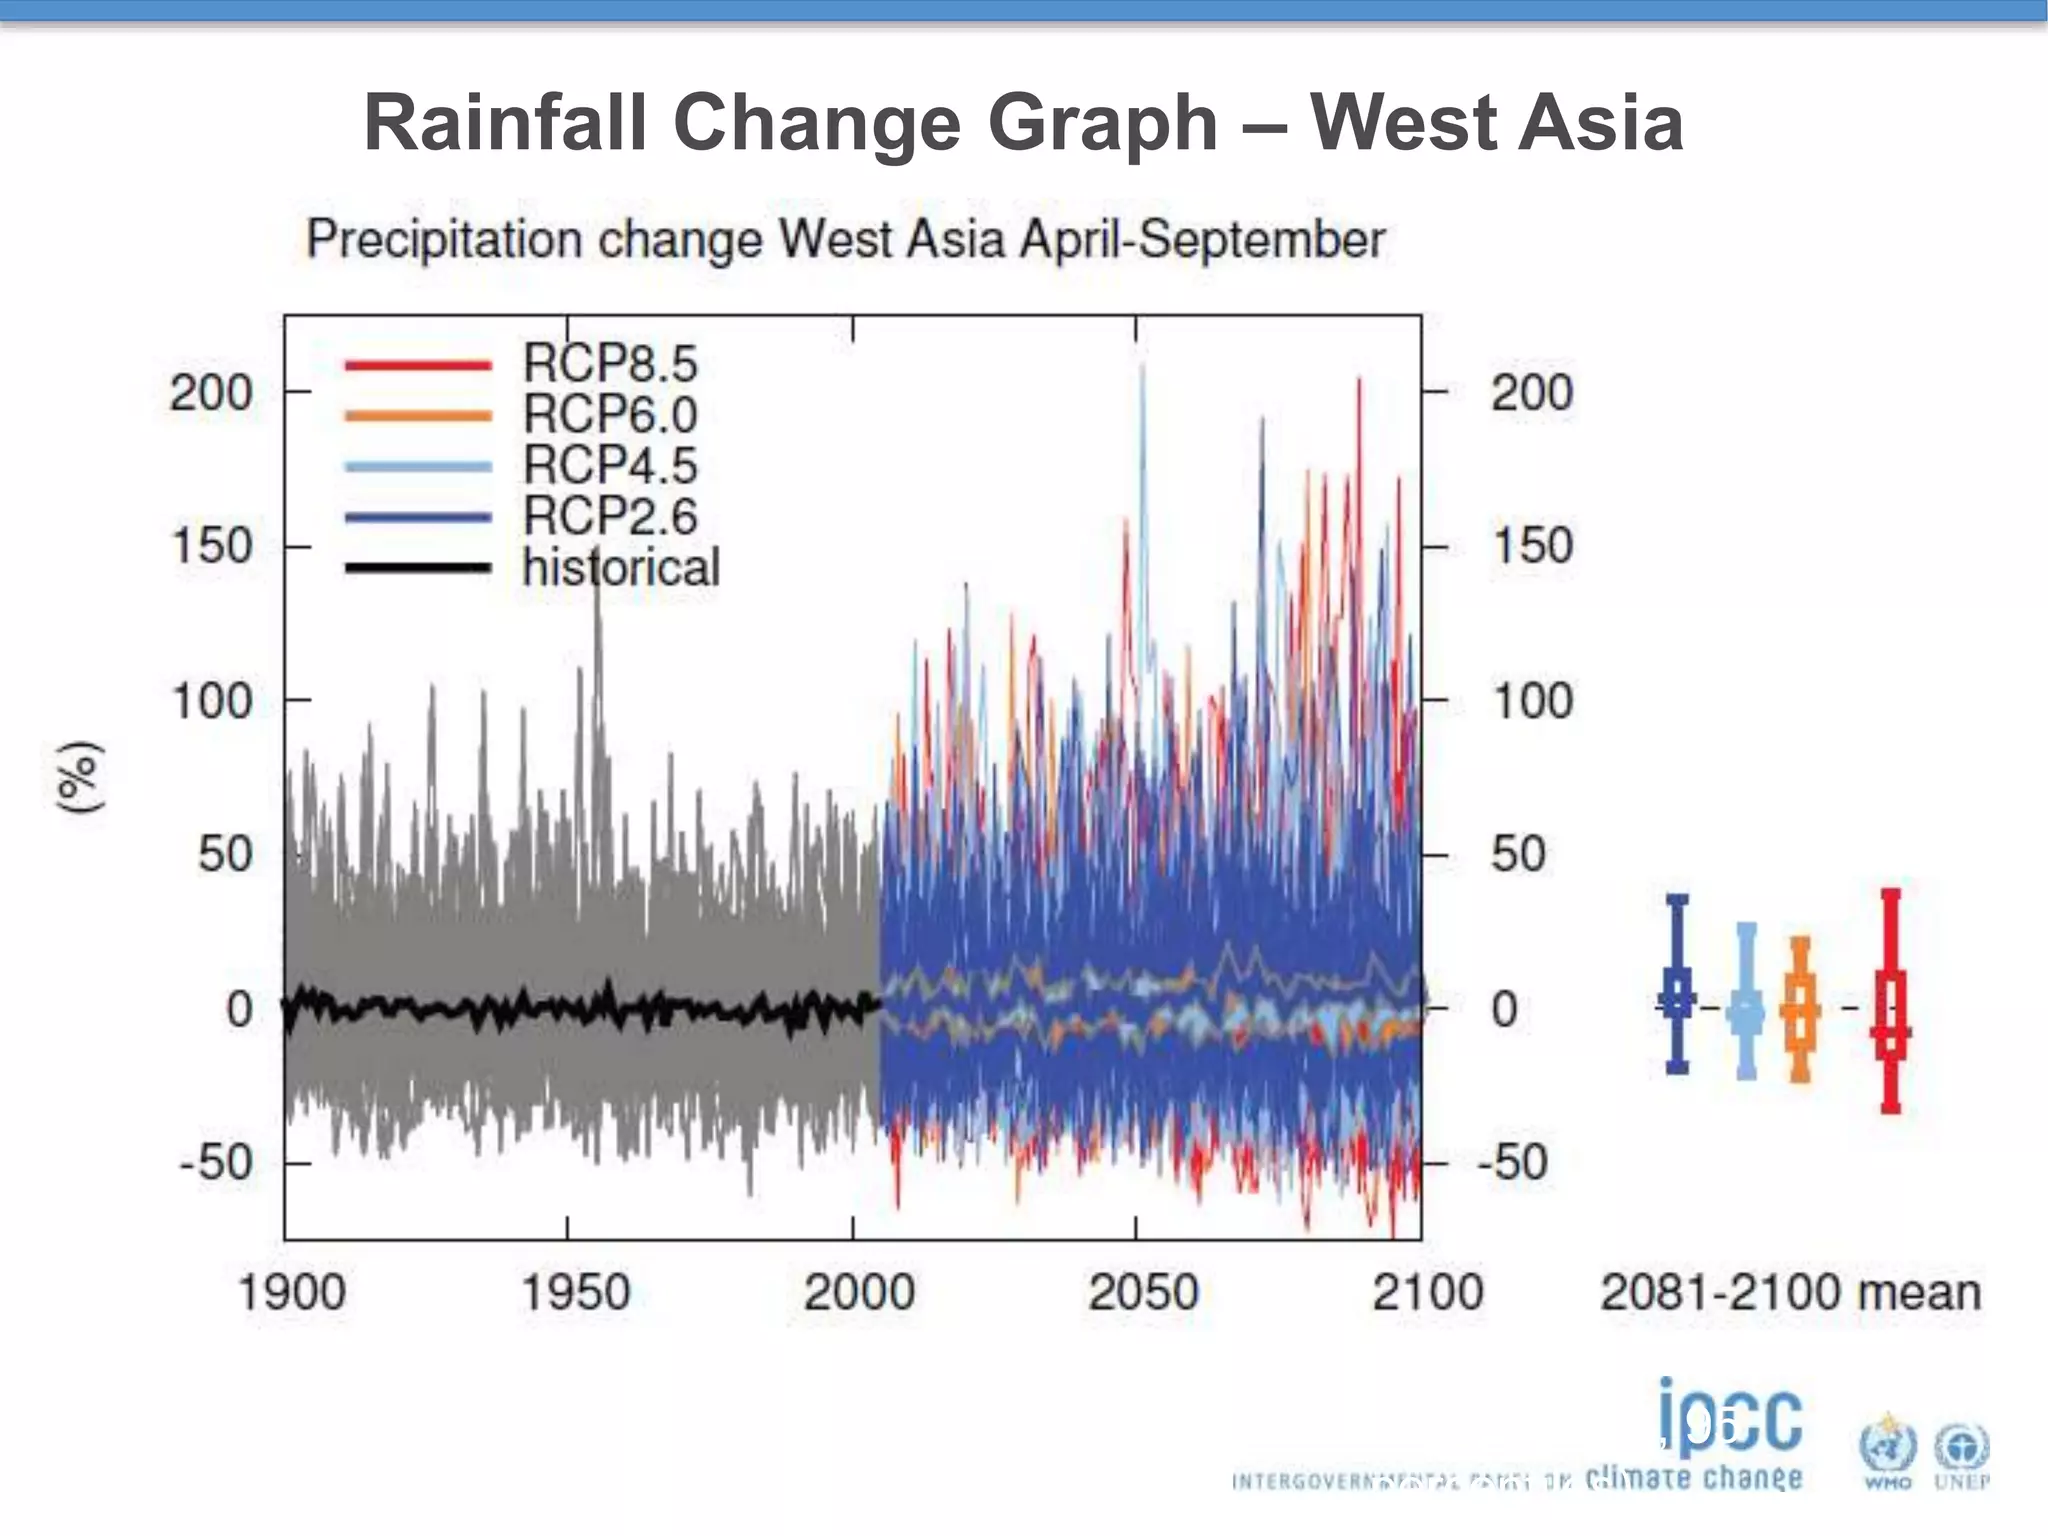
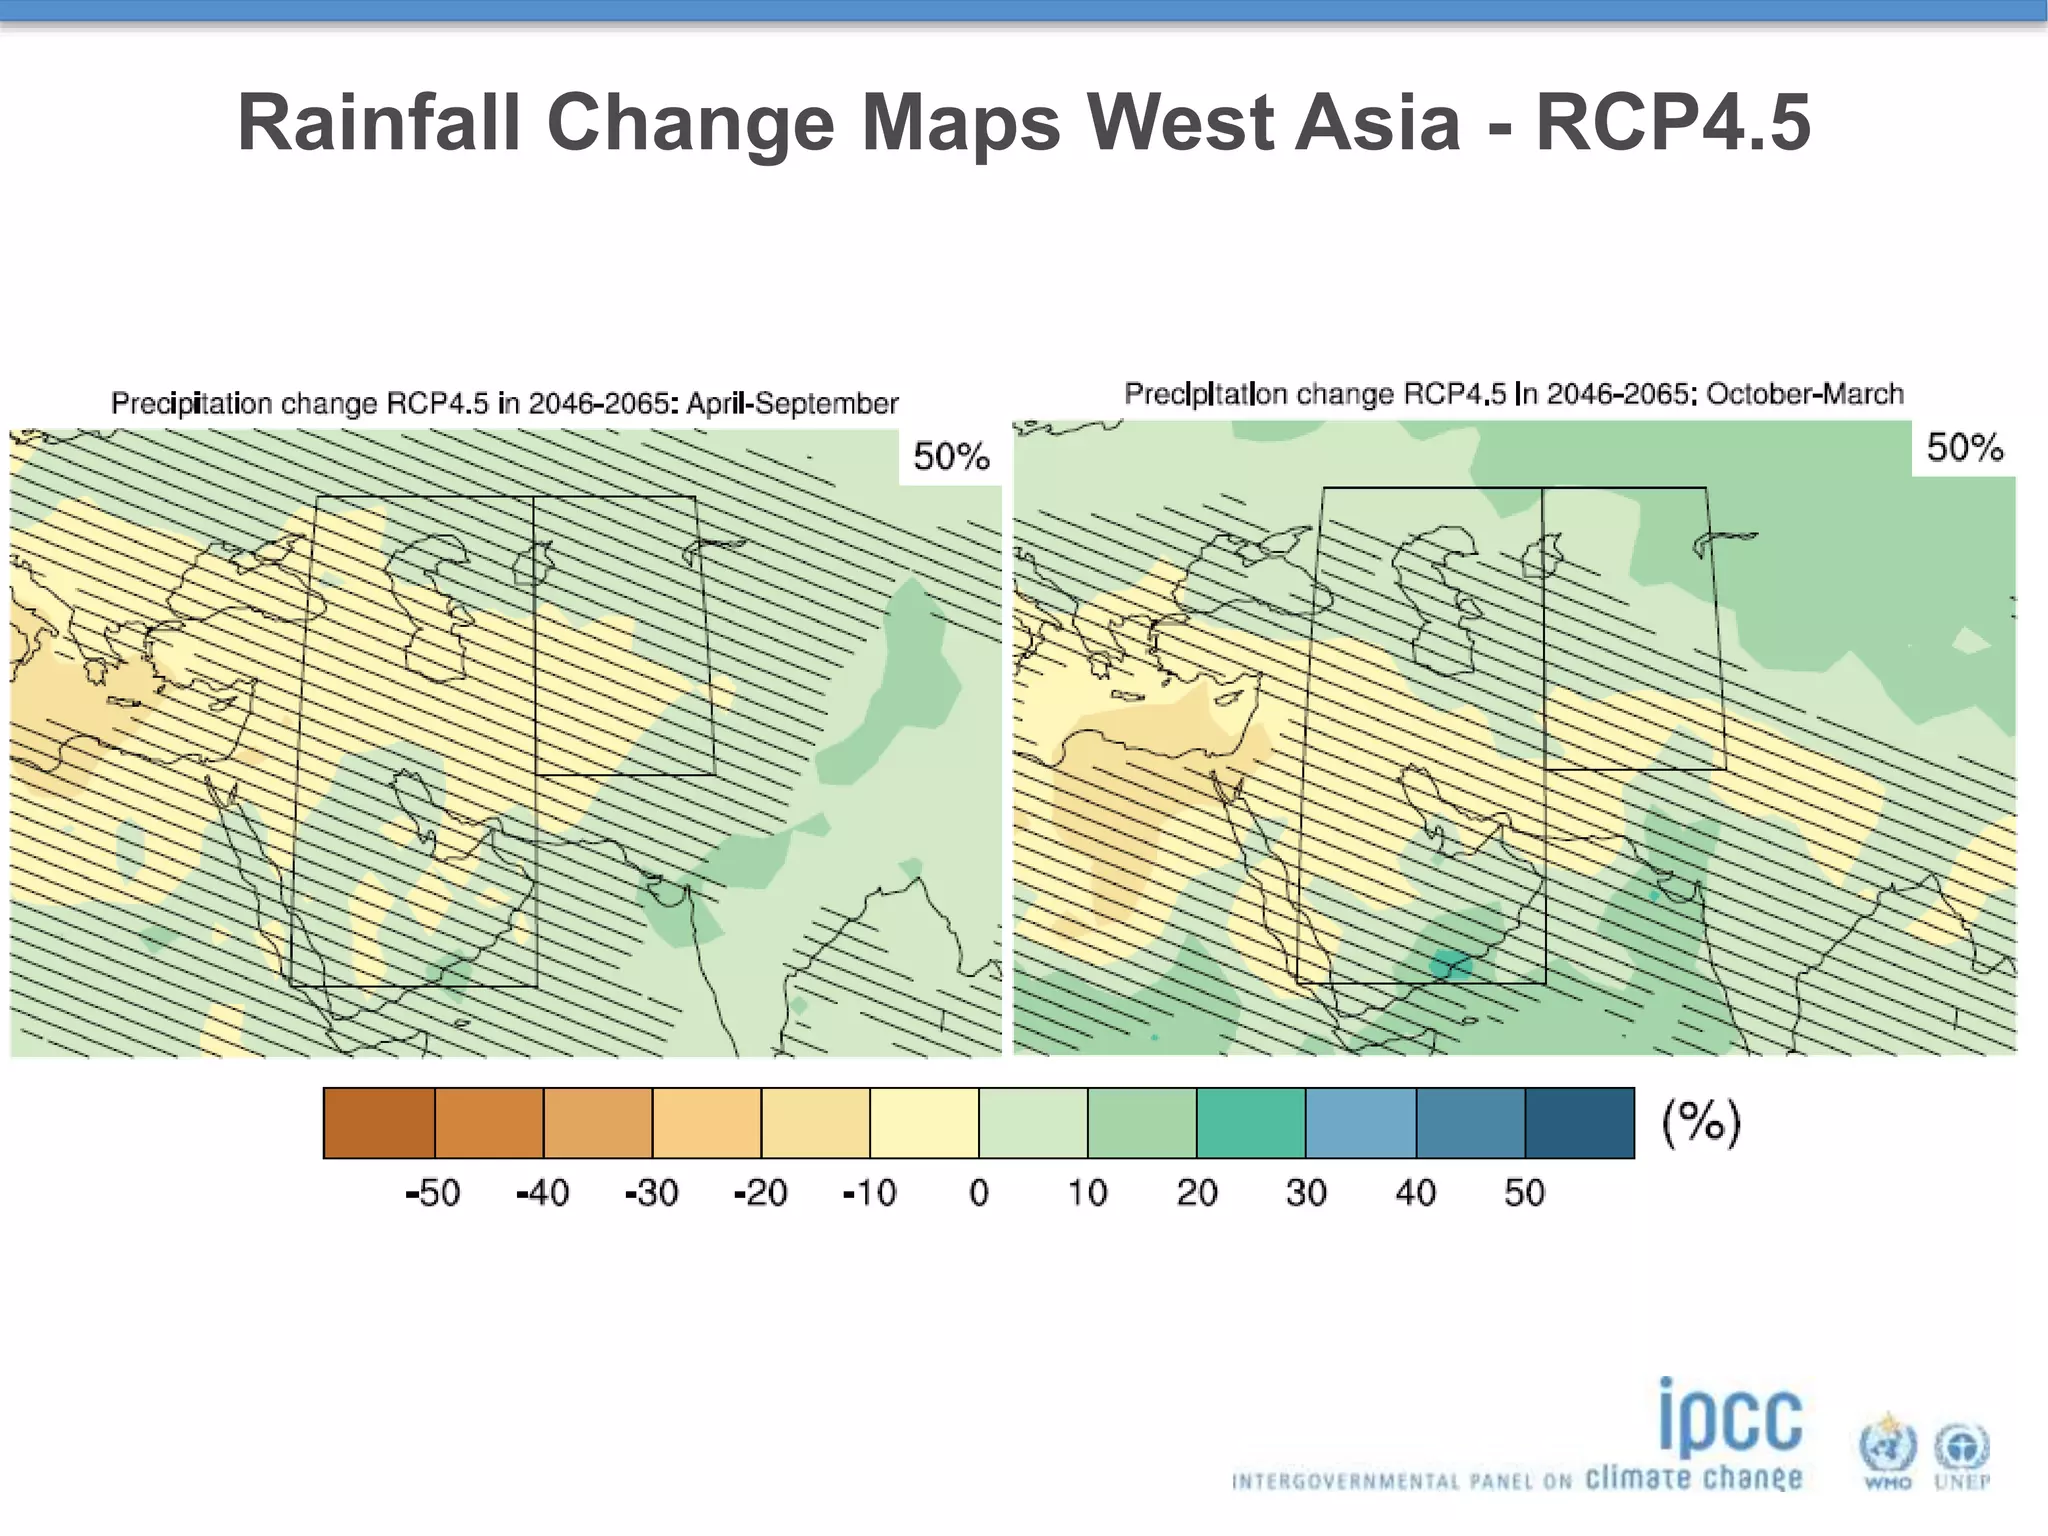
© Yann Arthus-Bertrand / Altitude
• Topic related to the Physical Science
Basis of Climate Change
Prof. Dr. Edvin Aldrian
IPCC Working Group I Vice Chair
Research Professor of Meteorology and Climatology
BPPT Indonesia
Outreach Event on the Activities And
Findings of the IPCC,
Tehran, Iran, 18 June 2018
Outline
•Global changes challanges
•Human influences on climate
•Attribution of climate change
•Global Climate parameter changes
•Regional changes of West Asia
3Rockström, et al. 2009. Planetary boundaries:exploring the safe operating space for
humanity. Ecology and Society 14(2): 32
Magnan et al., Nature Climate Change,
2016
Population, wealth and emission
The future of the
climate system (and
our survival) depends
on our ability to
decouple future
emissions from the
other two factors:
population and
economic growth
Raupach et al. (2007, PNAS)
Key SPM Messages
19 Headlines
on less than 2 Pages
6
2009: WGI Outline Approved
14 Chapters
Atlas of Regional Projections
54,677 Review Comments
by 1089 Experts
2010: 259 Authors Selected
Summary for Policymakers
~14,000 Words
Warming in the climate system
is unequivocal
Human influence on the
climate system is clear
Limiting climate change will require
substantial and sustained reductions
of greenhouse gas emissions
Fig.SPM.1b
Temperature Difference 1901 to 2012 based on trend (°C)
Fig.SPM.2
Precipitation Trend (mm/yr per decade)
© IPCC 2013© IPCC 2013
Warming of the climate system
is unequivocal
Fig. SPM.3
Warming of the climate system
is unequivocal
NASA GISS; Hawkins et al, BAMS, 2017
1900-1990 : 1,2 to 1,9 mm / year
1993-2016 : 3,1 ± 0.4 mm / year
LEGOS
Trend: + 0.18 ° C per decade
2015 and 2016:> 1 ° C above the
pre industrial level
The total radiative forcing is positive and has led to a net absorption of energy
by the climate system. The greatest contribution to this radiative forcing is due
to the increase in the atmospheric CO2 content since 1750
IPCC AR5 WG1, 2013
Human
Influence on
Atmospheric
Composition
Historical GHG Emission
Humans are changing the climate
Human Influence is Clear
Climate Models Responses to Various
Forcings
Natural CO2 forcing only
Human Influence is Clear
Natural + Anthropogenic
New greenhouse gas
emissions will imply
continued warming and
changes affecting all
components of the
climate system. Reducing
climate change will
require significant and
sustainable reductions in
greenhouse gas
emissions.
Schleussner et al (2016a, 2016b)
Regional reduction in median water availability for the
Mediterranean is found to nearly double from 9% to 17%
between 1.5◦C and 2◦C.
Projected lengthening of regional dry spells increases from 7
to 11%.
Implications of 1.5 and 2 ° global warming
Projecting Future Climate Requires GHG
Concentration Pathway
For future climate
projections, climate
models require
Emission Scenarios.
Models in AR5 use
Representative
Concentration Pathway
(RCP)
IPCC2013,Fig.SPM.8
2°C world
IPCC2013,Fig.SPM.8
Today we have a choice.
4.5°C world2°C world
IPCC AR5 Synthesis Report
The window for action is rapidly closing
65% of our carbon budget compatible with a 2°C goal already used
Amount Used
1870-2011:
515
GtC
Amount
Remaining:
275
GtC
Total Carbon
Budget:
790
GtC
CO2 emissions in 2013: 9.9 GtC
Limiting climate change will require
substantial and sustained reductions
of greenhouse gas emissions.
Temperature 
Ocean heat content 
Sea Level 
Snow Cover 
Glacier 
Arctic Sea-ice extent 
(IPCC2013.FigTS.1)
(IPCC2013.FigSPM.2)
Wetter region gets more
wetter and drier gets more
drier since the second half
of the 20th century
Extreme weather & climate
events became more
frequent
Tropical phenomena: Convergence Zones
Rainfall Change
(medium confidence)
“wet-get-wetter” over CZ regions “warmer-get-wetter” over oceans
Figure 14.8: Upper panel: Annual-mean precipitation percentage change (P/P in
green/gray shade and white contours at 20% intervals), and relative SST change
(colour contours at intervals of 0.2°C; negative shaded) to the tropical (20S–20N)
mean warming in RCP8.5 projections, shown as 23 CMIP5 model ensemble mean.
Figure 14.9: Seasonal cycle
of zonal-mean tropical
precipitation change (2081–
2100 in RCP8.5 minus
1986–2005) in CMIP5
multimodel ensemble mean.
Eighteen CMIP5 models
were used. Stippling
indicates that more than
90% models agree on the
sign of MME change. The
red curve represents the
meridional maximum of the
climatological rainfall.
Adapted from Huang et al.
(2013).
The seasonal-mean rainfall is projected to
increase on the ITCZ equatorward flank
More warming and rainfall at north of the
equator. Less zonal SST gradient across
the equatorial Pacific that contribute to
the weakened Walker cells.
Principles Governing IPCC Work (1998, 2003, 2006)
Annex I: Atlas of Global and
Regional Climate Projections
 Maps for 3 time horizons
2016-35, 2046-65, 2081-2100
reference period 1986-2005
Fig.AI.3Fig.AI.4
 35 regions
 42 global climate models
 2 variables
Temperature, Precipitation
 4 scenarios
RCPs 2.6, 4.5, 6.0, 8.5
 2 seasons
temp: DJF, JJA (for temp)
precip: AMJJAS, ONDJFM
Temperature Change Graph – West Asia
(5, 25, 50 75, 95
percentiles)
Temperature Change Map West Asia – RCP4.5
Rainfall Change Graph – West Asia
(5, 25, 50 75, 95
percentiles)
Rainfall Change Maps West Asia - RCP4.5
October - March April - September
Highlight message for Iran from Physical Science Basis
"Iran faces multiple challenges related to
climate change, including droughts, heat
waves, water shortage and impacts on food
production, However, adaptation and
mitigation strategies exist for reducing these
risks and creating opportunities for a
sustainable future”
@IPCCNews
IPCC_Climate_Change
http://www.slideshare.net/ipcc-
media/presentations
https://www.youtube.com/c/ipccgeneva
Find us on:
Website: http://ipcc.ch/
IPCC Secretariat: ipcc-sec@wmo.int
IPCC Press Office: ipcc-media@wmo.int
@IPCC_CH
https://www.linkedin.com/company/ipcc
https://www.flickr.com/photos/ipccphoto/sets/
https://vimeo.com/ipcc
THANK YOU FOR YOUR ATTENTION!
For more information:

Topic related to the Physical Science Basis of Climate Change

  • 1.
    © Yann Arthus-Bertrand/ Altitude • Topic related to the Physical Science Basis of Climate Change Prof. Dr. Edvin Aldrian IPCC Working Group I Vice Chair Research Professor of Meteorology and Climatology BPPT Indonesia Outreach Event on the Activities And Findings of the IPCC, Tehran, Iran, 18 June 2018
  • 2.
    Outline •Global changes challanges •Humaninfluences on climate •Attribution of climate change •Global Climate parameter changes •Regional changes of West Asia
  • 3.
    3Rockström, et al.2009. Planetary boundaries:exploring the safe operating space for humanity. Ecology and Society 14(2): 32
  • 4.
    Magnan et al.,Nature Climate Change, 2016
  • 5.
    Population, wealth andemission The future of the climate system (and our survival) depends on our ability to decouple future emissions from the other two factors: population and economic growth Raupach et al. (2007, PNAS)
  • 6.
    Key SPM Messages 19Headlines on less than 2 Pages 6 2009: WGI Outline Approved 14 Chapters Atlas of Regional Projections 54,677 Review Comments by 1089 Experts 2010: 259 Authors Selected Summary for Policymakers ~14,000 Words
  • 7.
    Warming in theclimate system is unequivocal Human influence on the climate system is clear Limiting climate change will require substantial and sustained reductions of greenhouse gas emissions
  • 8.
    Fig.SPM.1b Temperature Difference 1901to 2012 based on trend (°C) Fig.SPM.2 Precipitation Trend (mm/yr per decade) © IPCC 2013© IPCC 2013 Warming of the climate system is unequivocal
  • 9.
    Fig. SPM.3 Warming ofthe climate system is unequivocal
  • 10.
    NASA GISS; Hawkinset al, BAMS, 2017 1900-1990 : 1,2 to 1,9 mm / year 1993-2016 : 3,1 ± 0.4 mm / year LEGOS Trend: + 0.18 ° C per decade 2015 and 2016:> 1 ° C above the pre industrial level
  • 11.
    The total radiativeforcing is positive and has led to a net absorption of energy by the climate system. The greatest contribution to this radiative forcing is due to the increase in the atmospheric CO2 content since 1750 IPCC AR5 WG1, 2013 Human Influence on Atmospheric Composition Historical GHG Emission
  • 12.
    Humans are changingthe climate Human Influence is Clear
  • 13.
    Climate Models Responsesto Various Forcings Natural CO2 forcing only Human Influence is Clear Natural + Anthropogenic
  • 15.
    New greenhouse gas emissionswill imply continued warming and changes affecting all components of the climate system. Reducing climate change will require significant and sustainable reductions in greenhouse gas emissions.
  • 16.
    Schleussner et al(2016a, 2016b) Regional reduction in median water availability for the Mediterranean is found to nearly double from 9% to 17% between 1.5◦C and 2◦C. Projected lengthening of regional dry spells increases from 7 to 11%. Implications of 1.5 and 2 ° global warming
  • 17.
    Projecting Future ClimateRequires GHG Concentration Pathway For future climate projections, climate models require Emission Scenarios. Models in AR5 use Representative Concentration Pathway (RCP)
  • 18.
  • 19.
    IPCC2013,Fig.SPM.8 Today we havea choice. 4.5°C world2°C world
  • 20.
    IPCC AR5 SynthesisReport The window for action is rapidly closing 65% of our carbon budget compatible with a 2°C goal already used Amount Used 1870-2011: 515 GtC Amount Remaining: 275 GtC Total Carbon Budget: 790 GtC CO2 emissions in 2013: 9.9 GtC Limiting climate change will require substantial and sustained reductions of greenhouse gas emissions.
  • 21.
    Temperature  Ocean heatcontent  Sea Level  Snow Cover  Glacier  Arctic Sea-ice extent  (IPCC2013.FigTS.1)
  • 22.
    (IPCC2013.FigSPM.2) Wetter region getsmore wetter and drier gets more drier since the second half of the 20th century Extreme weather & climate events became more frequent
  • 23.
    Tropical phenomena: ConvergenceZones Rainfall Change (medium confidence) “wet-get-wetter” over CZ regions “warmer-get-wetter” over oceans Figure 14.8: Upper panel: Annual-mean precipitation percentage change (P/P in green/gray shade and white contours at 20% intervals), and relative SST change (colour contours at intervals of 0.2°C; negative shaded) to the tropical (20S–20N) mean warming in RCP8.5 projections, shown as 23 CMIP5 model ensemble mean. Figure 14.9: Seasonal cycle of zonal-mean tropical precipitation change (2081– 2100 in RCP8.5 minus 1986–2005) in CMIP5 multimodel ensemble mean. Eighteen CMIP5 models were used. Stippling indicates that more than 90% models agree on the sign of MME change. The red curve represents the meridional maximum of the climatological rainfall. Adapted from Huang et al. (2013). The seasonal-mean rainfall is projected to increase on the ITCZ equatorward flank More warming and rainfall at north of the equator. Less zonal SST gradient across the equatorial Pacific that contribute to the weakened Walker cells.
  • 24.
    Principles Governing IPCCWork (1998, 2003, 2006) Annex I: Atlas of Global and Regional Climate Projections  Maps for 3 time horizons 2016-35, 2046-65, 2081-2100 reference period 1986-2005 Fig.AI.3Fig.AI.4  35 regions  42 global climate models  2 variables Temperature, Precipitation  4 scenarios RCPs 2.6, 4.5, 6.0, 8.5  2 seasons temp: DJF, JJA (for temp) precip: AMJJAS, ONDJFM
  • 25.
    Temperature Change Graph– West Asia (5, 25, 50 75, 95 percentiles)
  • 26.
    Temperature Change MapWest Asia – RCP4.5
  • 27.
    Rainfall Change Graph– West Asia (5, 25, 50 75, 95 percentiles)
  • 28.
    Rainfall Change MapsWest Asia - RCP4.5 October - March April - September
  • 29.
    Highlight message forIran from Physical Science Basis "Iran faces multiple challenges related to climate change, including droughts, heat waves, water shortage and impacts on food production, However, adaptation and mitigation strategies exist for reducing these risks and creating opportunities for a sustainable future”
  • 30.
    @IPCCNews IPCC_Climate_Change http://www.slideshare.net/ipcc- media/presentations https://www.youtube.com/c/ipccgeneva Find us on: Website:http://ipcc.ch/ IPCC Secretariat: ipcc-sec@wmo.int IPCC Press Office: ipcc-media@wmo.int @IPCC_CH https://www.linkedin.com/company/ipcc https://www.flickr.com/photos/ipccphoto/sets/ https://vimeo.com/ipcc THANK YOU FOR YOUR ATTENTION! For more information: