Download as PDF, PPTX
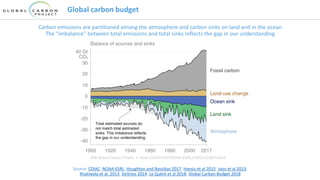
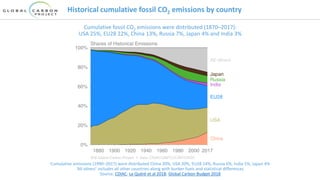
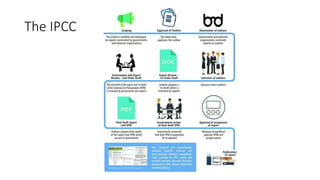
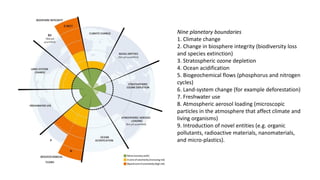
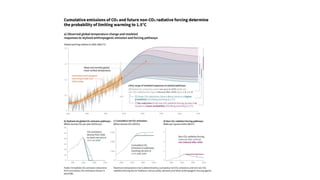
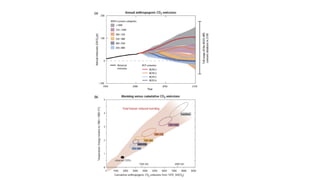
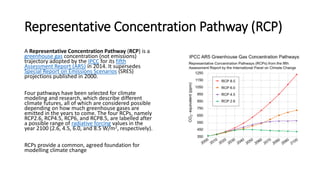
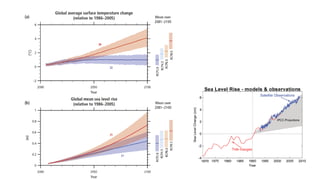
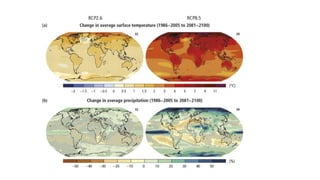
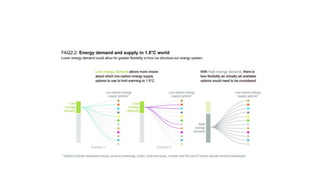
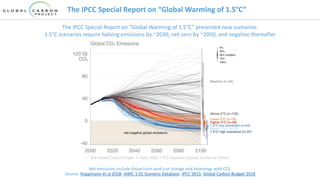
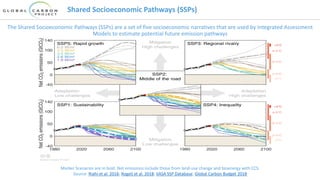
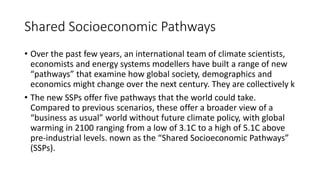
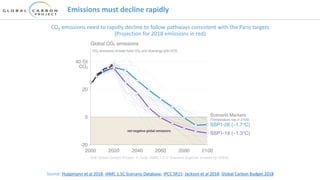

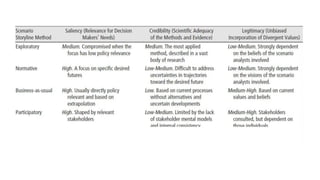
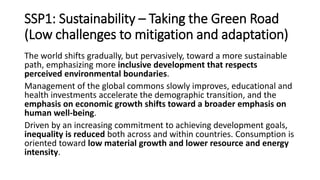
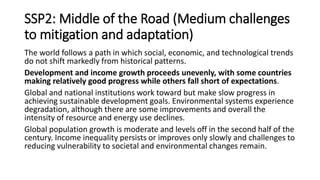
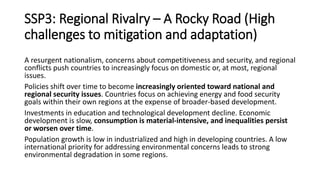
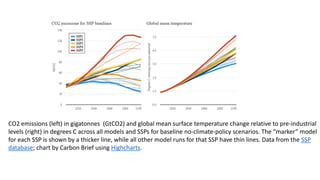


This document provides an overview of climate change concepts including: - Global carbon budgets that track emissions partitioning between the atmosphere and carbon sinks. The imbalance reflects uncertainties. - Historical cumulative fossil CO2 emissions have been led by developed nations like the US, EU, China, and Russia. - The IPCC outlines climate change risks and impacts, as well as the need to limit warming to 1.5°C to avoid worst effects. - Scenarios like RCPs and SSPs are used to model potential future pathways based on different levels of emissions and socioeconomic conditions.


![Hdr 20072008 Presentation[1]](https://cdn.slidesharecdn.com/ss_thumbnails/HDR20072008presentation1-123602819722-phpapp02-thumbnail.jpg?width=640&height=640&fit=bounds)


