Download to read offline
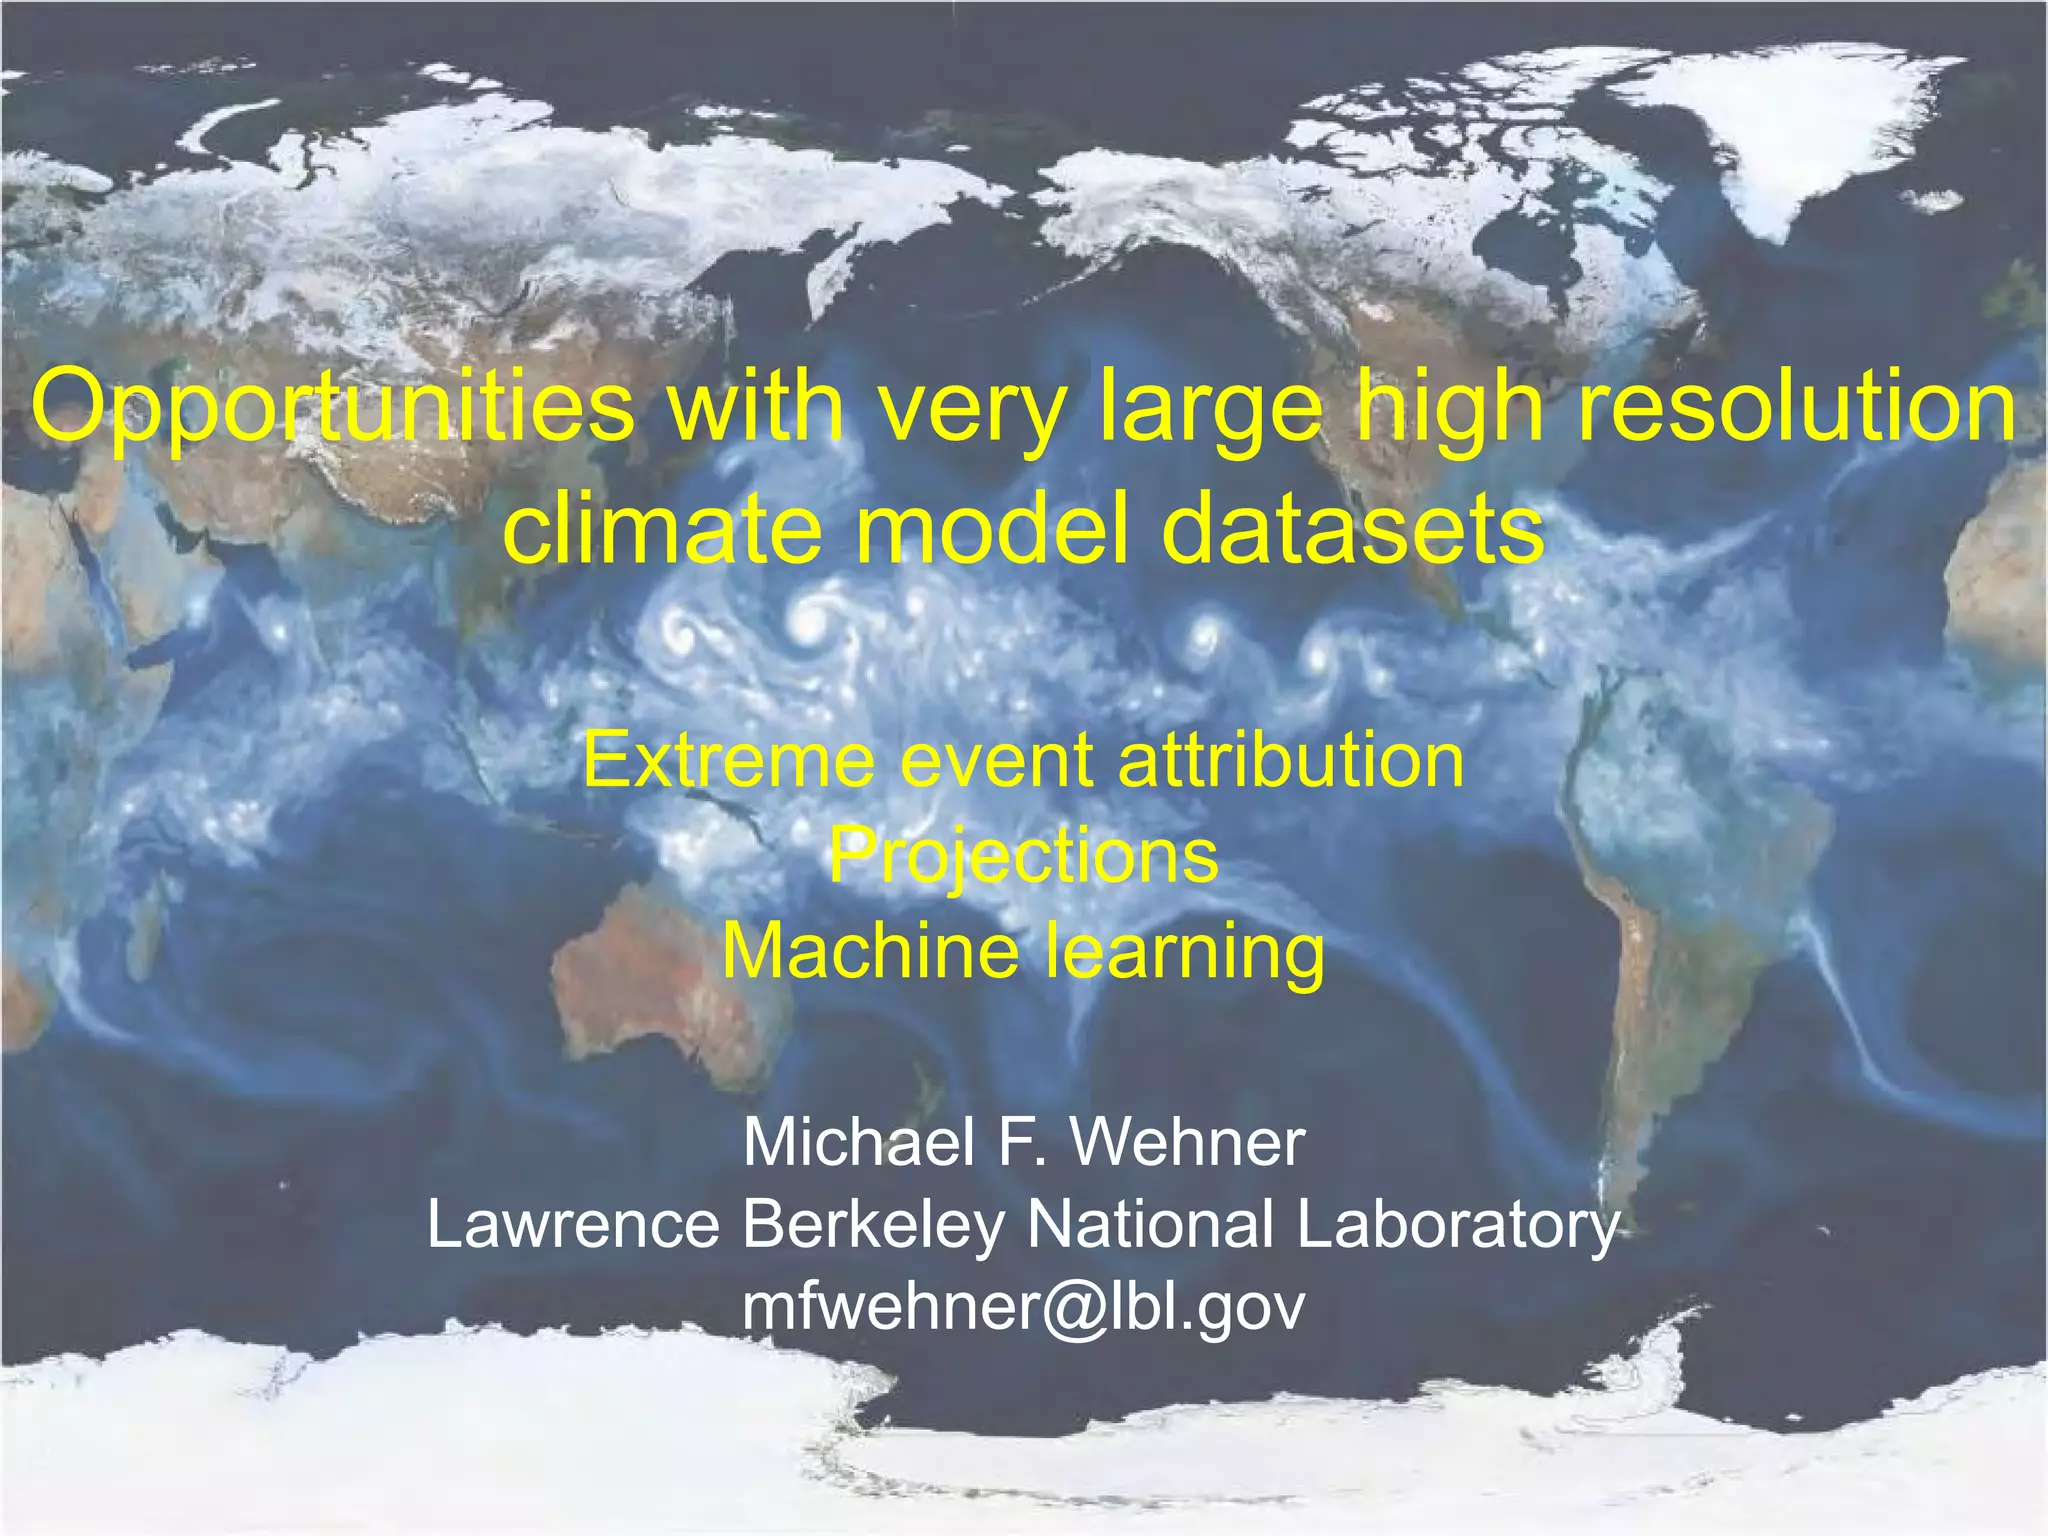


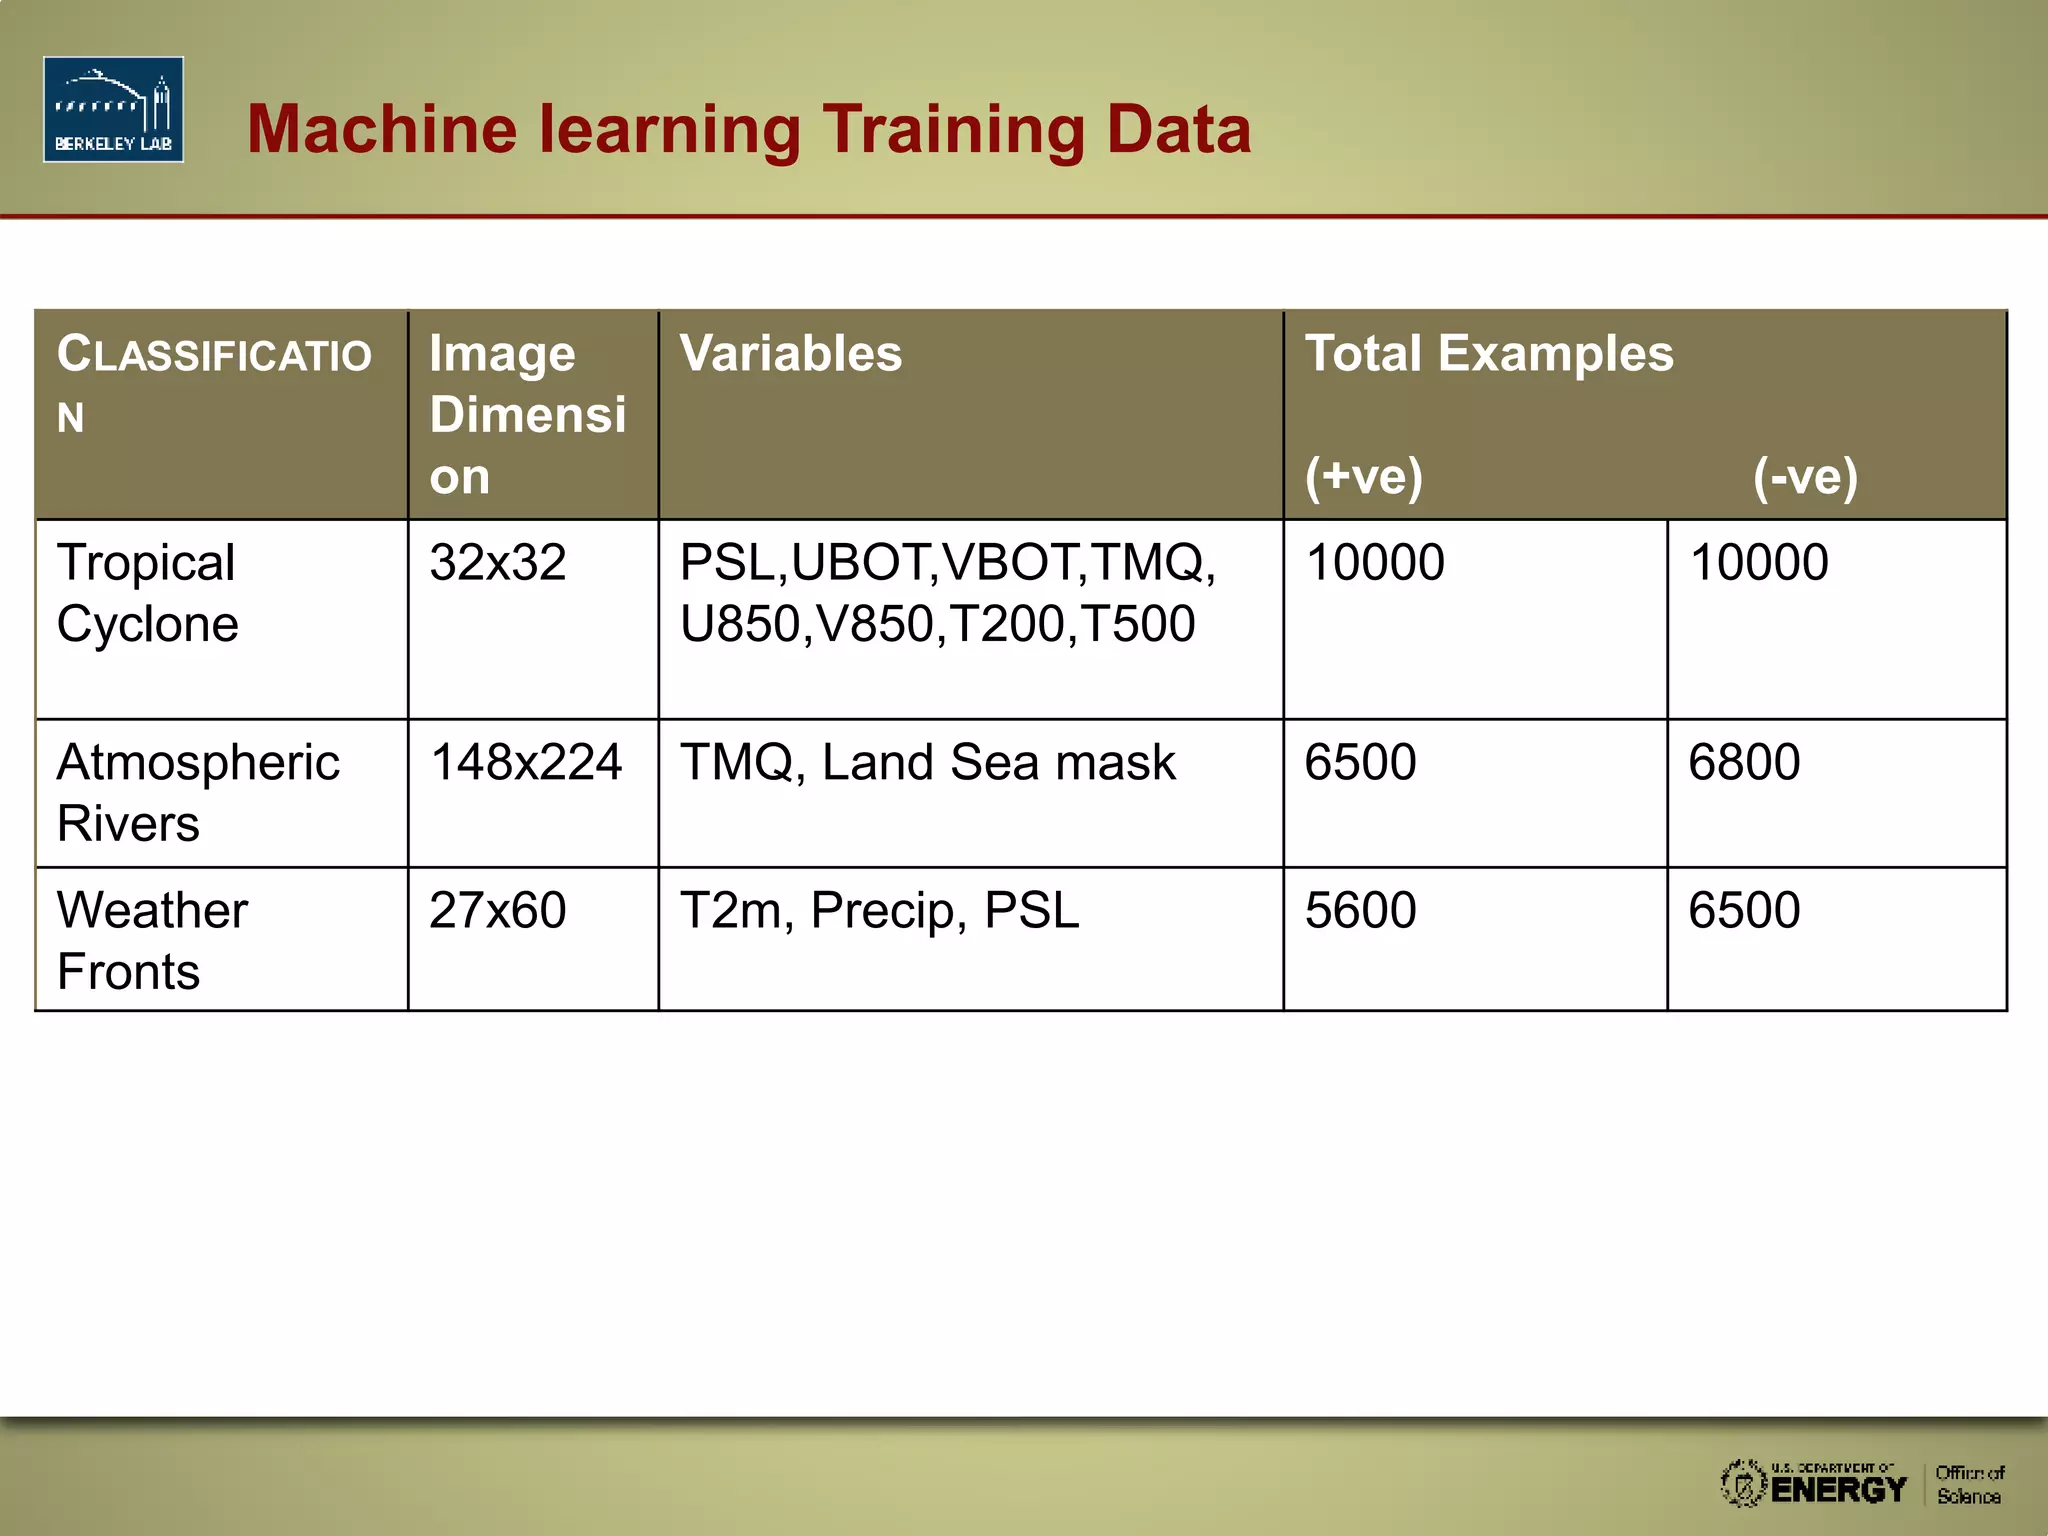
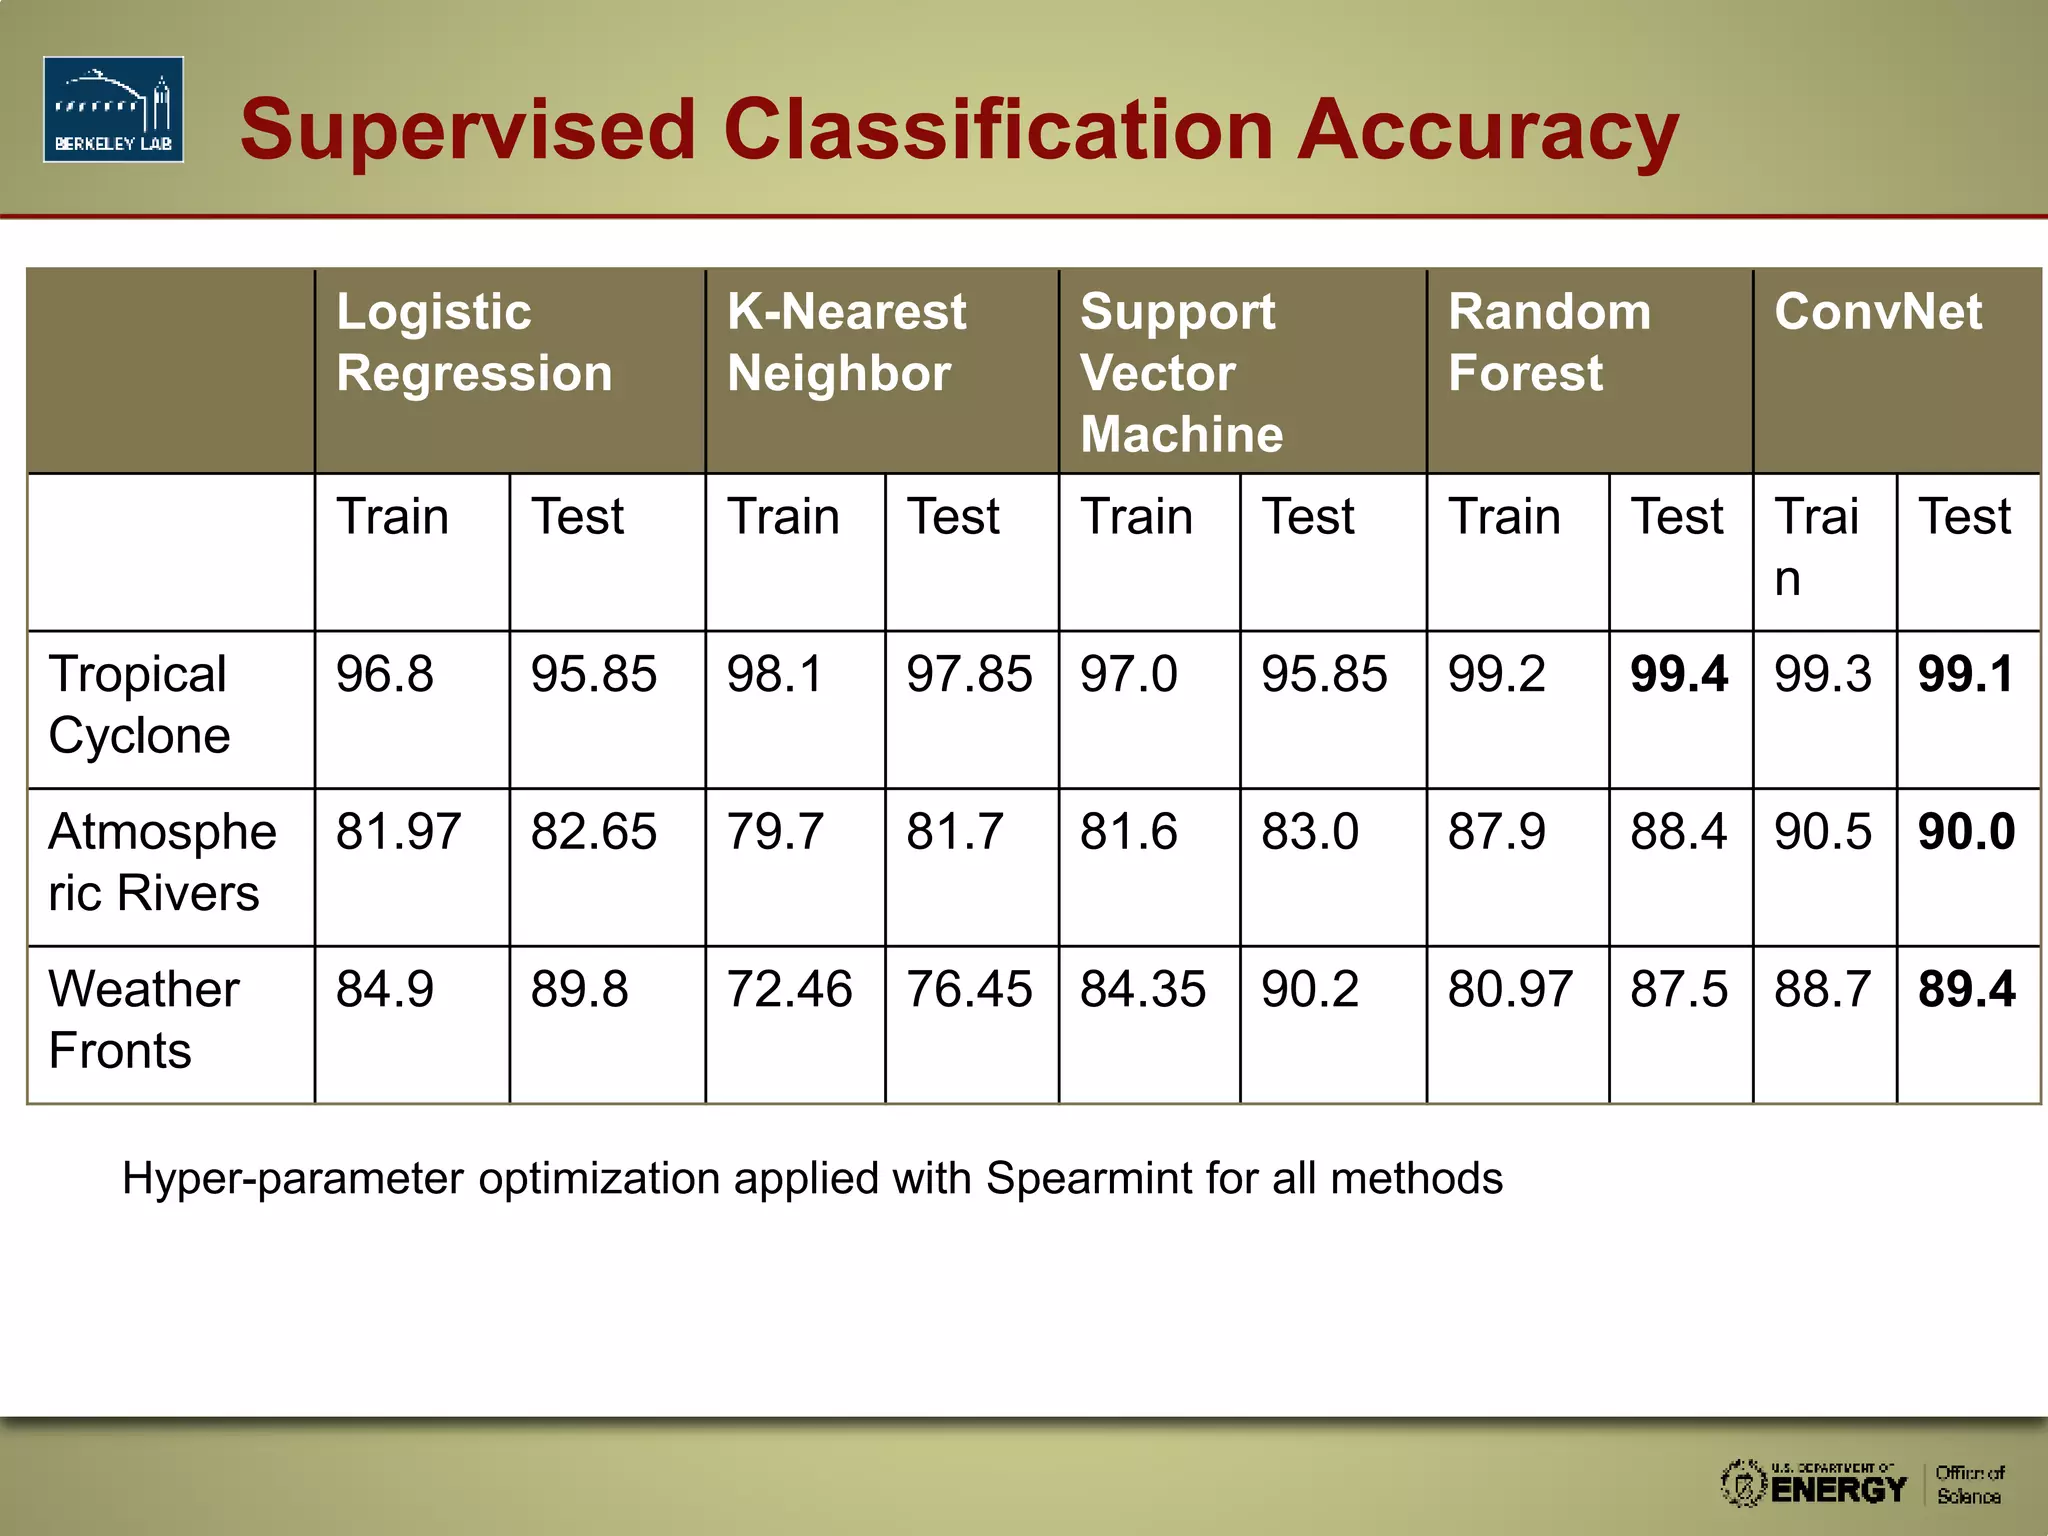
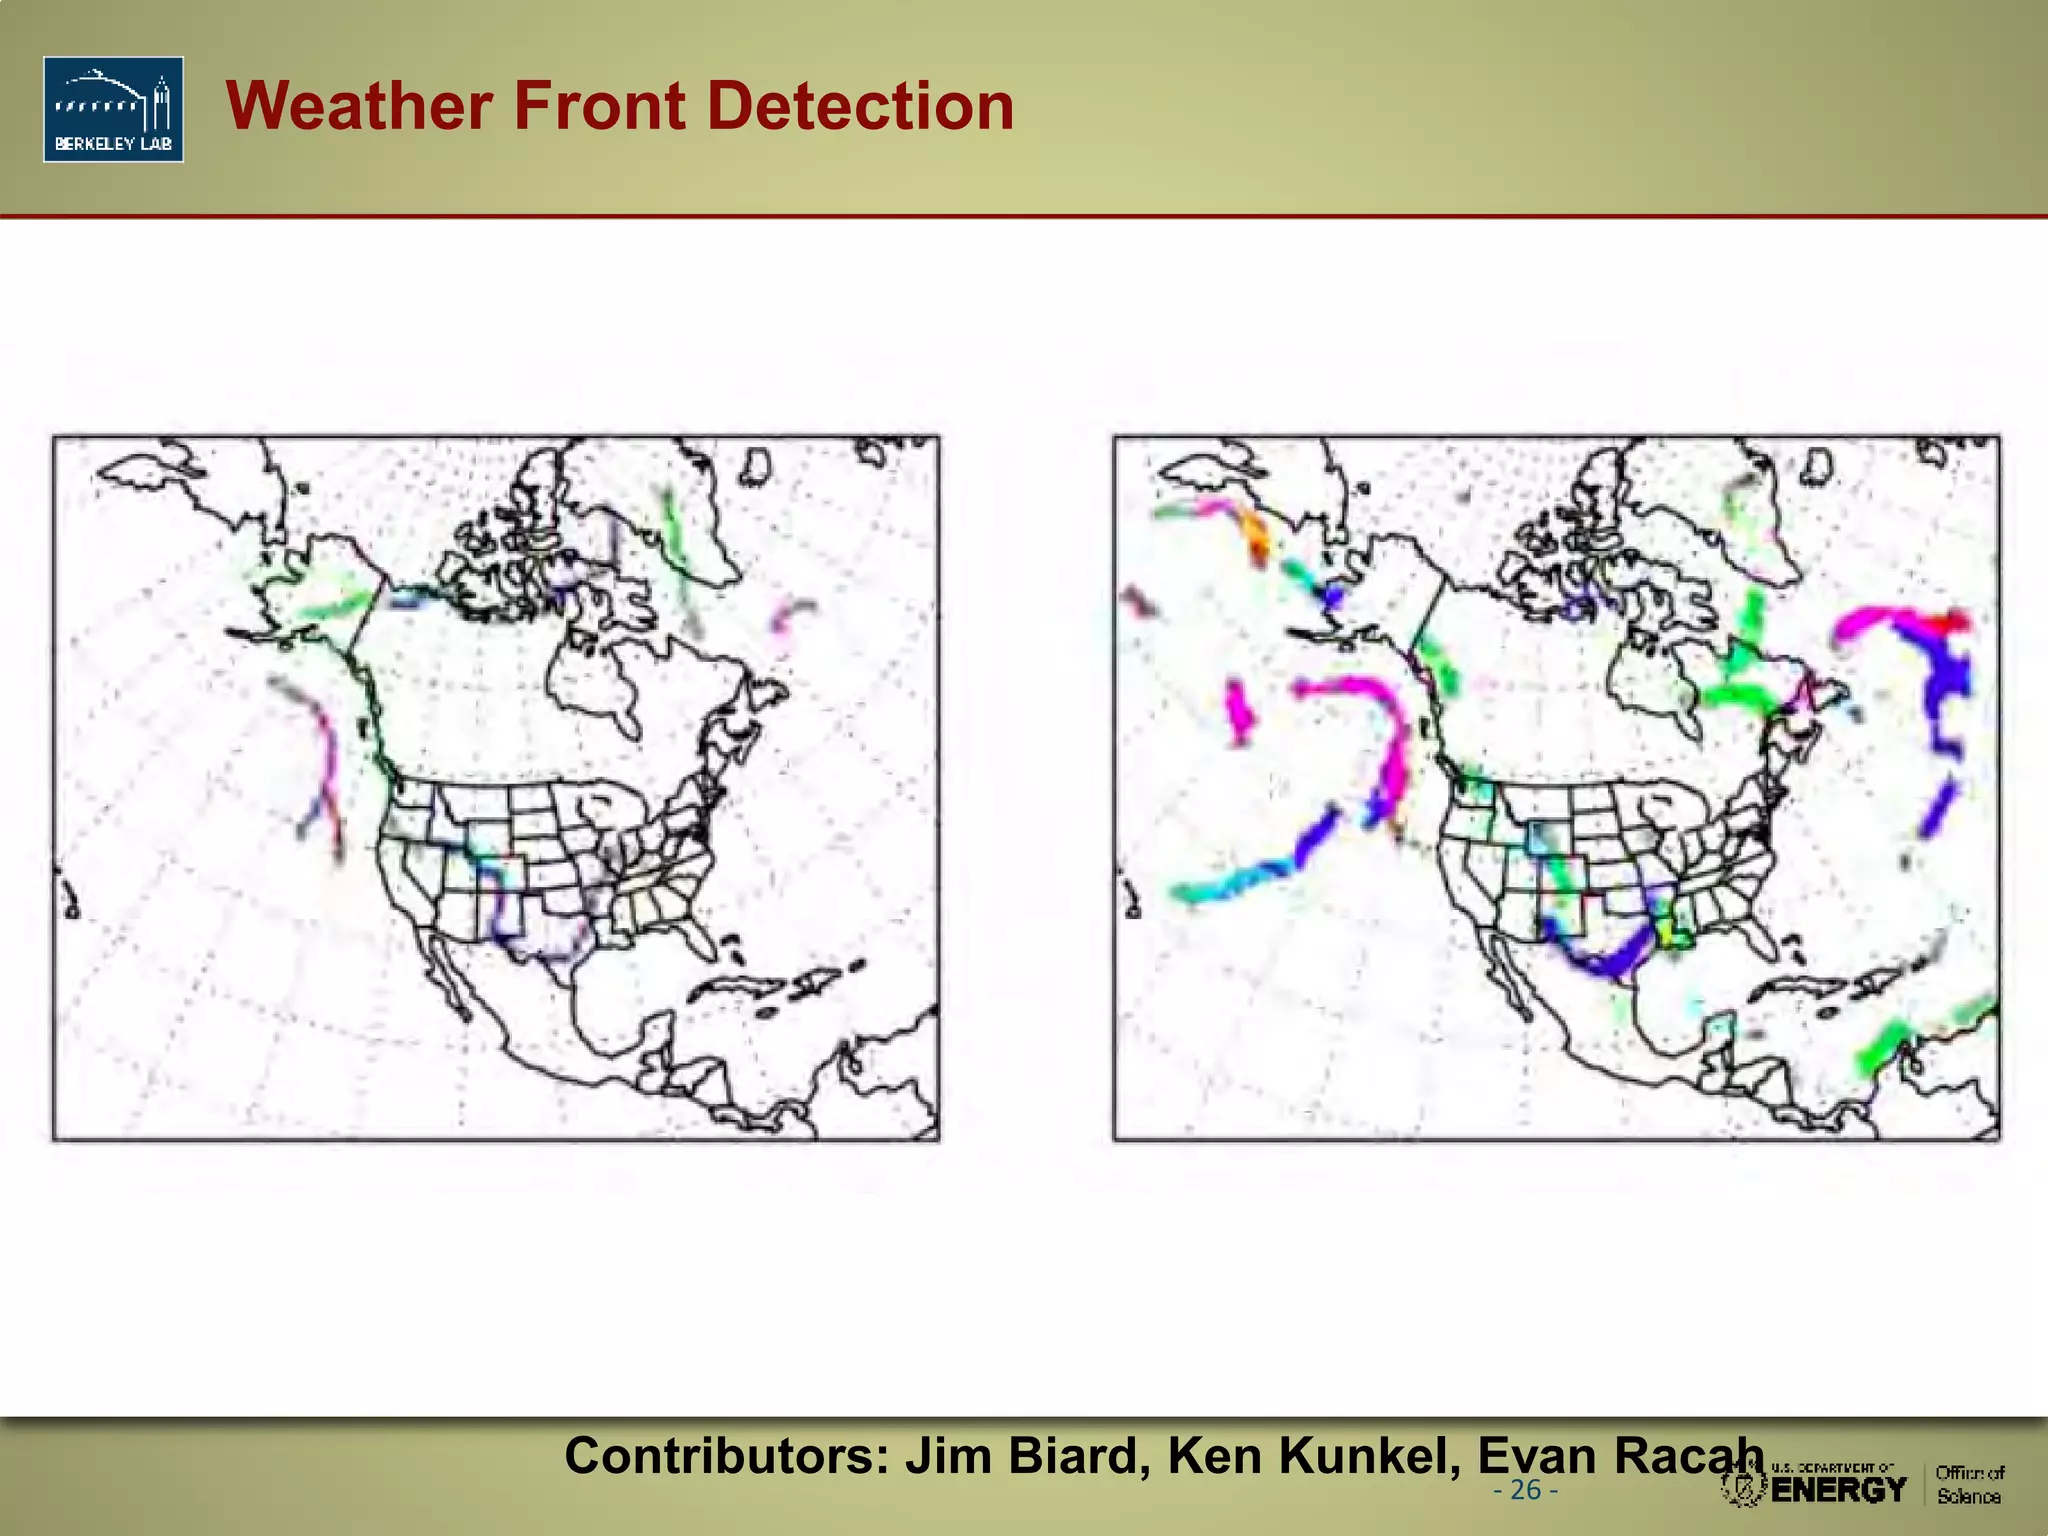
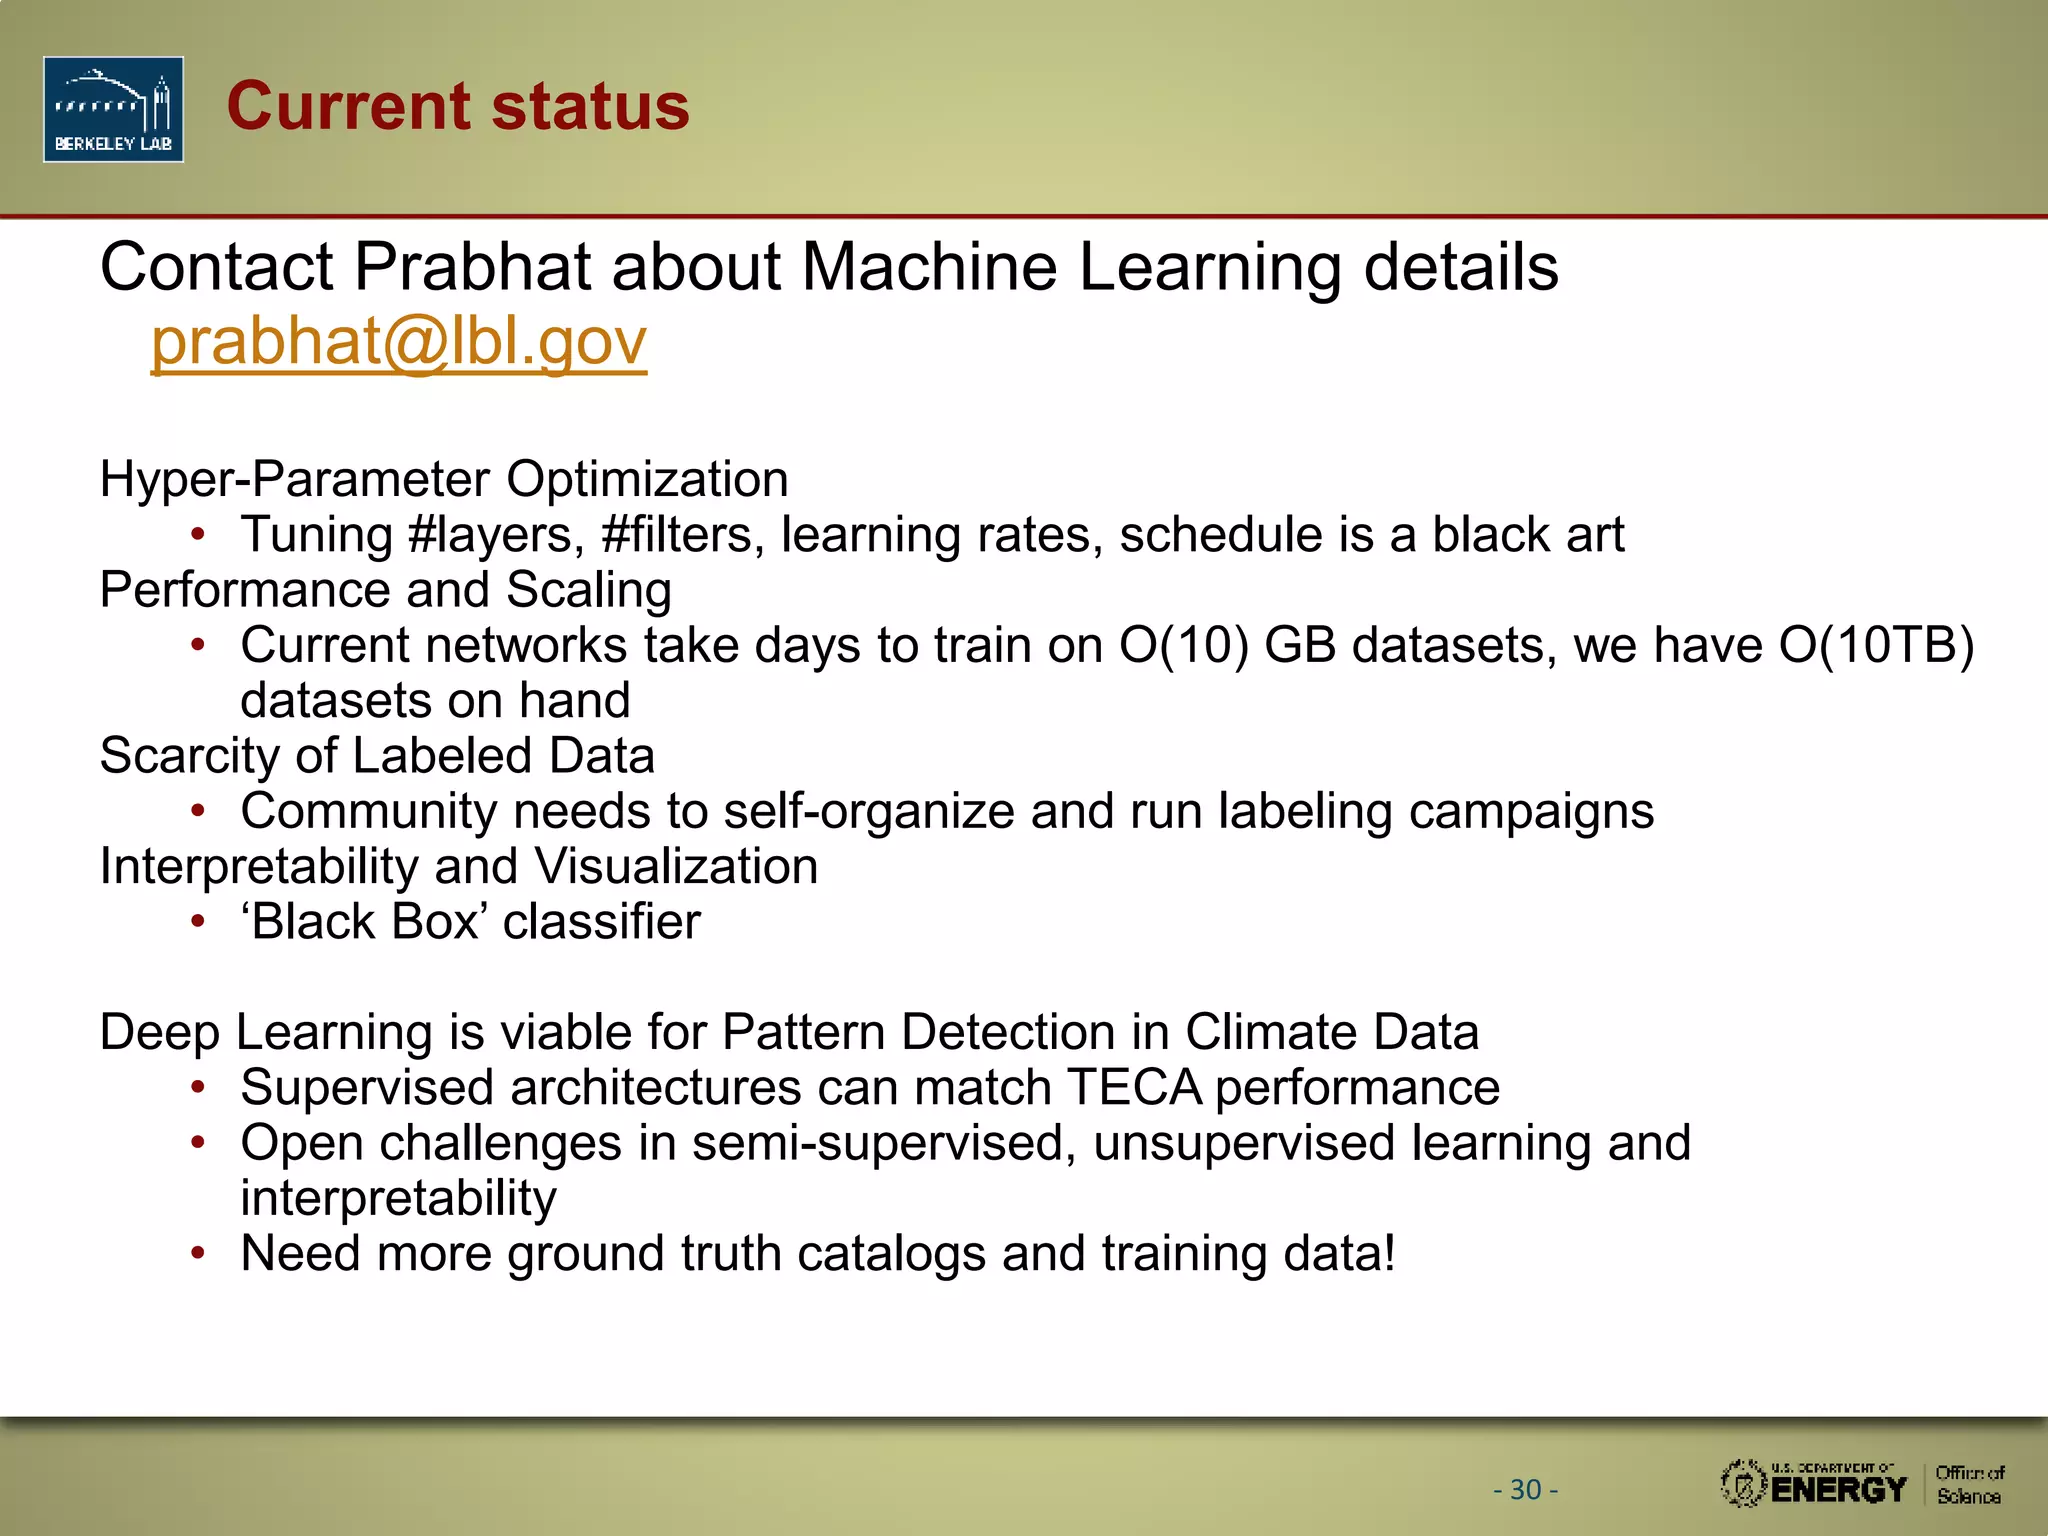
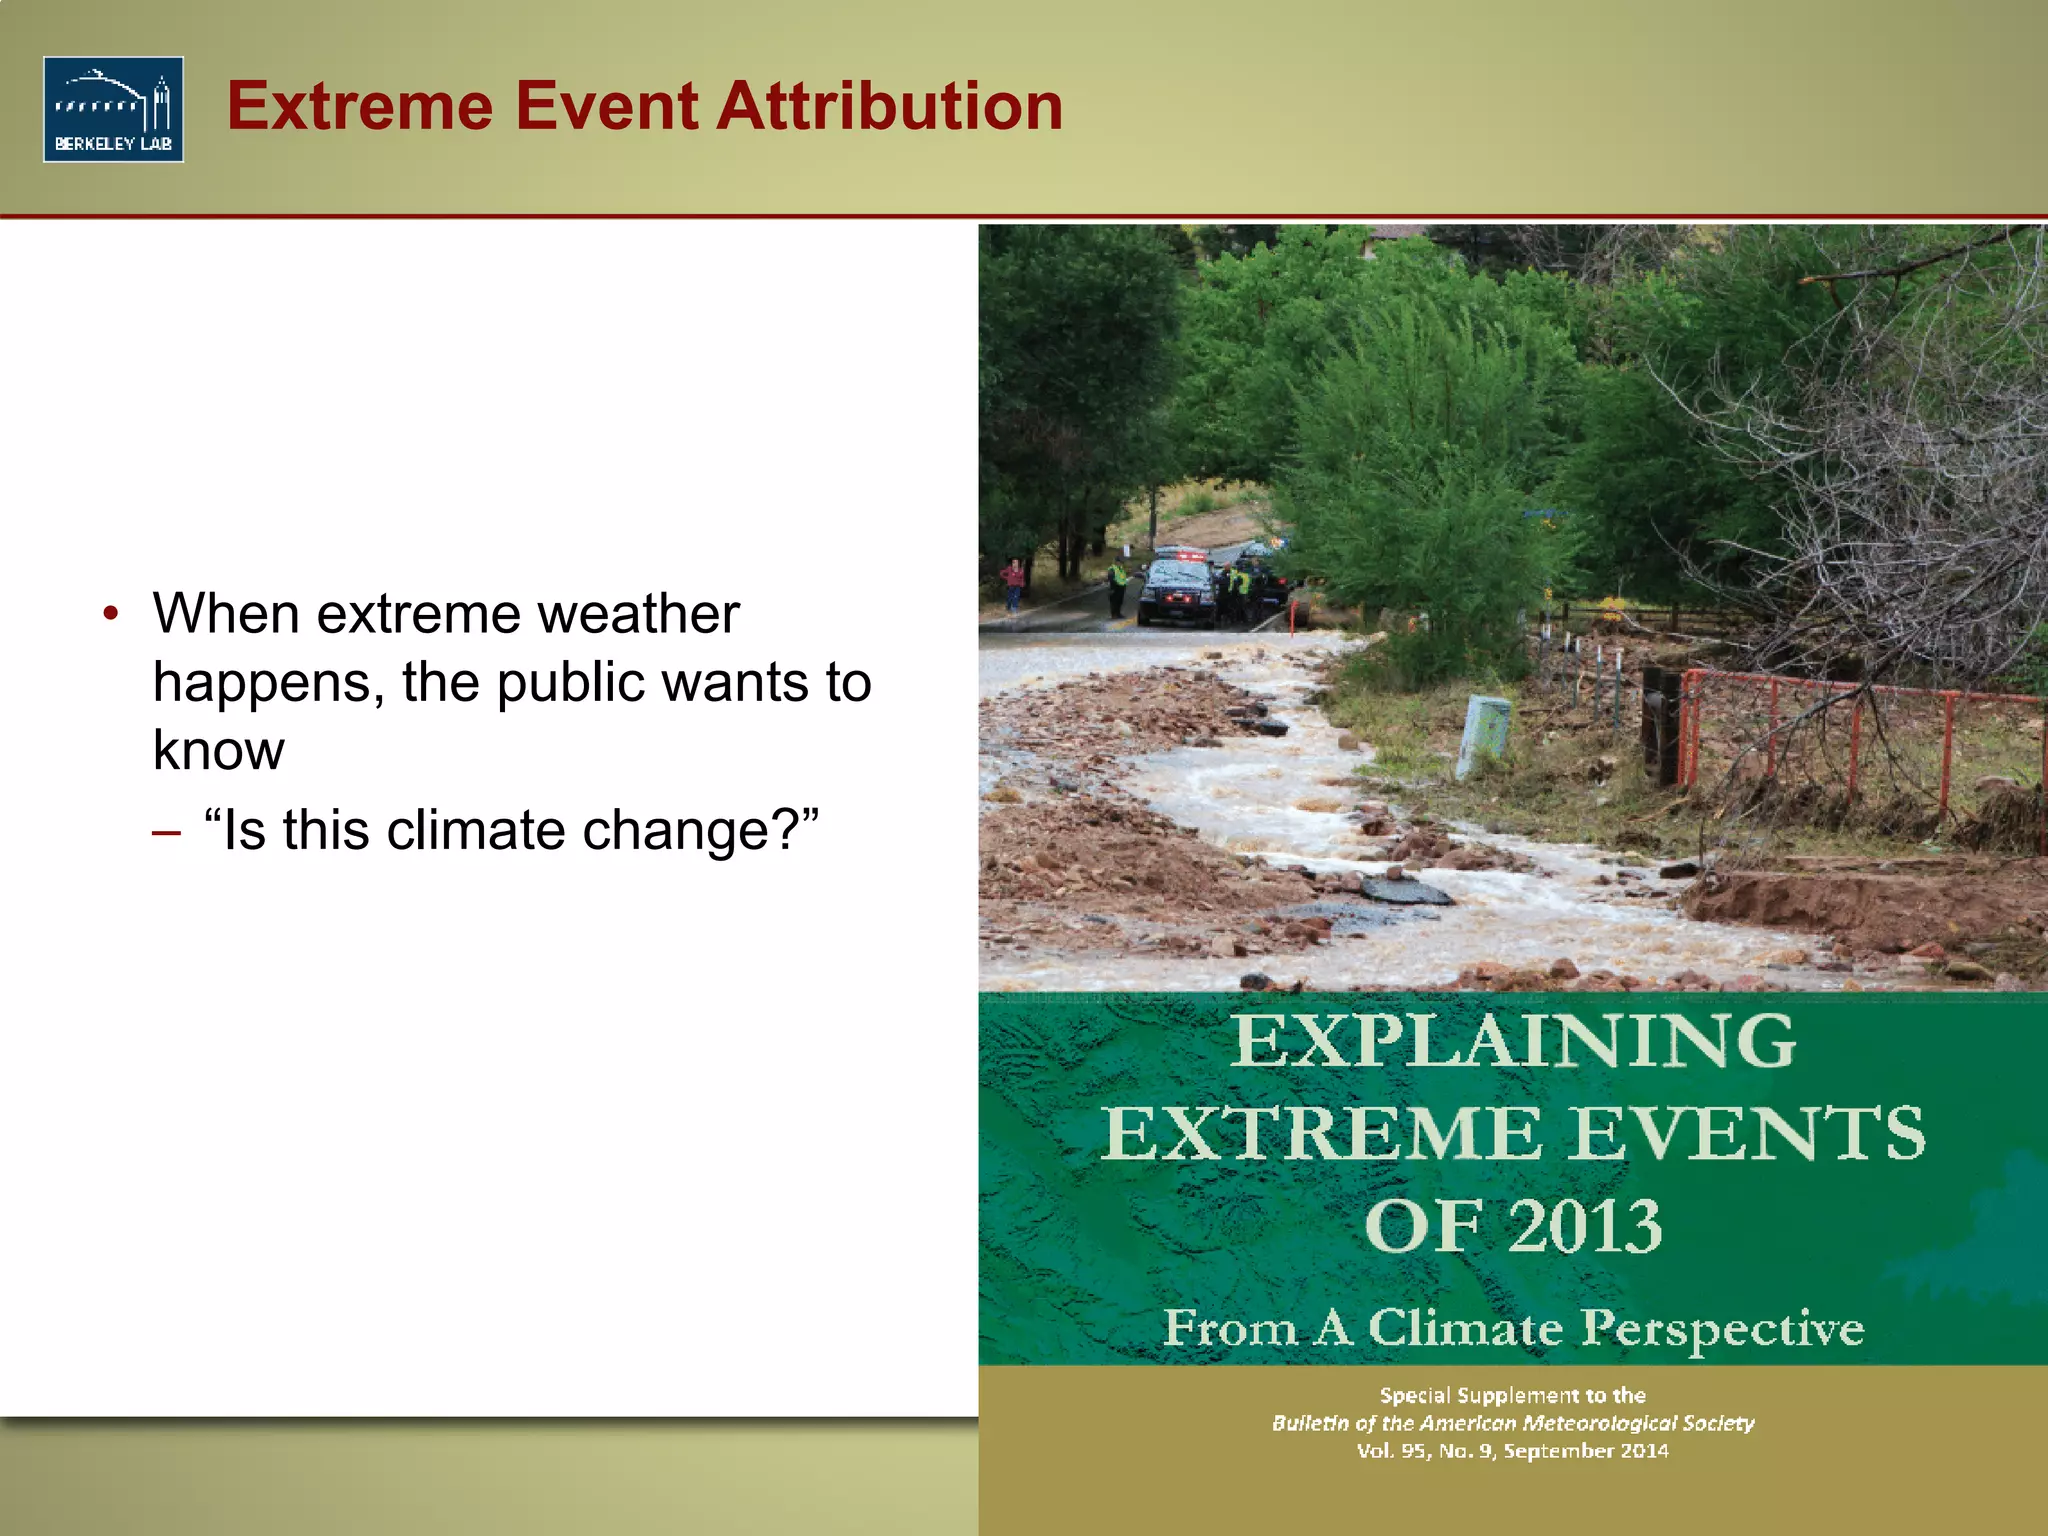


The document discusses advancements in high-resolution climate models and machine learning applications for extreme weather event attribution. It highlights significant improvements in modeling capabilities due to increased computational power and details various machine learning approaches for storm detection. Additionally, it addresses the importance of understanding climate change's impact on extreme weather events and the need for more labeled data in the community.