Download to read offline


![This reseach is part of a ‘Climate Changes Spatial Planning’ project Thank you Adaptive Capacity to Extreme events in the Rhine basin (ACER) More information on: www.klimaatvoorruimte.nl (english version) and www.adaptation.nl\acer [email_address]](https://image.slidesharecdn.com/20081002floodriskoxfordtelinde3-123996430158-phpapp02/85/Simulating-flood-peak-probability-in-the-Rhine-basin-and-the-effect-of-climate-change-15-320.jpg)

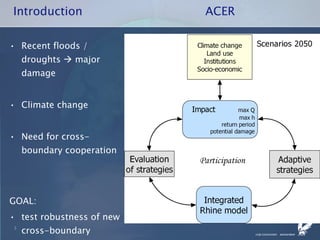
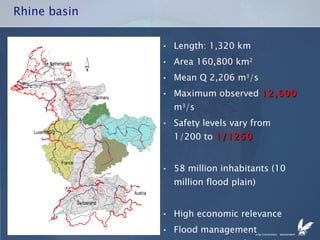
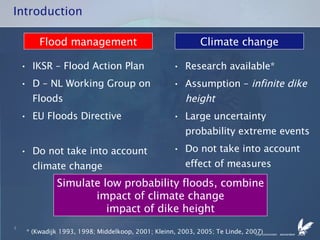
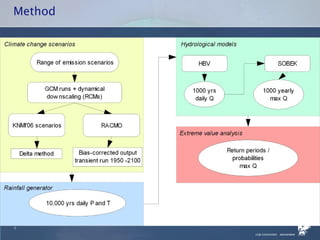
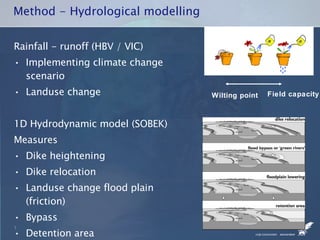
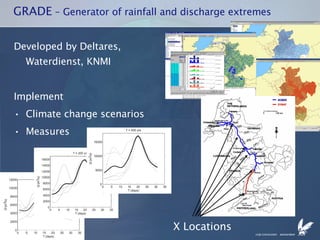
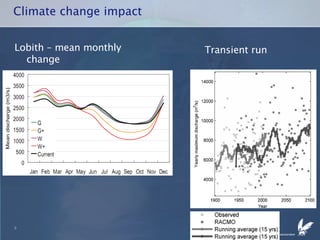
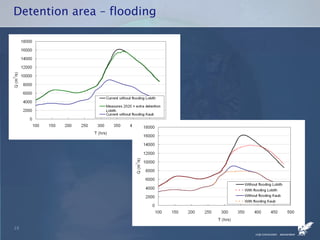
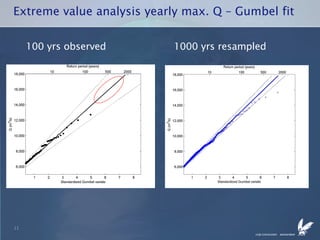
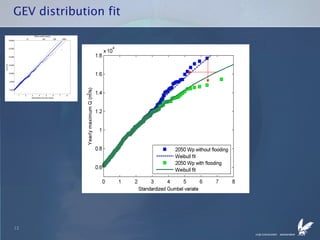
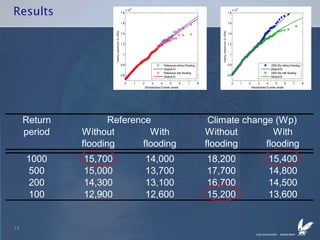
This document summarizes a study that used hydrological modeling and extreme value analysis to simulate flood peak probabilities in the Rhine River basin under current and future climate change scenarios. The study used the GRADE model to generate rainfall-runoff data and simulate the effects of measures like dike heightening and detention areas. The results found that detention areas can significantly reduce flooding depending on the event size, and that climate change is expected to increase the frequency of extreme peak flooding events. The combined effects of climate change and adaptation measures on extreme flood risks in the Rhine basin were analyzed.