Chapter six focuses on sample size determination and power analysis in analytic epidemiology, emphasizing the importance of an optimum sample size for accurate study findings. It discusses factors affecting sample size and the significance of minimizing type I and type II errors to ensure valid statistical conclusions. The chapter outlines procedures for calculating sample size and the application of power analysis to evaluate the adequacy of the sample after study completion.

![Calculating sample size
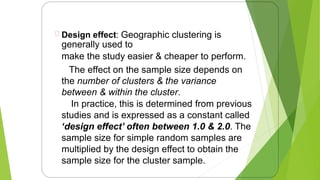
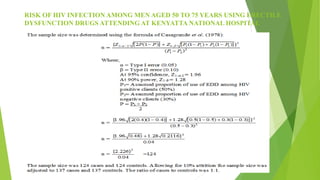
Problem: The research question is whether elderly smokers have a
greater incidence of skin cancer than non-smokers. Are view of
previous literature suggests that the 5-year incidence of skin cancer
is about 0.20 in elderly non-smokers. At α (two-sided) = 0.05 and
power = 0.80, how many smokers and non-smokers will need to be
studied to determine whether the 5-year skin cancer incidence is at
least 0.30 in smokers?
n = 2
2
1
2
2
2
1
1
1
2
/
1
)
(
}
)]
1
(
)
1
(
[
)]
1
(
2
[
{
P
P
P
P
P
P
Z
P
P
Z
](https://image.slidesharecdn.com/chapter6powerandsamplesize-240704164003-aa02aebc/85/MPH-CHAPTER-6-Power-and-sample-size-pptx-24-320.jpg)


![CTEV [ clubfoot] DR ARUN LAL ,DR MOHAMED ASHRAF travancore medical college k...](https://cdn.slidesharecdn.com/ss_thumbnails/ctevclubfootdrarunlaldrmohamedashraftravancoremedicalcollegekollamkeralaindia-260208063247-18fc466c-thumbnail.jpg?width=640&height=640&fit=bounds)


