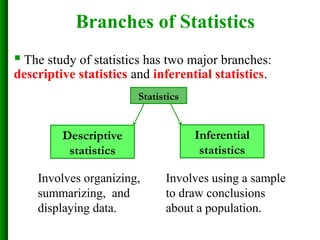
Math 1127
Introductory Statistics
Dr. Carlos Almada
Office: 212 University Hall
Office Hours: Wed 7-11 am
Math 1127: Class Format
My share
 Lectures, Blackboard,
Powerpoint, Slides
 Problem Solving
 Discussion
 Office Hours
Your share
 Be prepared!
 Arrive on time
 Stay until end of session
 Do the homework
 Provide feedback
Stats … Before
Stats … After
Class Web Page:
Go to
http://facstaff.columbusstate.edu/almada_carlos/
Click on
Math 1127: Introductory Statistics
Overview Of Statistics
 Recent news programs have found
that dairies companies have been
under filling milk containers sent to
public school lunch programs. This
under filling of containers costs
school districts, that is, taxpayers,
mega-bucks.
How could you discover if containers in your
school district were being under filled?
Typical Problem
Allen
Benning Hills
Blanchard
Brewer
Britt David Elementary Computer Magnet
Academy
Clubview
Cusseta Road
Davis
Dawson
Dimon Elementary
Double Churches
Downtown Elementary Magnet Academy
Eastway
Edgewood
Forrest Road
Fox
Public Elementary Schools
Gentian
Georgetown
Hannan Elementary
Johnson
Key
Martin Luther King, Jr.
Mathews
Midland Academy
Muscogee
North Columbus Elementary
Reese Road
Rigdon Road
River Road
South Columbus
St. Marys Video and
Communication Technology
Waddell
Wesley Heights
Wynnton
Middle
Arnold
Baker
Blackmon Road
Double Churches
East Columbus Magnet
Academy
Eddy
Fort
Marshall
Midland
Richards
Rothschild
High
Anne Elizabeth Sheperd Home
Carver
Columbus
Early College Academy of Columbus
Hardaway
Jordan Vocational
Kendrick
Northside
Shaw
Spencer
Public Middle/High Schools
Number of Students in 2008: 33,502
Economically Disadvantaged: 61.00%
Students with Disabilities: 12.00%
English Language Learners: 2.00%
Did this District make Adequate Yearly Progress
in 2008?
No
District Facts for 2008
Chapter 1
Introduction to Statistics
 Overview
 Variables and Types of Data
Introduction to Statistics
 Definition: Statistics is the science of
C Collecting …
O Organizing …
D Displaying …
I Interpreting …
A Analyzing …
Data
in order to make decisions.
 “Data” is the plural of “Datum” (Latin for
“given”).
 Consists of information coming from counts,
observations, measurements, or responses on
a set of objects.
 The objects can be anything…, e.g., people,
animals
Introduction to Statistics
 Definition of Population and Sample
 Population: the complete collection of all
individuals or objects (scores, people,
measurements, and so on) to be studied.
 Sample: a subcollection of members selected
from a population and from which the desired
information is collected.
Introduction to Statistics
 Definition of Population and Sample
Introduction to Statistics
Therefore, There Is
 Population Data or Census
Consists of data collected from every
member of a population
 Sample Data
Consists of data collected from the
members of a sample of a population
Population and Sample
Example: In a recent survey, 250 college students at
Union College were asked if they smoked cigarettes
regularly. 35 of the students said yes. Identify the
population and the sample.
Responses of all students at
Union College (population)
Responses of students
in survey (sample)
Parameters and Statistics
Parameter Population
Statistic Sample
 A parameter is a numerical description of a
population characteristic.
 A statistic is a numerical description of a
sample characteristic.
Example: Decide whether the numerical value
describes a population parameter or a sample
statistic.
 A recent survey of a sample of 450 college students
reported that the average weekly income for
students is $325.
Because the average of $325 is based on a
sample, this is a sample statistic.
 The average weekly income for all students is $405.
Because the average of $405 is based on a
population, this is a population parameter.
Parameters and Statistics
Branches of Statistics
 The study of statistics has two major branches:
descriptive statistics and inferential statistics.
Statistics
Descriptive
statistics
Inferential
statistics
Involves organizing,
summarizing, and
displaying data.
Involves using a sample
to draw conclusions
about a population.
Descriptive and Inferential Statistics
Example: In a recent study, volunteers who had less than
6 hours of sleep were four times more likely to answer
incorrectly on a science test than were participants who
had at least 8 hours of sleep.
Decide which part is the descriptive statistic and what
conclusion might be drawn using inferential statistics.
The statement “four times more likely to answer
incorrectly” is a descriptive statistic. An inference
drawn from the sample is that all individuals sleeping
less than 6 hours are more likely to answer science
questions incorrectly than individuals who sleep at
least 8 hours.
Descriptive and Inferential Statistics
Step 1: Identify a Research Objective
• Researcher must determine question he/she
wants answered.
• Identify the group to be studied. This group is
called the population.
• An individual is a person or object that is a
member of the population being studied
The Process of Statistics
Step 2: Collect the information needed to
answer the questions.
• In conducting research, we typically look at a
subset of the population, called a sample.
Step 3: Organize and summarize the
information.
• Descriptive statistics consists of organizing
and summarizing the information collected.
Consists of charts, tables, and numerical
summaries.
The Process of Statistics
Step 4: Draw conclusions from the
information.
• The information collected from the sample is
generalized to the population.
• Inferential statistics uses methods that
generalize results obtained from a sample to the
population and measure their reliability.
The Process of Statistics
Data Collection
Simple Random
Sampling
We say that a sample of size n from a population of
size N is obtained through simple random sampling
if every possible sample of size n has an equally
likely chance of occurring.
The sample is then called a simple random sample.
Simple Random Sampling (SRS)
In chapter 6 we will be interested in all possible
samples of a fixed size that can be selected from a
given population
Suppose a study group of consists of 5 students: Bob,
Patricia, Mike, Jan, and Maria. Two of the students
must go to the board to demonstrate a homework
problem. List all possible samples of size 2 (without
replacement).
• Bob, Patricia
• Bob, Mike
• Bob, Jan
• Bob, Maria
• Patricia, Mike
• Patricia, Jan
• Patricia, Maria
• Mike, Jan
• Mike, Maria
• Jan, Maria
Simple Random Sampling (SRS)
Steps for Obtaining a SRS
 Obtain a frame that lists all the individuals
in the population of interest.
 Number the individuals in the frame 1 - N.
 Use a graphing calculator, or statistical
software to randomly generate n numbers
where n is the desired sample size.
Variables and Data
Variables
 Variables are the characteristics of the
individuals within the population.
 Mathematically speaking, a variable is a
function that assigns to each member of a
population an output that can be numerically
or non-numerically valued.
 According to this output we have…..
A Qualitative or Categorical variable allows for the
classification of individuals based on some attribute or
characteristic. It is a non-numerically valued variable.
A Quantitative variable provides numerical measures
of individuals. Arithmetic operations such as addition
and subtraction can be performed on the values of the
quantitative variable and provide meaningful results.
Two Types of Variables
Determine whether the following variables are
qualitative or quantitative.
a) Type of wood used to build a kitchen table.
b) Number of yards Tiger Woods hits his drives.
c) Number of times your Internet service goes
down in the next 30 days.
Examples of Variables
More Examples of Variables
 Age, Height, Weight
 Grade in Math 1127 (A=4, B=3, etc.)
 Temperature (K, F, C)
 Male (0), Female (1), Androgynous (2)
 Test score (e.g., SAT)
A discrete variable is a quantitative variable that either
has a finite number of possible values or a countable
number of possible values.
A continuous variable is a quantitative variable that has
infinitely many possible values that correspond to some
continuous scale that covers a range of values without
gaps, interruptions, or jumps. A continuous variable can
be measured to any desired level of accuracy.
Types of Quantitative Variables
Determine whether the following quantitative
variables are continuous or discrete.
a) Number of yards Tiger Woods hits his drives.
b) Number of times your Internet service goes
down in the next 30 days.
Types of Quantitative Variables
Variables
Data
 The list of observations a variable assumes
is called data.
 While gender is a variable, the observations,
male or female, are data.
 According to the type of data the variables
represents, we can have ……
Qualitative data are observations corresponding to a
qualitative variable.
Quantitative data are observations corresponding to a
quantitative variable.
Discrete data are observations corresponding to a
discrete variable.
Continuous data are observations corresponding
to a continuous variable.
Data
 Each row records data on one individual.
 Each column contains the values of one
variable for all the individuals.
Here is part of the data set (a spreadsheet) in which Cyber
Stat Corporation records information about its employees:
Example of Variables and Data

Lect1

  • 1.
    Math 1127 Introductory Statistics Dr.Carlos Almada Office: 212 University Hall Office Hours: Wed 7-11 am
  • 3.
    Math 1127: ClassFormat My share  Lectures, Blackboard, Powerpoint, Slides  Problem Solving  Discussion  Office Hours Your share  Be prepared!  Arrive on time  Stay until end of session  Do the homework  Provide feedback
  • 4.
  • 5.
  • 6.
    Class Web Page: Goto http://facstaff.columbusstate.edu/almada_carlos/ Click on Math 1127: Introductory Statistics
  • 7.
  • 8.
     Recent newsprograms have found that dairies companies have been under filling milk containers sent to public school lunch programs. This under filling of containers costs school districts, that is, taxpayers, mega-bucks. How could you discover if containers in your school district were being under filled? Typical Problem
  • 9.
    Allen Benning Hills Blanchard Brewer Britt DavidElementary Computer Magnet Academy Clubview Cusseta Road Davis Dawson Dimon Elementary Double Churches Downtown Elementary Magnet Academy Eastway Edgewood Forrest Road Fox Public Elementary Schools Gentian Georgetown Hannan Elementary Johnson Key Martin Luther King, Jr. Mathews Midland Academy Muscogee North Columbus Elementary Reese Road Rigdon Road River Road South Columbus St. Marys Video and Communication Technology Waddell Wesley Heights Wynnton
  • 10.
    Middle Arnold Baker Blackmon Road Double Churches EastColumbus Magnet Academy Eddy Fort Marshall Midland Richards Rothschild High Anne Elizabeth Sheperd Home Carver Columbus Early College Academy of Columbus Hardaway Jordan Vocational Kendrick Northside Shaw Spencer Public Middle/High Schools
  • 11.
    Number of Studentsin 2008: 33,502 Economically Disadvantaged: 61.00% Students with Disabilities: 12.00% English Language Learners: 2.00% Did this District make Adequate Yearly Progress in 2008? No District Facts for 2008
  • 13.
    Chapter 1 Introduction toStatistics  Overview  Variables and Types of Data
  • 14.
    Introduction to Statistics Definition: Statistics is the science of C Collecting … O Organizing … D Displaying … I Interpreting … A Analyzing … Data in order to make decisions.
  • 15.
     “Data” isthe plural of “Datum” (Latin for “given”).  Consists of information coming from counts, observations, measurements, or responses on a set of objects.  The objects can be anything…, e.g., people, animals Introduction to Statistics
  • 16.
     Definition ofPopulation and Sample  Population: the complete collection of all individuals or objects (scores, people, measurements, and so on) to be studied.  Sample: a subcollection of members selected from a population and from which the desired information is collected. Introduction to Statistics
  • 17.
     Definition ofPopulation and Sample Introduction to Statistics
  • 18.
    Therefore, There Is Population Data or Census Consists of data collected from every member of a population  Sample Data Consists of data collected from the members of a sample of a population
  • 19.
    Population and Sample Example:In a recent survey, 250 college students at Union College were asked if they smoked cigarettes regularly. 35 of the students said yes. Identify the population and the sample. Responses of all students at Union College (population) Responses of students in survey (sample)
  • 20.
    Parameters and Statistics ParameterPopulation Statistic Sample  A parameter is a numerical description of a population characteristic.  A statistic is a numerical description of a sample characteristic.
  • 21.
    Example: Decide whetherthe numerical value describes a population parameter or a sample statistic.  A recent survey of a sample of 450 college students reported that the average weekly income for students is $325. Because the average of $325 is based on a sample, this is a sample statistic.  The average weekly income for all students is $405. Because the average of $405 is based on a population, this is a population parameter. Parameters and Statistics
  • 22.
    Branches of Statistics The study of statistics has two major branches: descriptive statistics and inferential statistics. Statistics Descriptive statistics Inferential statistics Involves organizing, summarizing, and displaying data. Involves using a sample to draw conclusions about a population.
  • 23.
    Descriptive and InferentialStatistics Example: In a recent study, volunteers who had less than 6 hours of sleep were four times more likely to answer incorrectly on a science test than were participants who had at least 8 hours of sleep. Decide which part is the descriptive statistic and what conclusion might be drawn using inferential statistics. The statement “four times more likely to answer incorrectly” is a descriptive statistic. An inference drawn from the sample is that all individuals sleeping less than 6 hours are more likely to answer science questions incorrectly than individuals who sleep at least 8 hours.
  • 24.
  • 25.
    Step 1: Identifya Research Objective • Researcher must determine question he/she wants answered. • Identify the group to be studied. This group is called the population. • An individual is a person or object that is a member of the population being studied The Process of Statistics
  • 26.
    Step 2: Collectthe information needed to answer the questions. • In conducting research, we typically look at a subset of the population, called a sample. Step 3: Organize and summarize the information. • Descriptive statistics consists of organizing and summarizing the information collected. Consists of charts, tables, and numerical summaries. The Process of Statistics
  • 27.
    Step 4: Drawconclusions from the information. • The information collected from the sample is generalized to the population. • Inferential statistics uses methods that generalize results obtained from a sample to the population and measure their reliability. The Process of Statistics
  • 28.
  • 29.
    We say thata sample of size n from a population of size N is obtained through simple random sampling if every possible sample of size n has an equally likely chance of occurring. The sample is then called a simple random sample. Simple Random Sampling (SRS) In chapter 6 we will be interested in all possible samples of a fixed size that can be selected from a given population
  • 30.
    Suppose a studygroup of consists of 5 students: Bob, Patricia, Mike, Jan, and Maria. Two of the students must go to the board to demonstrate a homework problem. List all possible samples of size 2 (without replacement). • Bob, Patricia • Bob, Mike • Bob, Jan • Bob, Maria • Patricia, Mike • Patricia, Jan • Patricia, Maria • Mike, Jan • Mike, Maria • Jan, Maria Simple Random Sampling (SRS)
  • 31.
    Steps for Obtaininga SRS  Obtain a frame that lists all the individuals in the population of interest.  Number the individuals in the frame 1 - N.  Use a graphing calculator, or statistical software to randomly generate n numbers where n is the desired sample size.
  • 32.
  • 33.
    Variables  Variables arethe characteristics of the individuals within the population.  Mathematically speaking, a variable is a function that assigns to each member of a population an output that can be numerically or non-numerically valued.  According to this output we have…..
  • 34.
    A Qualitative orCategorical variable allows for the classification of individuals based on some attribute or characteristic. It is a non-numerically valued variable. A Quantitative variable provides numerical measures of individuals. Arithmetic operations such as addition and subtraction can be performed on the values of the quantitative variable and provide meaningful results. Two Types of Variables
  • 35.
    Determine whether thefollowing variables are qualitative or quantitative. a) Type of wood used to build a kitchen table. b) Number of yards Tiger Woods hits his drives. c) Number of times your Internet service goes down in the next 30 days. Examples of Variables
  • 36.
    More Examples ofVariables  Age, Height, Weight  Grade in Math 1127 (A=4, B=3, etc.)  Temperature (K, F, C)  Male (0), Female (1), Androgynous (2)  Test score (e.g., SAT)
  • 37.
    A discrete variableis a quantitative variable that either has a finite number of possible values or a countable number of possible values. A continuous variable is a quantitative variable that has infinitely many possible values that correspond to some continuous scale that covers a range of values without gaps, interruptions, or jumps. A continuous variable can be measured to any desired level of accuracy. Types of Quantitative Variables
  • 38.
    Determine whether thefollowing quantitative variables are continuous or discrete. a) Number of yards Tiger Woods hits his drives. b) Number of times your Internet service goes down in the next 30 days. Types of Quantitative Variables
  • 39.
  • 40.
    Data  The listof observations a variable assumes is called data.  While gender is a variable, the observations, male or female, are data.  According to the type of data the variables represents, we can have ……
  • 41.
    Qualitative data areobservations corresponding to a qualitative variable. Quantitative data are observations corresponding to a quantitative variable. Discrete data are observations corresponding to a discrete variable. Continuous data are observations corresponding to a continuous variable. Data
  • 42.
     Each rowrecords data on one individual.  Each column contains the values of one variable for all the individuals. Here is part of the data set (a spreadsheet) in which Cyber Stat Corporation records information about its employees: Example of Variables and Data