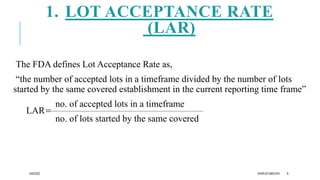
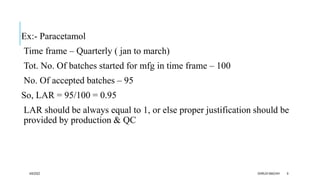
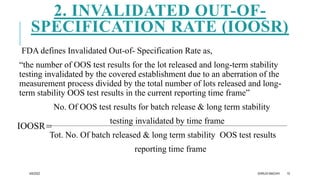
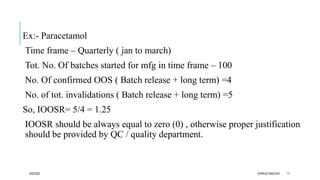
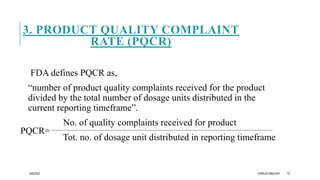
Presentation
On
Quality Metrics
By
Machhi Dhruvi Anilkumar
From
1st sem M. Pharm
(P’ceutical Quality Assurance)
Course name & Code:
Quality Management System
MQA102T
Smt. B. N. B. Swaminarayan Pharmacy Colleg, salvav-vapi
4/6/2022 DHRUVI MACHHI 1
CONTENTS :-
1. Introduction
2. Quality metrics
3. Need of quality metrics
4. Importance of Quality metrics
5. Lot Acceptance Rate
6. Invalidated Out-of-Specification
7. Product Quality Complaint Rate
8. Reference
4/6/2022 DHRUVI MACHHI 2
INTRODUCTION:-
In order to improve any system we need to monitor & measure &
In order to monitor & measure we need to establish metrics.
Metrics:-
It is defined as a system or standard of measurement
It is the assessment tool using figures or statistics to evaluate the
performance
Quality metrics:-
It is a particular system or standard to measure quality.
4/6/2022 DHRUVI MACHHI 3
QUALITY METRICS:-
Quality metrics are widely used throughout the Pharmaceutical industry to
monitor quality control systems and processes.
Quality metrics are a key component of an effective quality management
plan
They are the measurements used in ensuring customers receive acceptable
products or deliverables.
Quality metrics are used to directly translate customer needs into
acceptable performance measures in both products and processes.
4/6/2022 DHRUVI MACHHI 4
WHY ARE QUALITY METRICS IMPORTANT?
• The Pharmaceutical Quality System (PQS), a management system to
direct & control a pharmaceutical company with regard to quality
provides key elements of assurance oversee pharmaceutical
manufacturing and quality control laboratory processes throughout the
entire product lifecycle, from development through commercial
manufacturing.
• It ensures that quality drugs are available when patients need them.
4/6/2022 DHRUVI MACHHI 5
NEED OF QUALITY METRICS :-
Quality metrics are better tool to assess performance &
improvements
To improve product quality & development of team productivity
Responsibilities for setting up the measurement of what is
actually taking place with respect to quality.
Responsibilities for reviewing results against goals & for taking
action on significant variation.
4/6/2022 DHRUVI MACHHI 6
QUALITY METRICS THAT FDA INTENDS TO CALCULATE
1.LAR (Lot Acceptance Rate)
2.IOOSR (Invalidated Out-of-Specification Rate)
3.PQCR (Product Quality Complaint Rate)
4/6/2022 DHRUVI MACHHI 7
1. LOT ACCEPTANCE RATE
(LAR)
The FDA defines Lot Acceptance Rate as,
“the number of accepted lots in a timeframe divided by the number of lots
started by the same covered establishment in the current reporting time frame”
no. of accepted lots in a timeframe
no. of lots started by the same covered
4/6/2022 DHRUVI MACHHI 8
LAR=
Ex:- Paracetamol
Time frame – Quarterly ( jan to march)
Tot. No. Of batches started for mfg in time frame – 100
No. Of accepted batches – 95
So, LAR = 95/100 = 0.95
LAR should be always equal to 1, or else proper justification should be
provided by production & QC
4/6/2022 DHRUVI MACHHI 9
2. INVALIDATED OUT-OF-
SPECIFICATION RATE (IOOSR)
FDA defines Invalidated Out-of- Specification Rate as,
“the number of OOS test results for the lot released and long-term stability
testing invalidated by the covered establishment due to an aberration of the
measurement process divided by the total number of lots released and long-
term stability OOS test results in the current reporting time frame”
No. Of OOS test results for batch release & long term stability
testing invalidated by time frame
Tot. No. Of batch released & long term stability OOS test results
reporting time frame
4/6/2022 DHRUVI MACHHI 10
IOOSR=
Ex:- Paracetamol
Time frame – Quarterly ( jan to march)
Tot. No. Of batches started for mfg in time frame – 100
No. Of confirmed OOS ( Batch release + long term) =4
No. of tot. invalidations ( Batch release + long term) =5
So, IOOSR= 5/4 = 1.25
IOOSR should be always equal to zero (0) , otherwise proper justification
should be provided by QC / quality department.
4/6/2022 DHRUVI MACHHI 11
3. PRODUCT QUALITY COMPLAINT
RATE (PQCR)
FDA defines PQCR as,
“number of product quality complaints received for the product
divided by the total number of dosage units distributed in the
current reporting timeframe”.
No. of quality complaints received for product
Tot. no. of dosage unit distributed in reporting timeframe
4/6/2022 DHRUVI MACHHI 12
PQCR=
Ex:- Paracetamol
Time frame – Quarterly ( jan to march)
Tot. No. Of Quality related complaints received in time frame – 2
Tot. No. of dosage units distributed in the current reporting timeframe -
1800
So, PQCR = 2/1800 = 0.001
PQCR should be always equal to zero (0), otherwise proper justification
should be provided by QA.
4/6/2022 DHRUVI MACHHI 13
REFERENCE :-
1. Submission Of Quality Metrics Data Guidance For Industry, U.S.
Department of Health and Human Services, Food and Drug Administration,
Center for Drug Evaluation and Research (CDER) ,Center for Biologics
Evaluation and Research (CBER), November 2016.
( https://www.fda.gov/regulatory-information/search-fda-guidance-
documents/submission-quality-metrics-data-guidance-industry )
2. Quality metrics for drug manufacturing (21/1/’19)
( https://www.fda.gov/drugs/pharmaceutical-quality-resources/quality-
metrics-drug-manufacturing )
4/6/2022 DHRUVI MACHHI 14
THANK YOU
4/6/2022 DHRUVI MACHHI 15

Quality metrics

  • 1.
    Presentation On Quality Metrics By Machhi DhruviAnilkumar From 1st sem M. Pharm (P’ceutical Quality Assurance) Course name & Code: Quality Management System MQA102T Smt. B. N. B. Swaminarayan Pharmacy Colleg, salvav-vapi 4/6/2022 DHRUVI MACHHI 1
  • 2.
    CONTENTS :- 1. Introduction 2.Quality metrics 3. Need of quality metrics 4. Importance of Quality metrics 5. Lot Acceptance Rate 6. Invalidated Out-of-Specification 7. Product Quality Complaint Rate 8. Reference 4/6/2022 DHRUVI MACHHI 2
  • 3.
    INTRODUCTION:- In order toimprove any system we need to monitor & measure & In order to monitor & measure we need to establish metrics. Metrics:- It is defined as a system or standard of measurement It is the assessment tool using figures or statistics to evaluate the performance Quality metrics:- It is a particular system or standard to measure quality. 4/6/2022 DHRUVI MACHHI 3
  • 4.
    QUALITY METRICS:- Quality metricsare widely used throughout the Pharmaceutical industry to monitor quality control systems and processes. Quality metrics are a key component of an effective quality management plan They are the measurements used in ensuring customers receive acceptable products or deliverables. Quality metrics are used to directly translate customer needs into acceptable performance measures in both products and processes. 4/6/2022 DHRUVI MACHHI 4
  • 5.
    WHY ARE QUALITYMETRICS IMPORTANT? • The Pharmaceutical Quality System (PQS), a management system to direct & control a pharmaceutical company with regard to quality provides key elements of assurance oversee pharmaceutical manufacturing and quality control laboratory processes throughout the entire product lifecycle, from development through commercial manufacturing. • It ensures that quality drugs are available when patients need them. 4/6/2022 DHRUVI MACHHI 5
  • 6.
    NEED OF QUALITYMETRICS :- Quality metrics are better tool to assess performance & improvements To improve product quality & development of team productivity Responsibilities for setting up the measurement of what is actually taking place with respect to quality. Responsibilities for reviewing results against goals & for taking action on significant variation. 4/6/2022 DHRUVI MACHHI 6
  • 7.
    QUALITY METRICS THATFDA INTENDS TO CALCULATE 1.LAR (Lot Acceptance Rate) 2.IOOSR (Invalidated Out-of-Specification Rate) 3.PQCR (Product Quality Complaint Rate) 4/6/2022 DHRUVI MACHHI 7
  • 8.
    1. LOT ACCEPTANCERATE (LAR) The FDA defines Lot Acceptance Rate as, “the number of accepted lots in a timeframe divided by the number of lots started by the same covered establishment in the current reporting time frame” no. of accepted lots in a timeframe no. of lots started by the same covered 4/6/2022 DHRUVI MACHHI 8 LAR=
  • 9.
    Ex:- Paracetamol Time frame– Quarterly ( jan to march) Tot. No. Of batches started for mfg in time frame – 100 No. Of accepted batches – 95 So, LAR = 95/100 = 0.95 LAR should be always equal to 1, or else proper justification should be provided by production & QC 4/6/2022 DHRUVI MACHHI 9
  • 10.
    2. INVALIDATED OUT-OF- SPECIFICATIONRATE (IOOSR) FDA defines Invalidated Out-of- Specification Rate as, “the number of OOS test results for the lot released and long-term stability testing invalidated by the covered establishment due to an aberration of the measurement process divided by the total number of lots released and long- term stability OOS test results in the current reporting time frame” No. Of OOS test results for batch release & long term stability testing invalidated by time frame Tot. No. Of batch released & long term stability OOS test results reporting time frame 4/6/2022 DHRUVI MACHHI 10 IOOSR=
  • 11.
    Ex:- Paracetamol Time frame– Quarterly ( jan to march) Tot. No. Of batches started for mfg in time frame – 100 No. Of confirmed OOS ( Batch release + long term) =4 No. of tot. invalidations ( Batch release + long term) =5 So, IOOSR= 5/4 = 1.25 IOOSR should be always equal to zero (0) , otherwise proper justification should be provided by QC / quality department. 4/6/2022 DHRUVI MACHHI 11
  • 12.
    3. PRODUCT QUALITYCOMPLAINT RATE (PQCR) FDA defines PQCR as, “number of product quality complaints received for the product divided by the total number of dosage units distributed in the current reporting timeframe”. No. of quality complaints received for product Tot. no. of dosage unit distributed in reporting timeframe 4/6/2022 DHRUVI MACHHI 12 PQCR=
  • 13.
    Ex:- Paracetamol Time frame– Quarterly ( jan to march) Tot. No. Of Quality related complaints received in time frame – 2 Tot. No. of dosage units distributed in the current reporting timeframe - 1800 So, PQCR = 2/1800 = 0.001 PQCR should be always equal to zero (0), otherwise proper justification should be provided by QA. 4/6/2022 DHRUVI MACHHI 13
  • 14.
    REFERENCE :- 1. SubmissionOf Quality Metrics Data Guidance For Industry, U.S. Department of Health and Human Services, Food and Drug Administration, Center for Drug Evaluation and Research (CDER) ,Center for Biologics Evaluation and Research (CBER), November 2016. ( https://www.fda.gov/regulatory-information/search-fda-guidance- documents/submission-quality-metrics-data-guidance-industry ) 2. Quality metrics for drug manufacturing (21/1/’19) ( https://www.fda.gov/drugs/pharmaceutical-quality-resources/quality- metrics-drug-manufacturing ) 4/6/2022 DHRUVI MACHHI 14
  • 15.