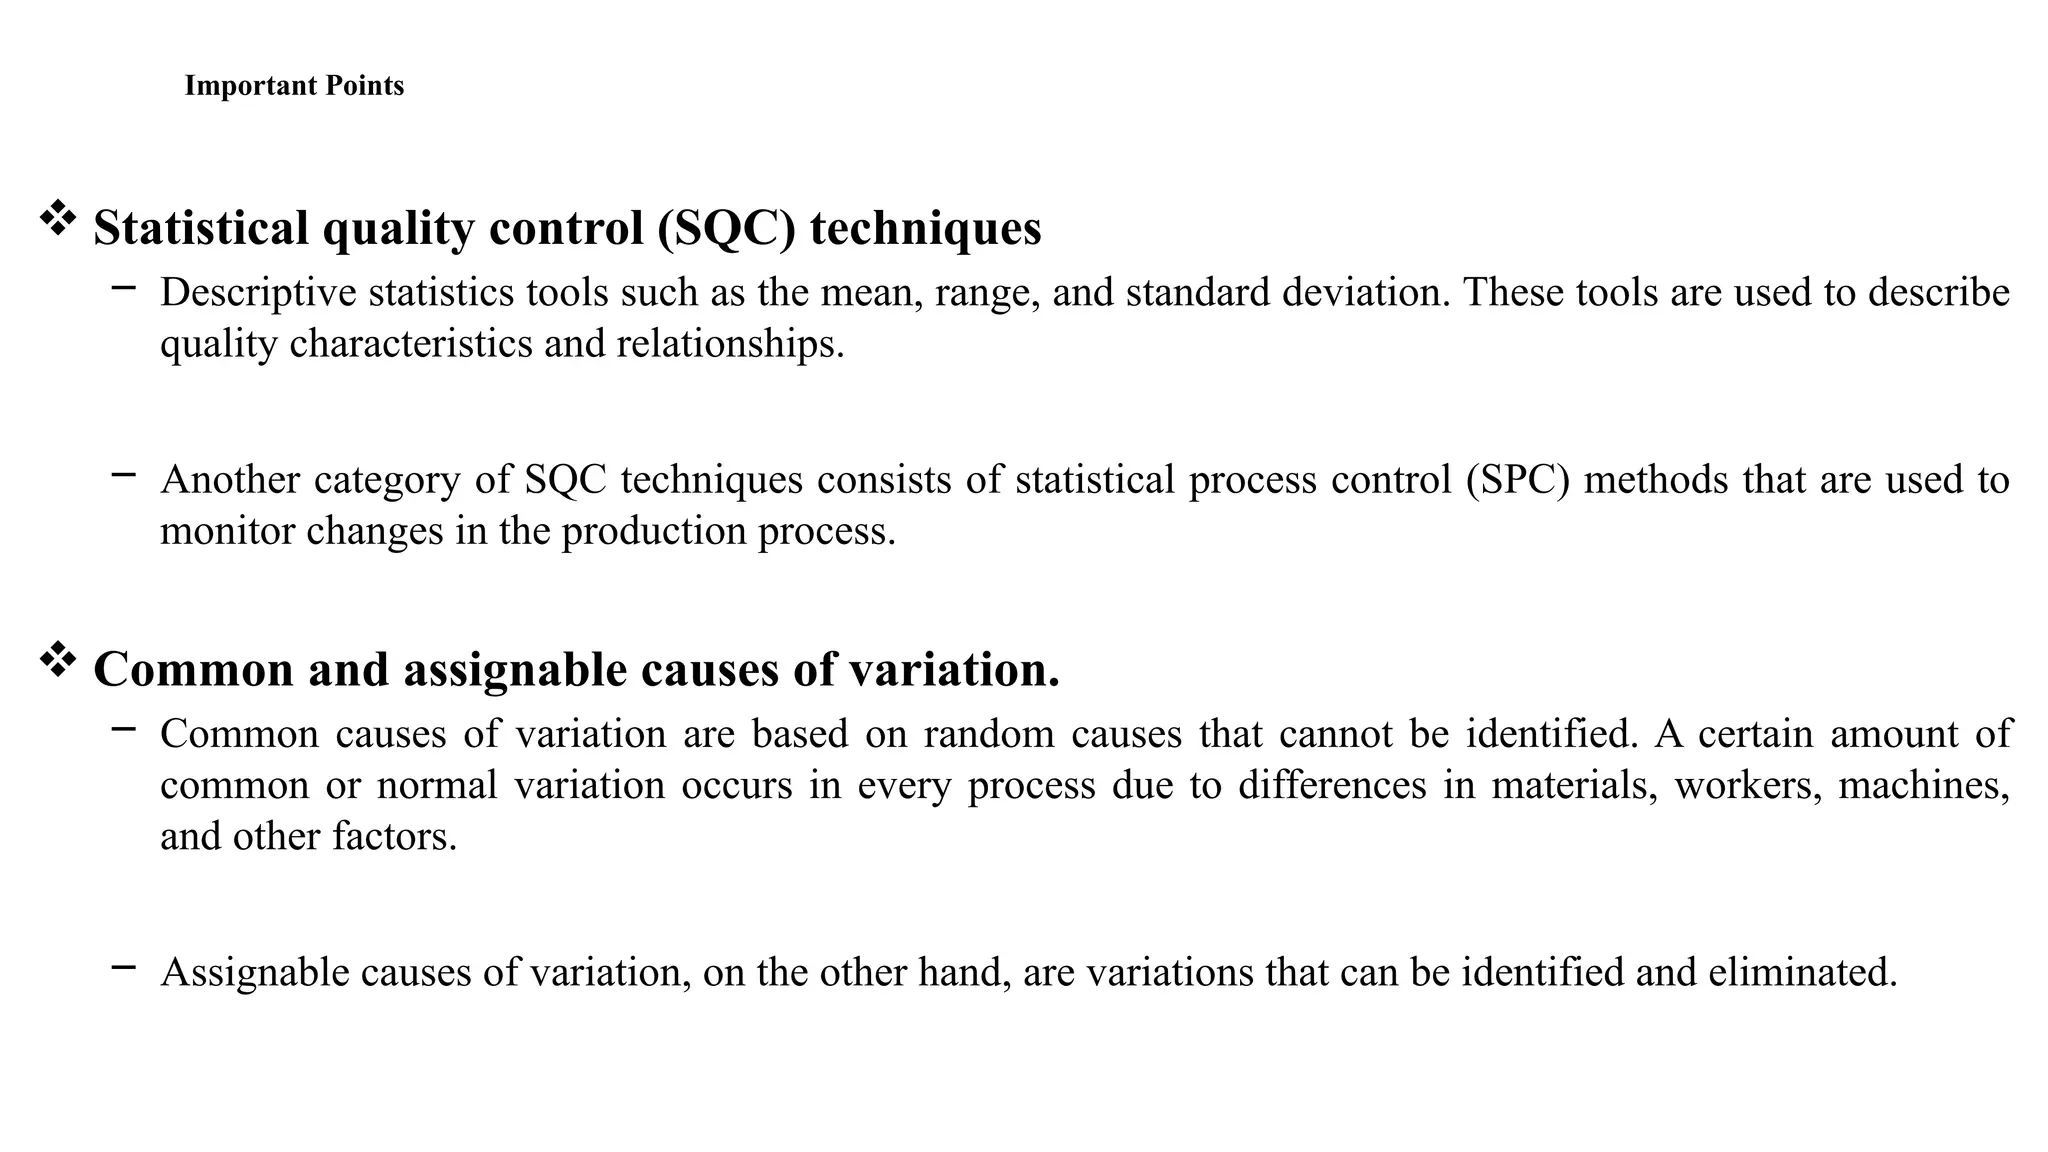
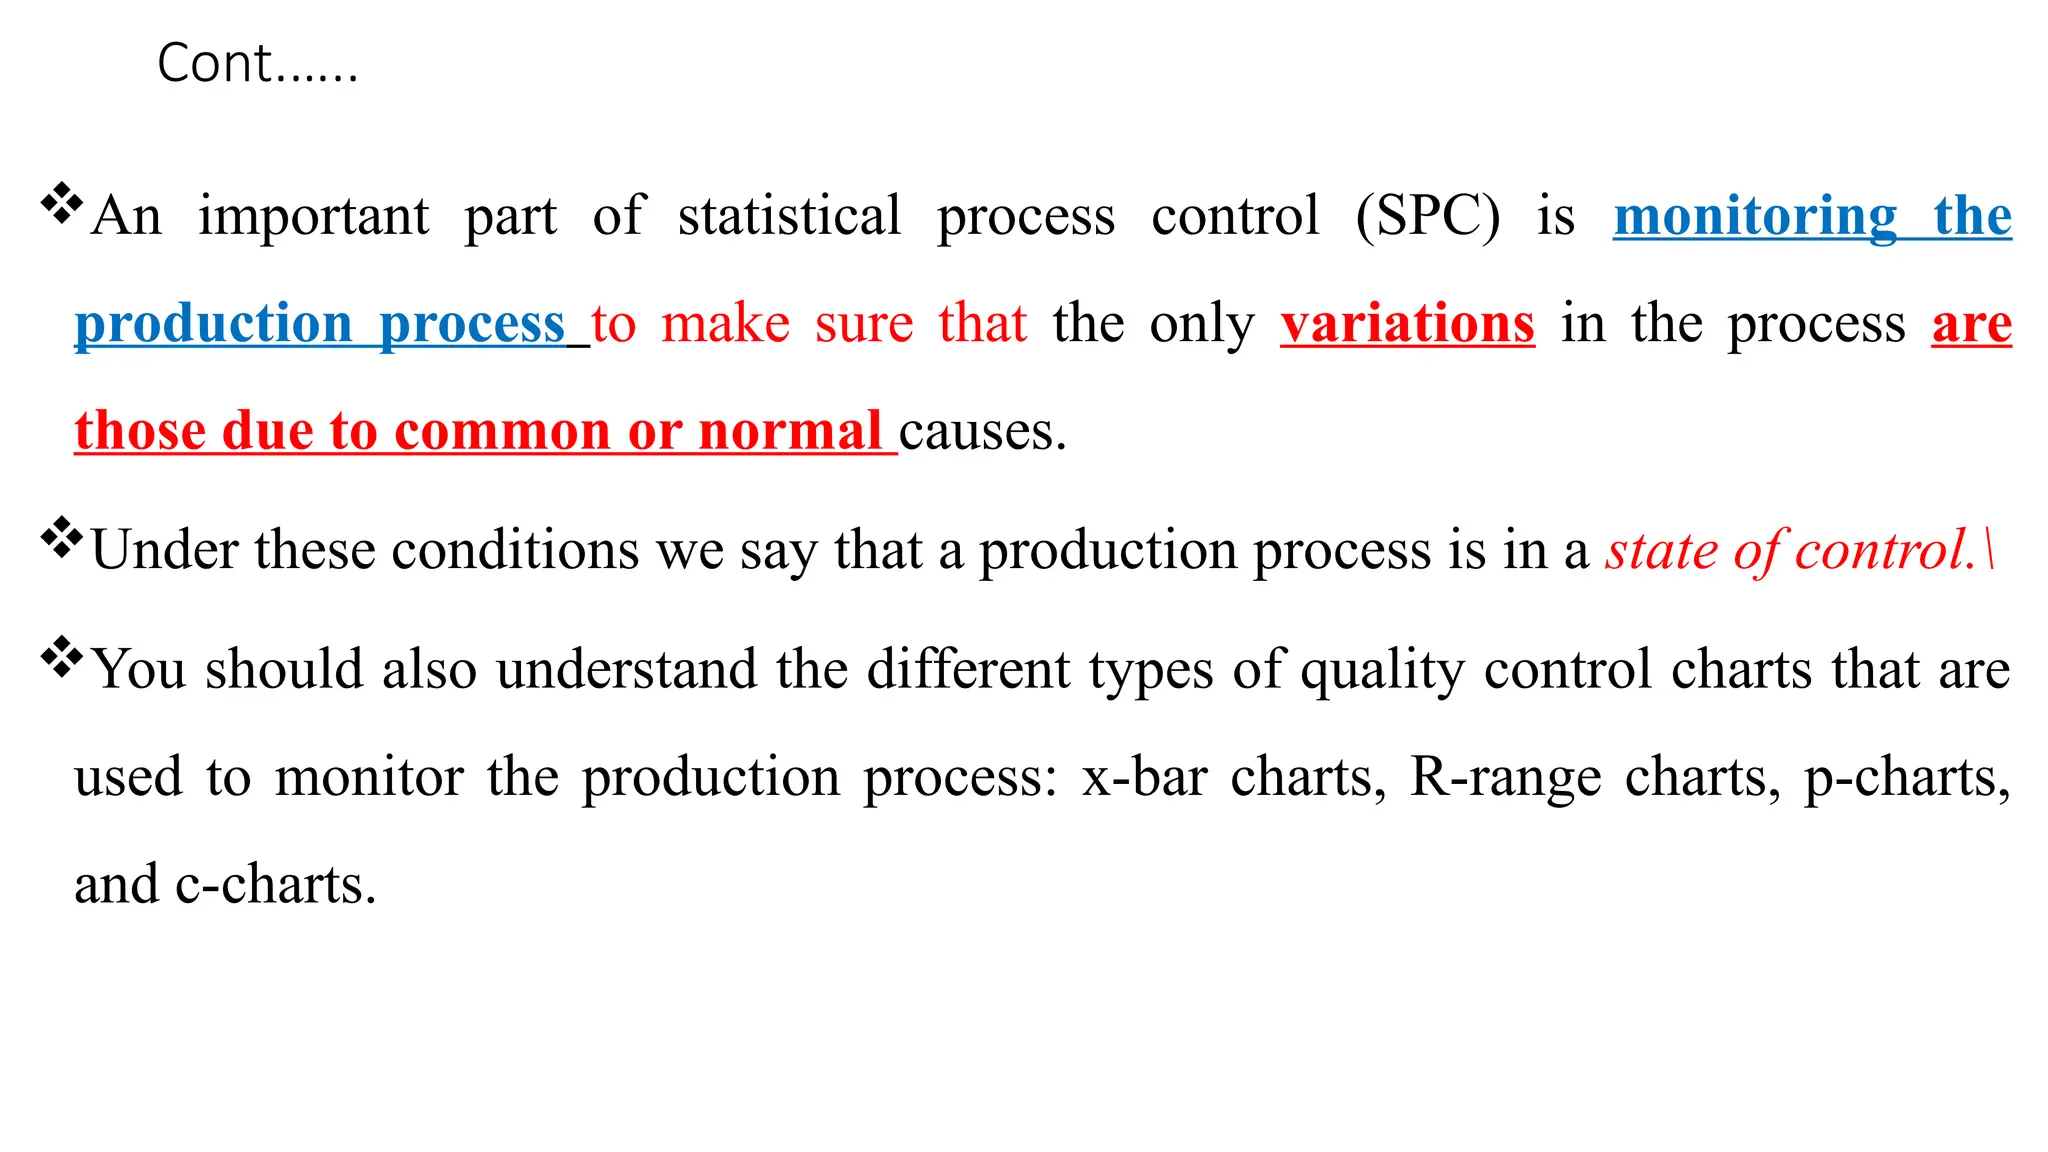
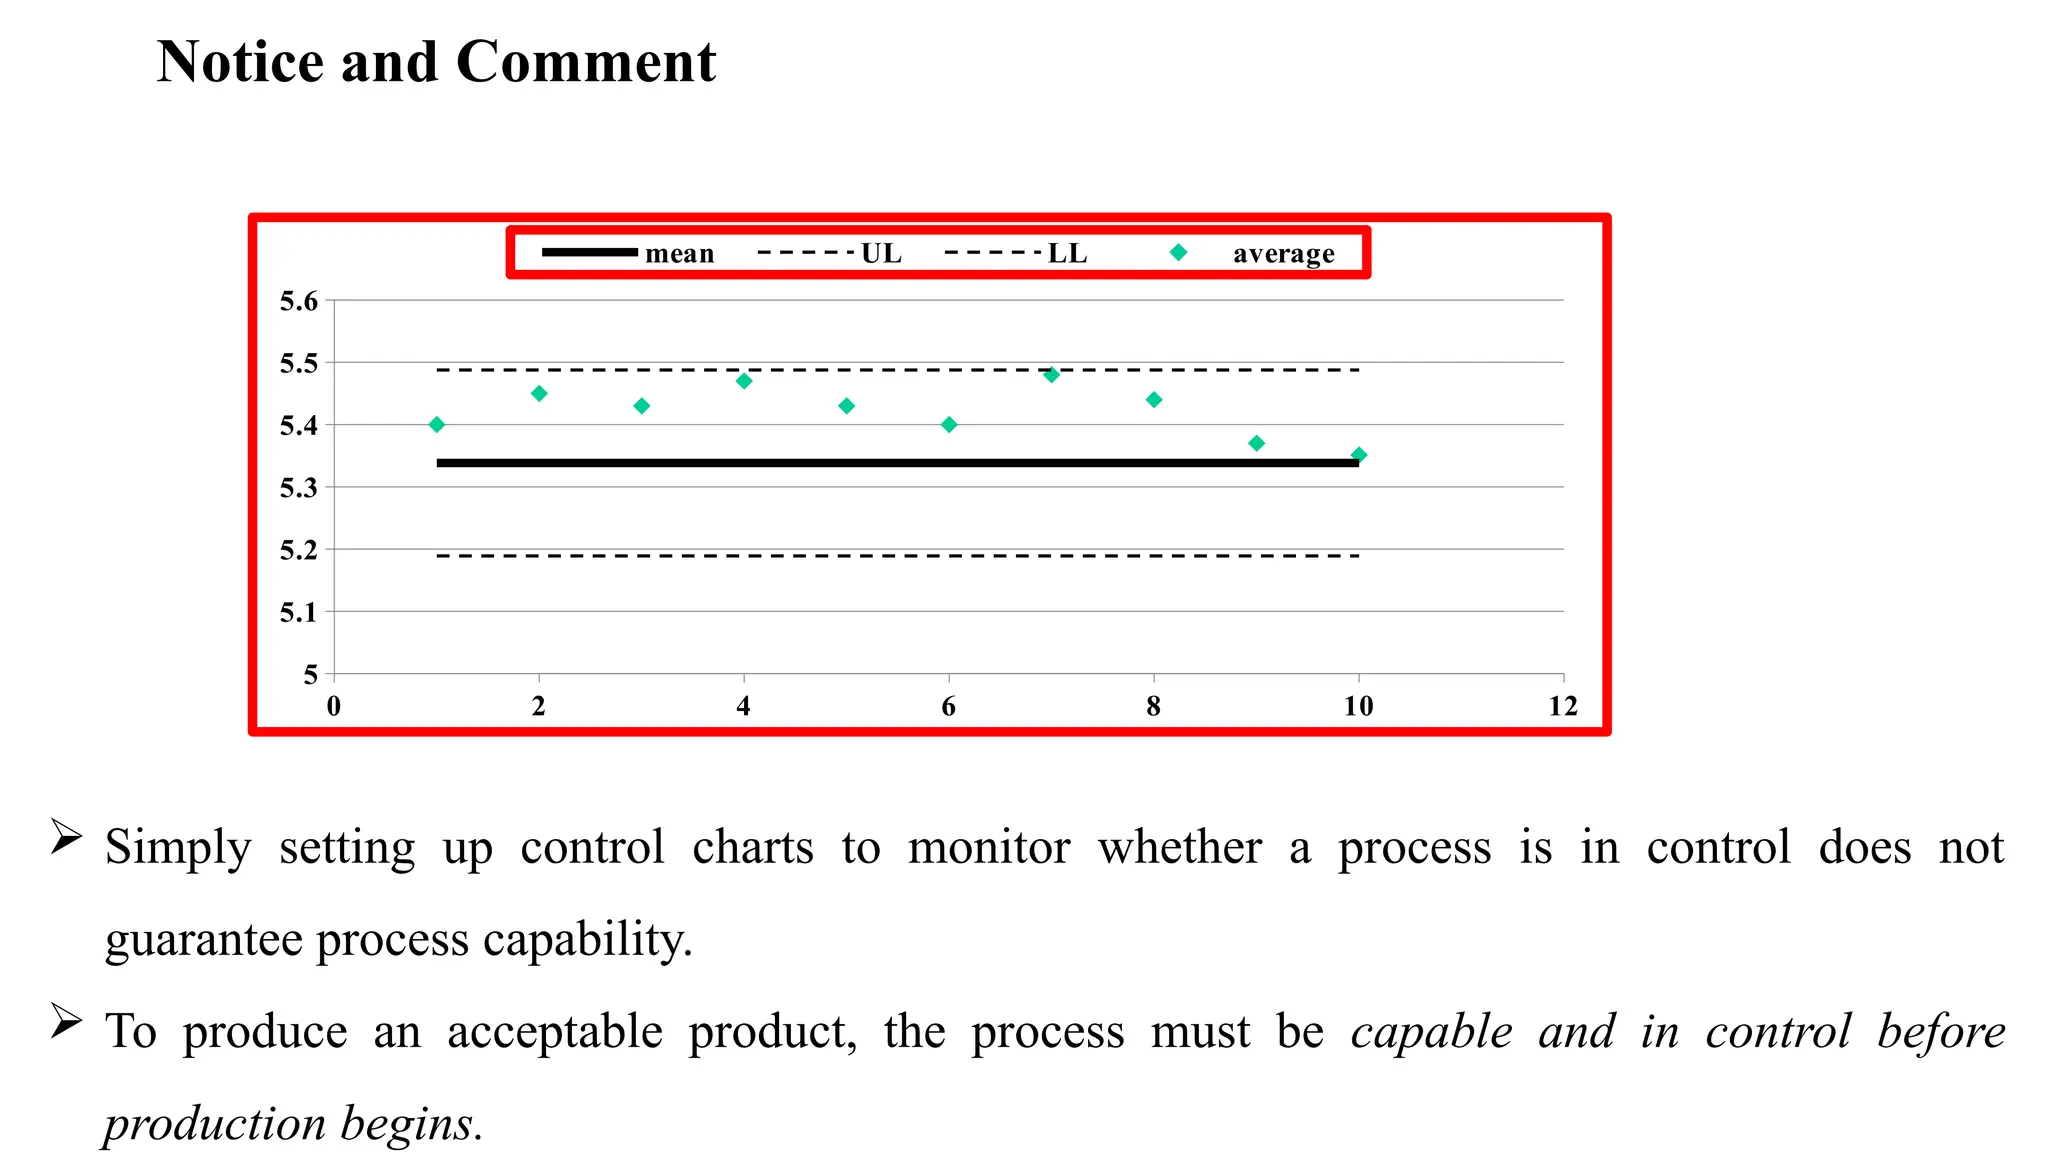
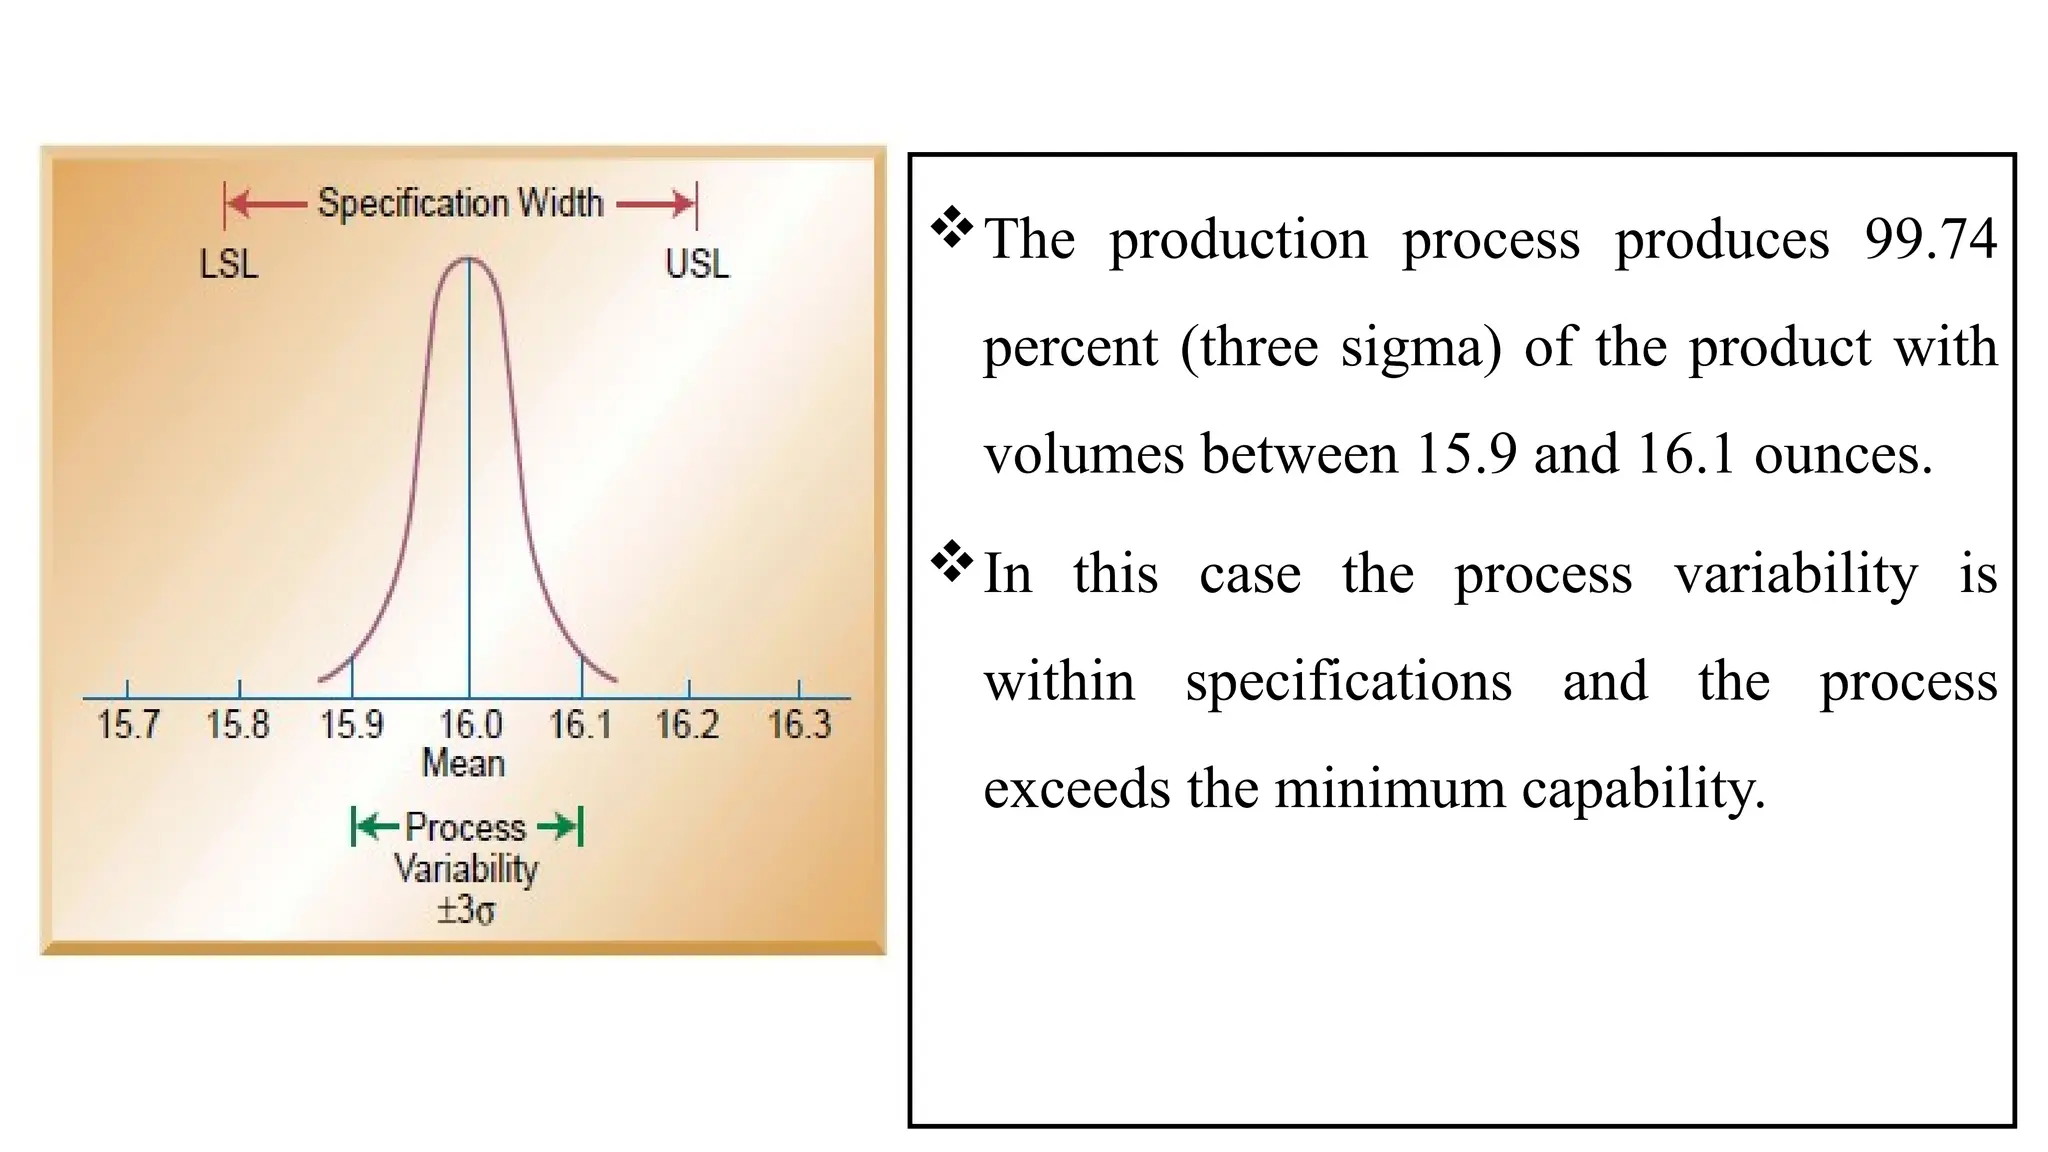
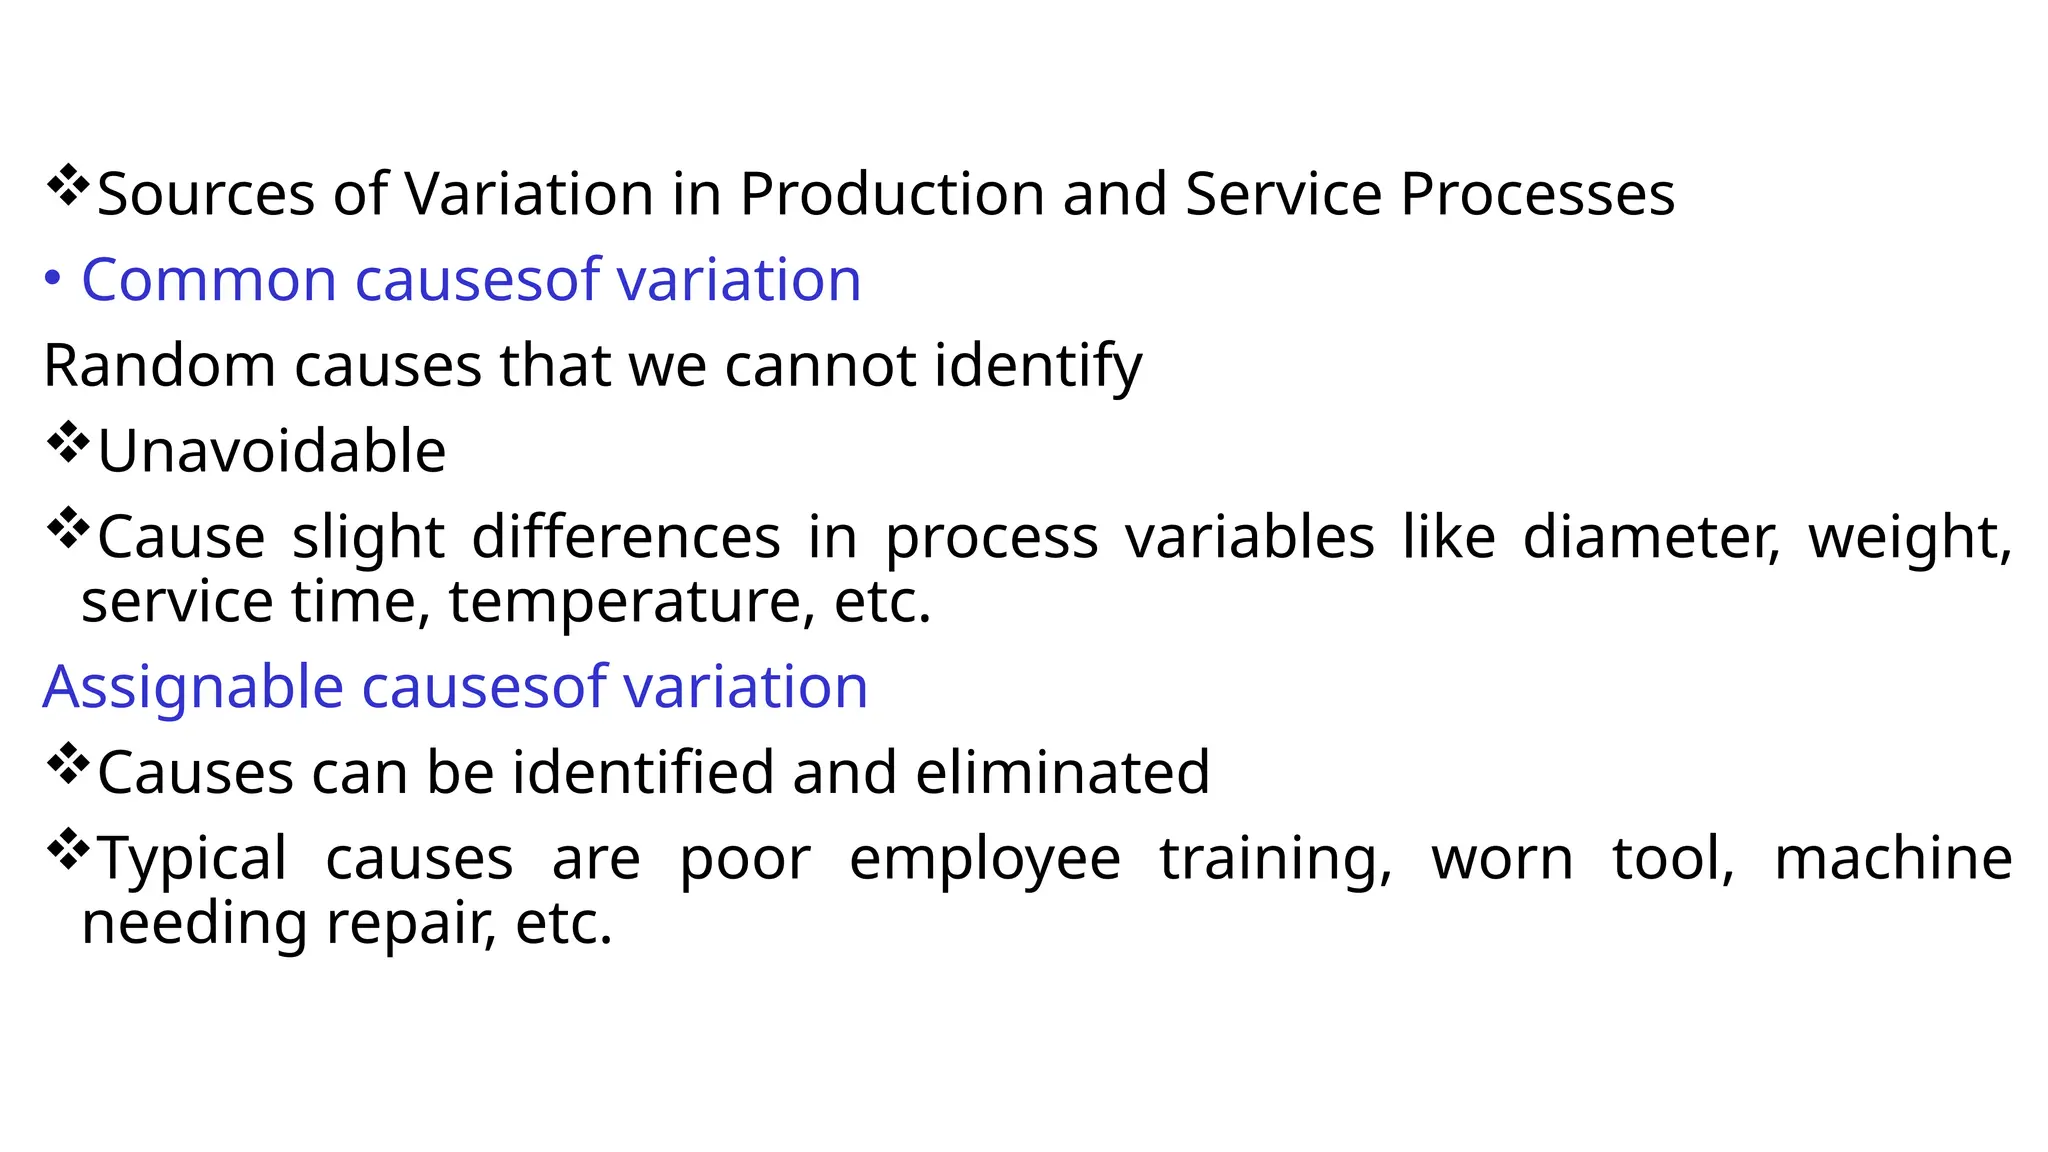
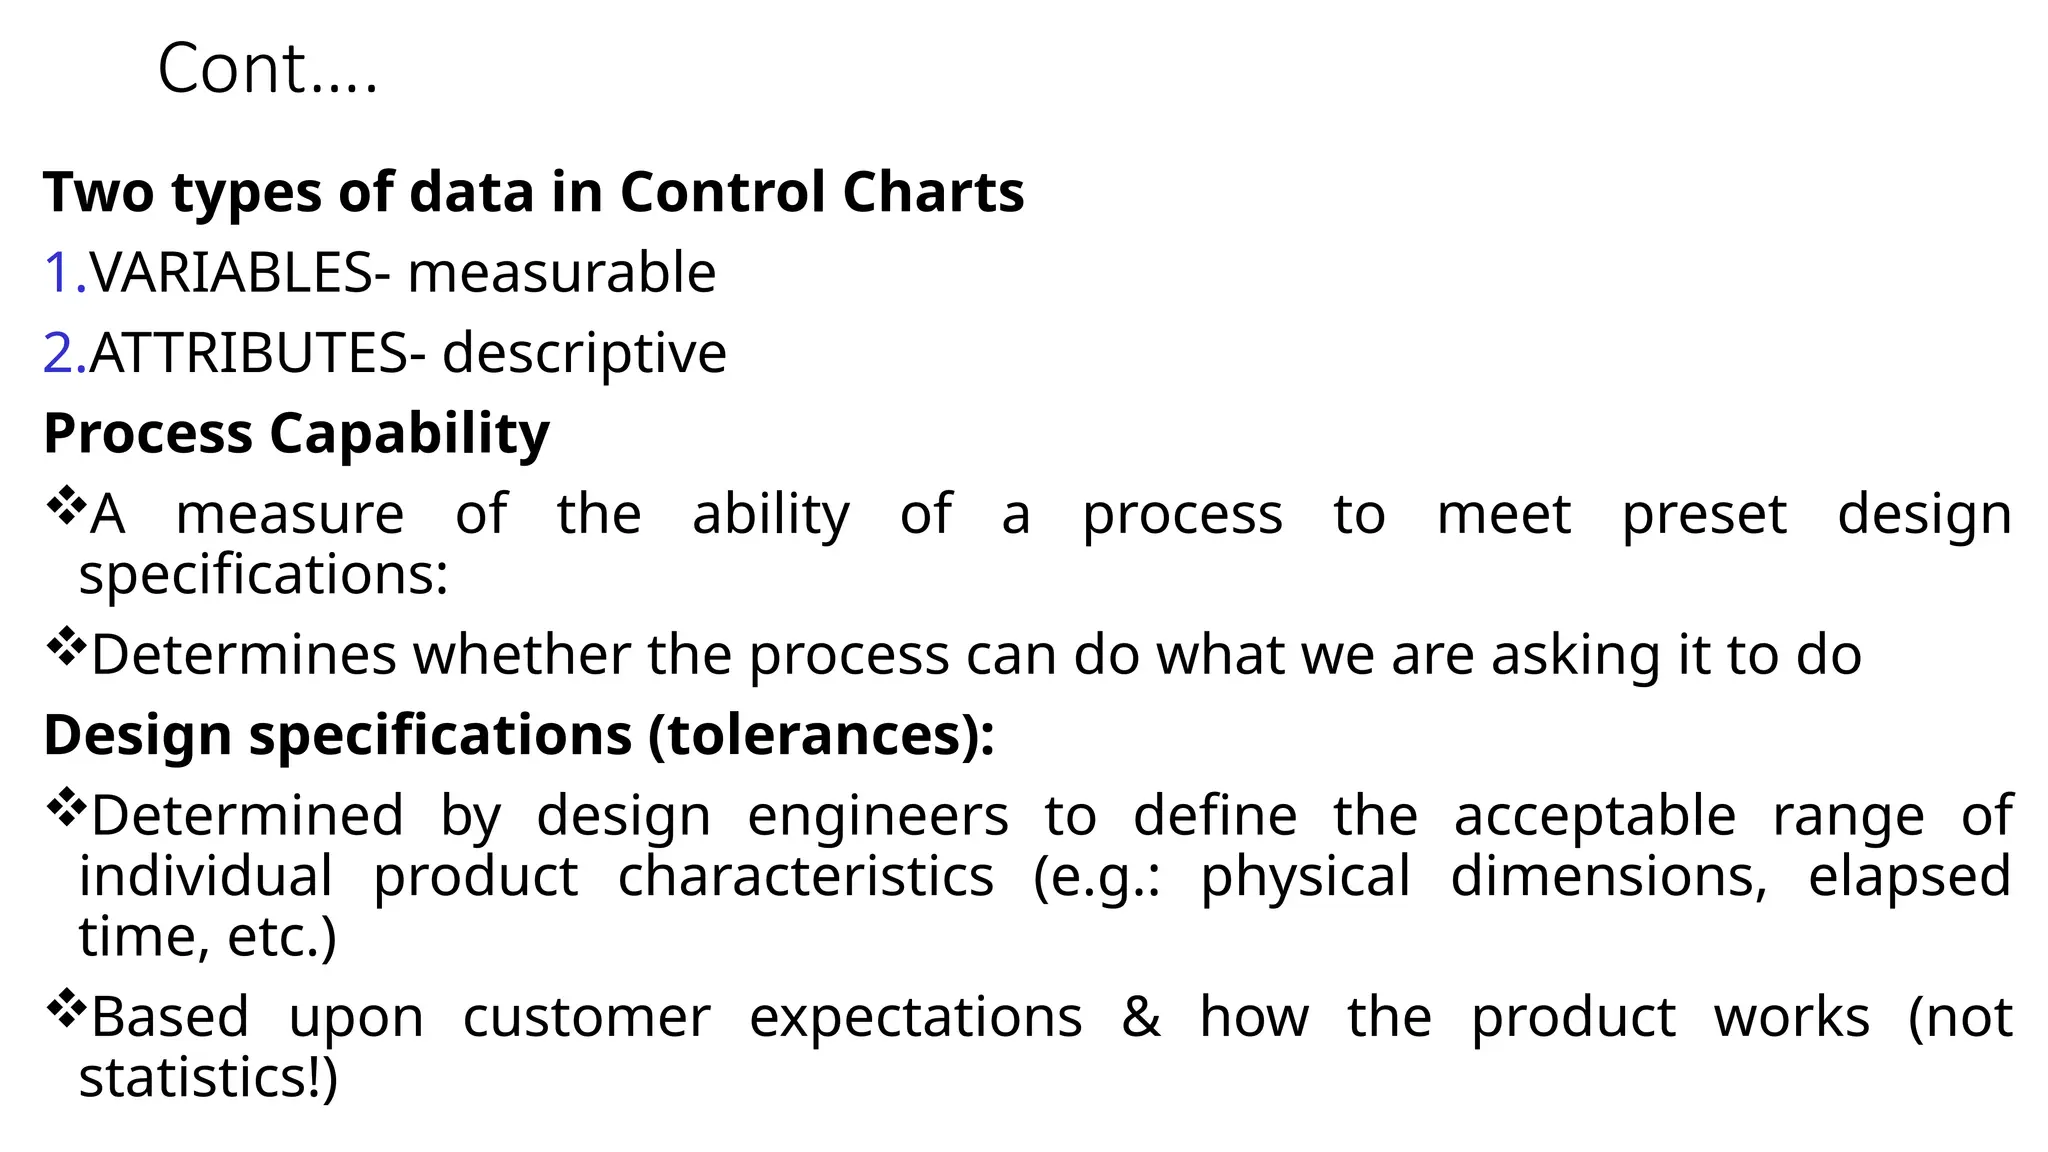
Statistical Quality
Control
Lecture 4
Important Points
 Statistical quality control (SQC) techniques
– Descriptive statistics tools such as the mean, range, and standard deviation. These tools are used to describe
quality characteristics and relationships.
– Another category of SQC techniques consists of statistical process control (SPC) methods that are used to
monitor changes in the production process.
 Common and assignable causes of variation.
– Common causes of variation are based on random causes that cannot be identified. A certain amount of
common or normal variation occurs in every process due to differences in materials, workers, machines,
and other factors.
– Assignable causes of variation, on the other hand, are variations that can be identified and eliminated.
Cont.…..
An important part of statistical process control (SPC) is monitoring the
production process to make sure that the only variations in the process are
those due to common or normal causes.
Under these conditions we say that a production process is in a state of control.
You should also understand the different types of quality control charts that are
used to monitor the production process: x-bar charts, R-range charts, p-charts,
and c-charts.
Notice and Comment
0 2 4 6 8 10 12
5
5.1
5.2
5.3
5.4
5.5
5.6
mean UL LL average
 Simply setting up control charts to monitor whether a process is in control does not
guarantee process capability.
 To produce an acceptable product, the process must be capable and in control before
production begins.
PROCESS CAPABILITY
A critical aspect of statistical quality control is evaluating the ability of a production process
to meet or exceed preset specifications. This is called process capability.
To understand exactly what this means, let’s look more closely at the term specification.
Product specifications, often called tolerances, are preset ranges of acceptable quality
characteristics, such as product dimensions.
 For a product to be considered acceptable, its characteristics must fall within this preset
range. Otherwise, the product is not acceptable.
Product specifications, or tolerance limits, are usually established by design engineers or
product design specialists.
Cont.…….
Process Capability
Product Specifications
Preset product or service dimensions, tolerances: bottle fill might be 16 oz. ±.2 oz. (15.8oz.-16.2oz.)
Based on how product is to be used or what the customer expects
Process Capability – Cp and Cpk
– Assessing capability involves evaluating process variability relative to preset product or service specifications
– Cp assumes that the process is centered in the specification range
– Cpk helps to address a possible lack of centering of the process
6σ
LSL
USL
width
process
width
ion
specificat
Cp








 


3σ
LSL
μ
,
3σ
μ
USL
min
Cpk
Cont.….
 The process produces 99.74 percent (three
sigma) of the product with volumes between
15.8 and 16.2 ounces.
 One can see that the process variability closely
matches the preset specifications. Almost all
the output falls within the preset specification
range.
Cont.….
• The process produces 99.74 percent (three
sigma) of the product with volumes between
15.7 and 16.3 ounces.
• The process variability is outside the preset
specifications. A large percentage of the product
will fall outside the specified limits.
• This means that the process is not capable of
producing the product within the preset
specifications.
The production process produces 99.74
percent (three sigma) of the product with
volumes between 15.9 and 16.1 ounces.
In this case the process variability is
within specifications and the process
exceeds the minimum capability.
Process Capability
 When the process is operating under control, we are often required to obtain some
information about the performance or capability of the process.
 The basis of control charts is to checking whether the variation in the magnitude of
a given characteristic of a manufactured product is arising due to random variation
or assignable variation.
Random variation: Natural variation or allowable variation, small magnitude
Assignable variation: Non-random variation or preventable variation, relatively
high magnitude.
 If the variation is arising due to random variation, the process is said to be under
control. But, if the variation is arising due to assignable variation then the process is
said to be out of control.
Cont.…..
Process capability refers to the uniformity of the process. The variability
in the process is a measure of uniformity of the output. There are two
ways to think about this variability.
 Natural or inherent variability at a specified time,
 Variability over time.
Techniques for Process Capability Analysis :
Techniques for Process Capability Analysis
Histogram
Probability Plot
Control Charts
 The aim of statistical process control is to stabilize the processes and then
improve it.
 According to Deming " A process has no measurable capability unless it is
statistical control".
 Thus, stability of a process has to be achieved before measuring process
capability and prediction of future outcomes
Sources of Variation in Production and Service Processes
• Common causesof variation
Random causes that we cannot identify
Unavoidable
Cause slight differences in process variables like diameter, weight,
service time, temperature, etc.
Assignable causesof variation
Causes can be identified and eliminated
Typical causes are poor employee training, worn tool, machine
needing repair, etc.
Cont….
Two types of data in Control Charts
1.VARIABLES- measurable
2.ATTRIBUTES- descriptive
Process Capability
A measure of the ability of a process to meet preset design
specifications:
Determines whether the process can do what we are asking it to do
Design specifications (tolerances):
Determined by design engineers to define the acceptable range of
individual product characteristics (e.g.: physical dimensions, elapsed
time, etc.)
Based upon customer expectations & how the product works (not
statistics!)
process capablity.pptx Twill weave is durable

process capablity.pptx Twill weave is durable

  • 1.
  • 2.
    Important Points  Statisticalquality control (SQC) techniques – Descriptive statistics tools such as the mean, range, and standard deviation. These tools are used to describe quality characteristics and relationships. – Another category of SQC techniques consists of statistical process control (SPC) methods that are used to monitor changes in the production process.  Common and assignable causes of variation. – Common causes of variation are based on random causes that cannot be identified. A certain amount of common or normal variation occurs in every process due to differences in materials, workers, machines, and other factors. – Assignable causes of variation, on the other hand, are variations that can be identified and eliminated.
  • 3.
    Cont.….. An important partof statistical process control (SPC) is monitoring the production process to make sure that the only variations in the process are those due to common or normal causes. Under these conditions we say that a production process is in a state of control. You should also understand the different types of quality control charts that are used to monitor the production process: x-bar charts, R-range charts, p-charts, and c-charts.
  • 4.
    Notice and Comment 02 4 6 8 10 12 5 5.1 5.2 5.3 5.4 5.5 5.6 mean UL LL average  Simply setting up control charts to monitor whether a process is in control does not guarantee process capability.  To produce an acceptable product, the process must be capable and in control before production begins.
  • 5.
    PROCESS CAPABILITY A criticalaspect of statistical quality control is evaluating the ability of a production process to meet or exceed preset specifications. This is called process capability. To understand exactly what this means, let’s look more closely at the term specification. Product specifications, often called tolerances, are preset ranges of acceptable quality characteristics, such as product dimensions.  For a product to be considered acceptable, its characteristics must fall within this preset range. Otherwise, the product is not acceptable. Product specifications, or tolerance limits, are usually established by design engineers or product design specialists.
  • 6.
  • 7.
    Process Capability Product Specifications Presetproduct or service dimensions, tolerances: bottle fill might be 16 oz. ±.2 oz. (15.8oz.-16.2oz.) Based on how product is to be used or what the customer expects Process Capability – Cp and Cpk – Assessing capability involves evaluating process variability relative to preset product or service specifications – Cp assumes that the process is centered in the specification range – Cpk helps to address a possible lack of centering of the process 6σ LSL USL width process width ion specificat Cp             3σ LSL μ , 3σ μ USL min Cpk
  • 8.
    Cont.….  The processproduces 99.74 percent (three sigma) of the product with volumes between 15.8 and 16.2 ounces.  One can see that the process variability closely matches the preset specifications. Almost all the output falls within the preset specification range.
  • 9.
    Cont.…. • The processproduces 99.74 percent (three sigma) of the product with volumes between 15.7 and 16.3 ounces. • The process variability is outside the preset specifications. A large percentage of the product will fall outside the specified limits. • This means that the process is not capable of producing the product within the preset specifications.
  • 10.
    The production processproduces 99.74 percent (three sigma) of the product with volumes between 15.9 and 16.1 ounces. In this case the process variability is within specifications and the process exceeds the minimum capability.
  • 14.
    Process Capability  Whenthe process is operating under control, we are often required to obtain some information about the performance or capability of the process.  The basis of control charts is to checking whether the variation in the magnitude of a given characteristic of a manufactured product is arising due to random variation or assignable variation. Random variation: Natural variation or allowable variation, small magnitude Assignable variation: Non-random variation or preventable variation, relatively high magnitude.  If the variation is arising due to random variation, the process is said to be under control. But, if the variation is arising due to assignable variation then the process is said to be out of control.
  • 15.
    Cont.….. Process capability refersto the uniformity of the process. The variability in the process is a measure of uniformity of the output. There are two ways to think about this variability.  Natural or inherent variability at a specified time,  Variability over time.
  • 16.
    Techniques for ProcessCapability Analysis : Techniques for Process Capability Analysis Histogram Probability Plot Control Charts  The aim of statistical process control is to stabilize the processes and then improve it.  According to Deming " A process has no measurable capability unless it is statistical control".  Thus, stability of a process has to be achieved before measuring process capability and prediction of future outcomes
  • 17.
    Sources of Variationin Production and Service Processes • Common causesof variation Random causes that we cannot identify Unavoidable Cause slight differences in process variables like diameter, weight, service time, temperature, etc. Assignable causesof variation Causes can be identified and eliminated Typical causes are poor employee training, worn tool, machine needing repair, etc.
  • 18.
    Cont…. Two types ofdata in Control Charts 1.VARIABLES- measurable 2.ATTRIBUTES- descriptive Process Capability A measure of the ability of a process to meet preset design specifications: Determines whether the process can do what we are asking it to do Design specifications (tolerances): Determined by design engineers to define the acceptable range of individual product characteristics (e.g.: physical dimensions, elapsed time, etc.) Based upon customer expectations & how the product works (not statistics!)