Process involves a quality characteristics that follows a
normal distribution with mean μ, and standard deviation, σ. The upper
and lower natural tolerance limits of the process are:
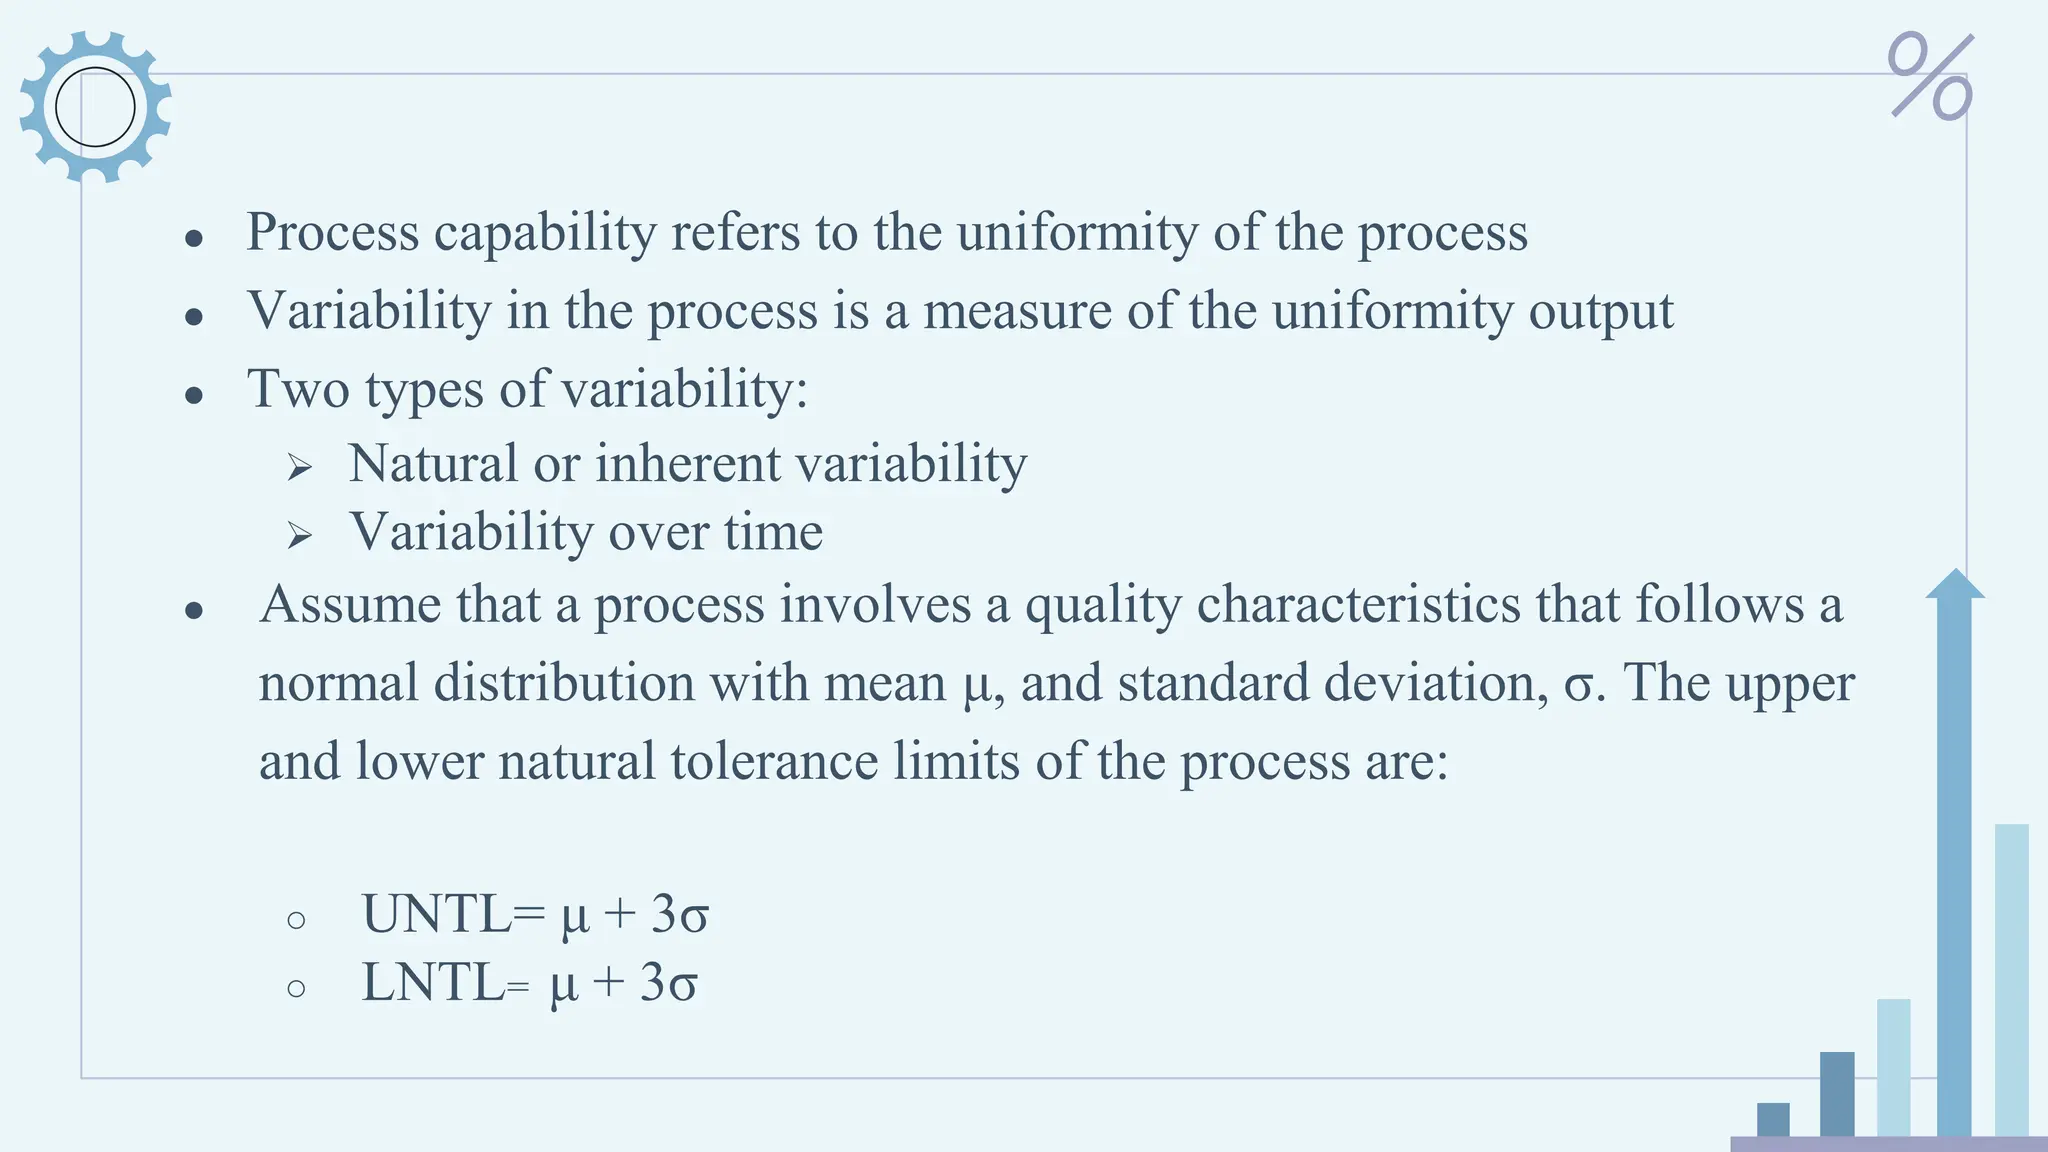
● Process capabilityrefers to the uniformity of the process
● Variability in the process is a measure of the uniformity output
● Two types of variability:
➢ Natural or inherent variability
➢ Variability over time
● Assume that a process involves a quality characteristics that follows a
normal distribution with mean μ, and standard deviation, σ. The upper
and lower natural tolerance limits of the process are:
○ UNTL= μ + 3σ
○ LNTL= μ + 3σ
3.
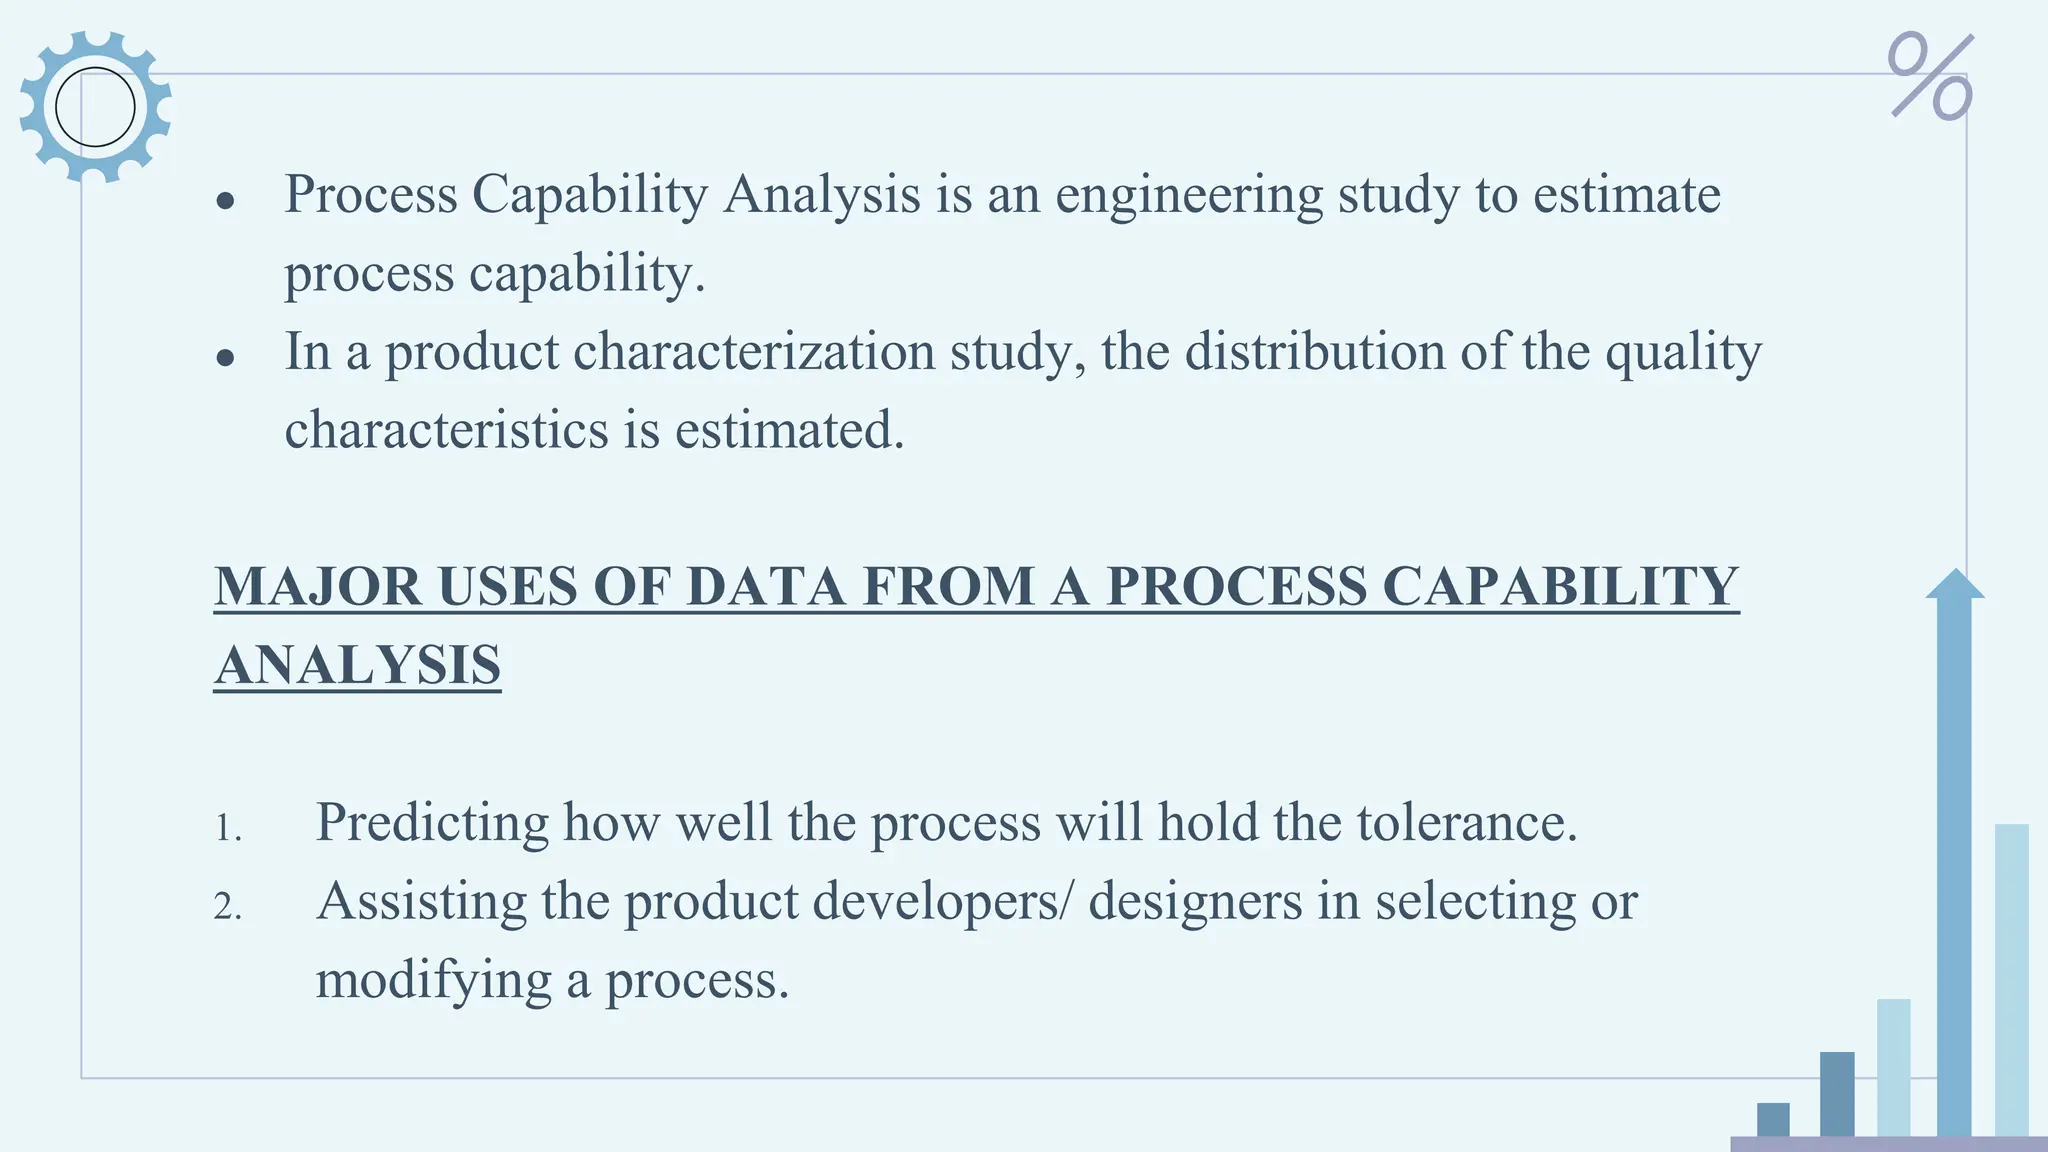
● Process CapabilityAnalysis is an engineering study to estimate
process capability.
● In a product characterization study, the distribution of the quality
characteristics is estimated.
MAJOR USES OF DATA FROM A PROCESS CAPABILITY
ANALYSIS
1. Predicting how well the process will hold the tolerance.
2. Assisting the product developers/ designers in selecting or
modifying a process.
4.
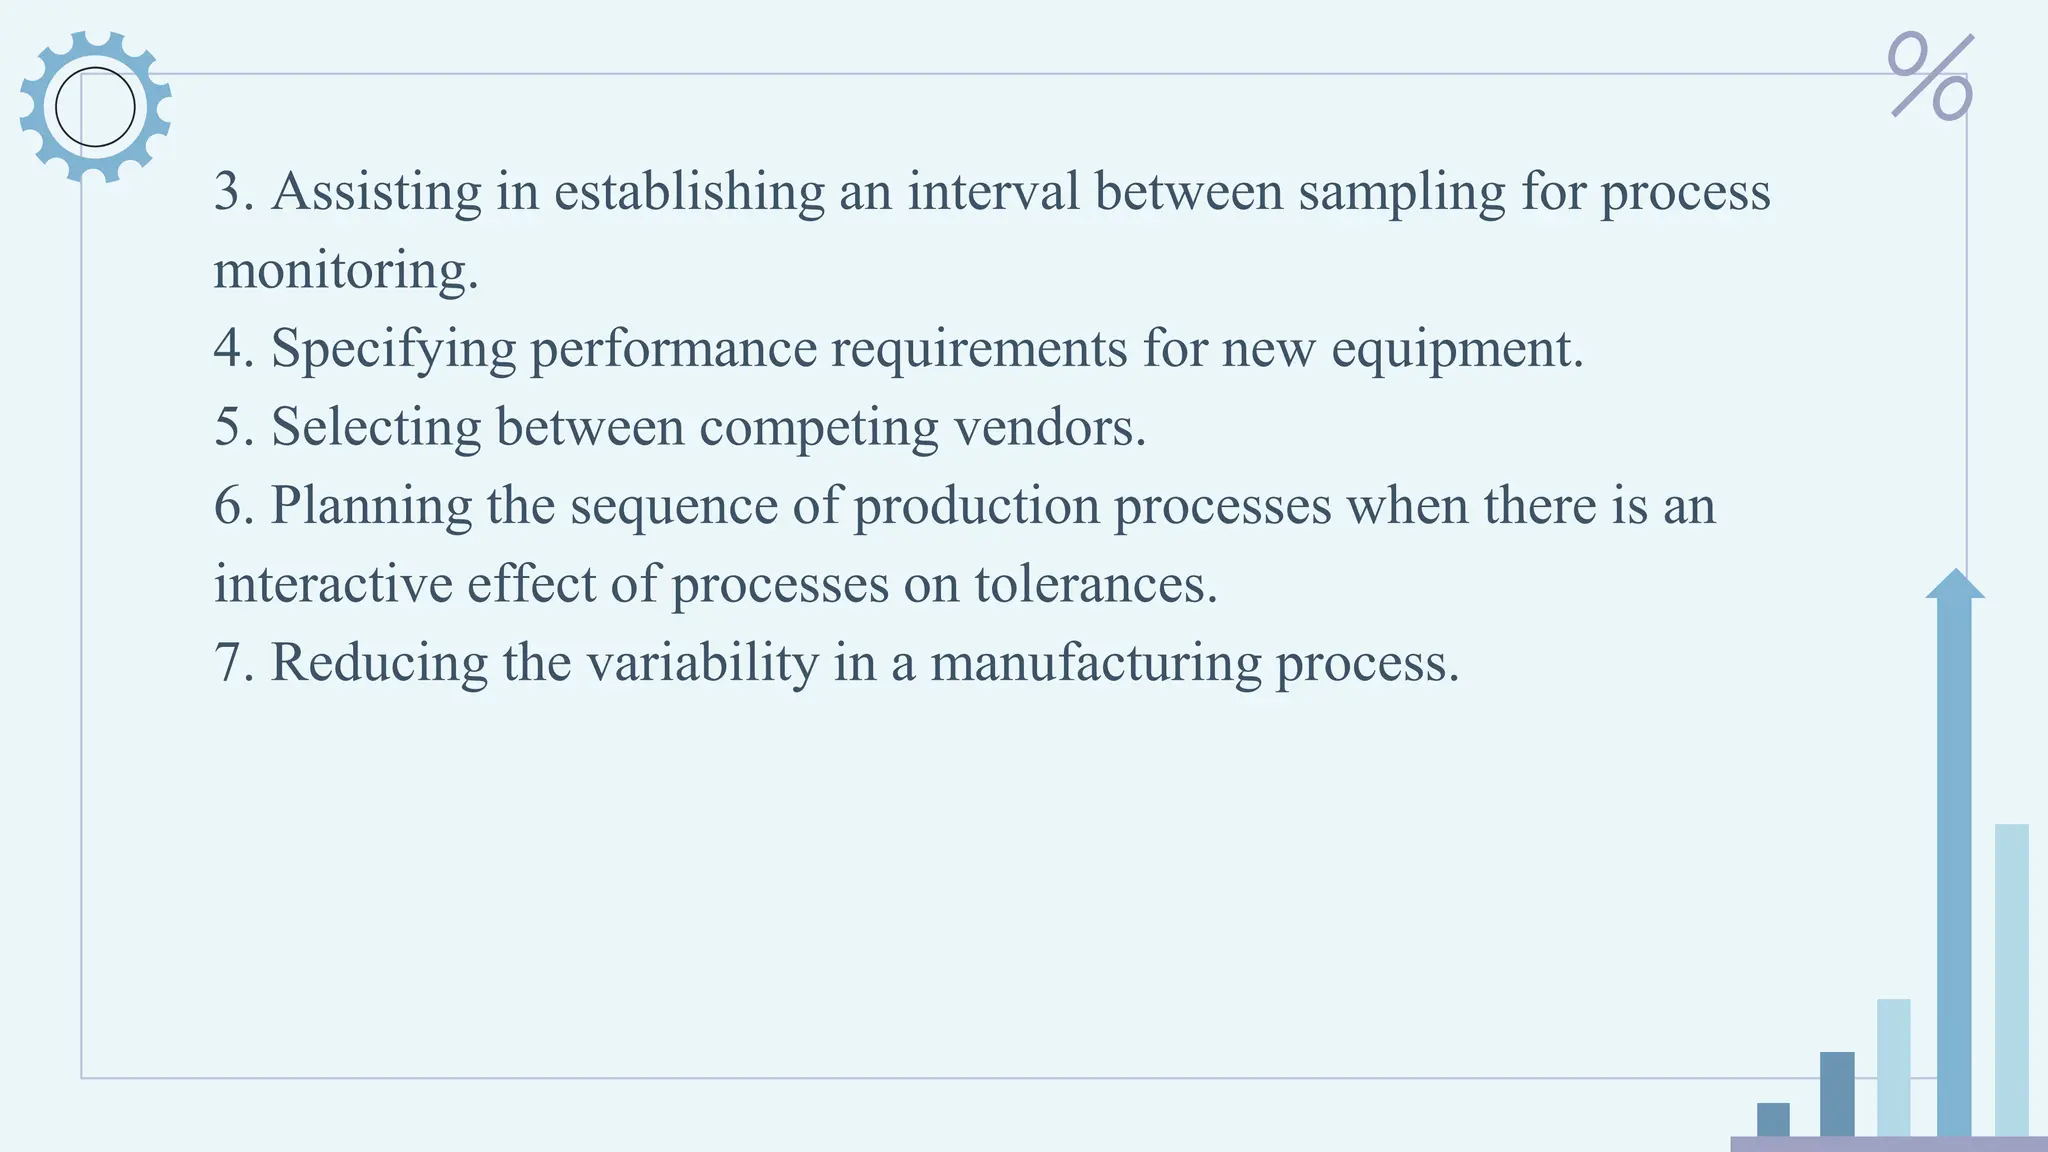
3. Assisting inestablishing an interval between sampling for process
monitoring.
4. Specifying performance requirements for new equipment.
5. Selecting between competing vendors.
6. Planning the sequence of production processes when there is an
interactive effect of processes on tolerances.
7. Reducing the variability in a manufacturing process.
5.
TECHNIQUES USED INPROCESS CAPABILITY ANALYSIS
● Histogram
● Control Charts
● Designed Experiments
6.
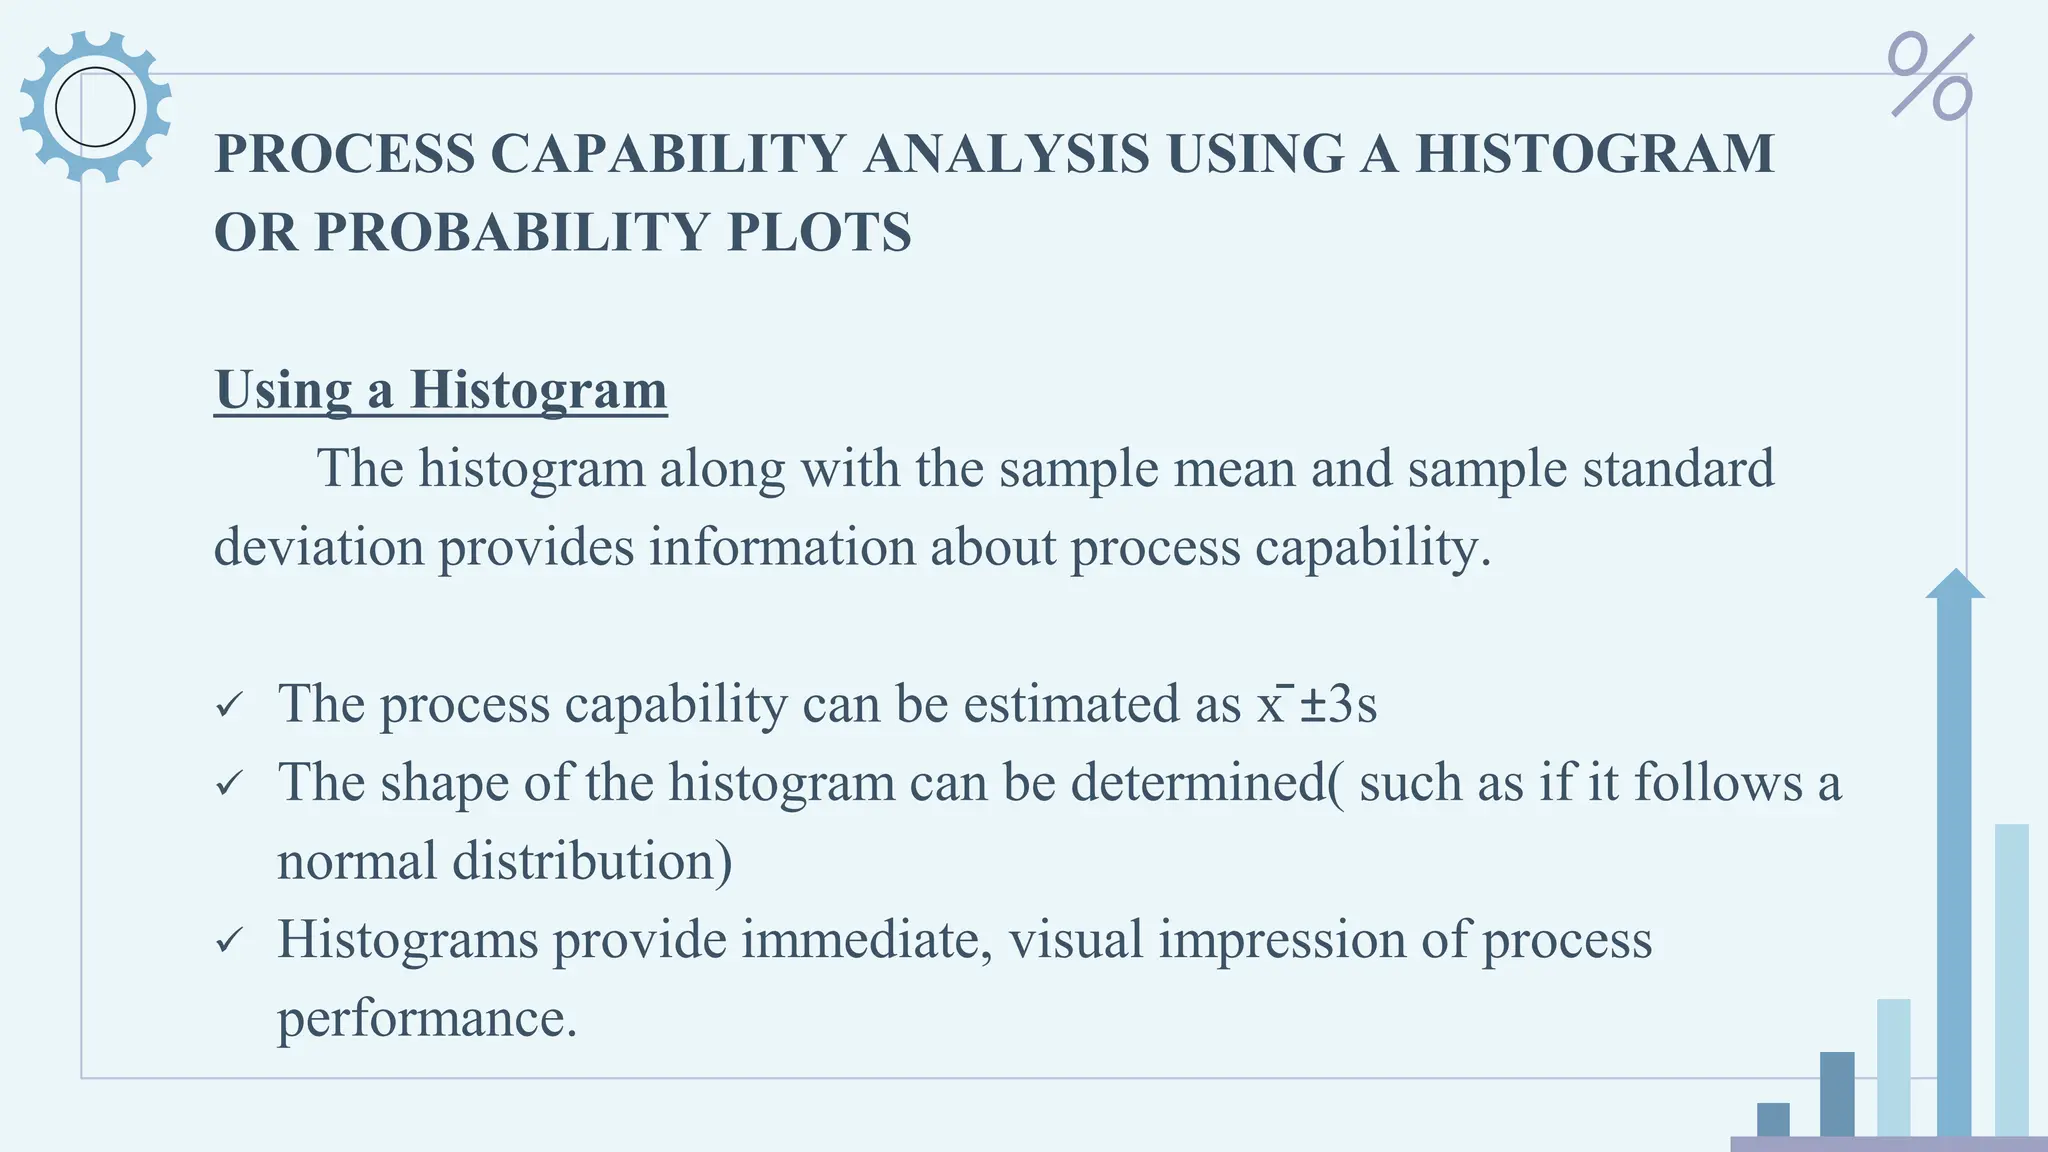
PROCESS CAPABILITY ANALYSISUSING A HISTOGRAM
OR PROBABILITY PLOTS
Using a Histogram
The histogram along with the sample mean and sample standard
deviation provides information about process capability.
✓ The process capability can be estimated as x̄ ±3s
✓ The shape of the histogram can be determined( such as if it follows a
normal distribution)
✓ Histograms provide immediate, visual impression of process
performance.
7.
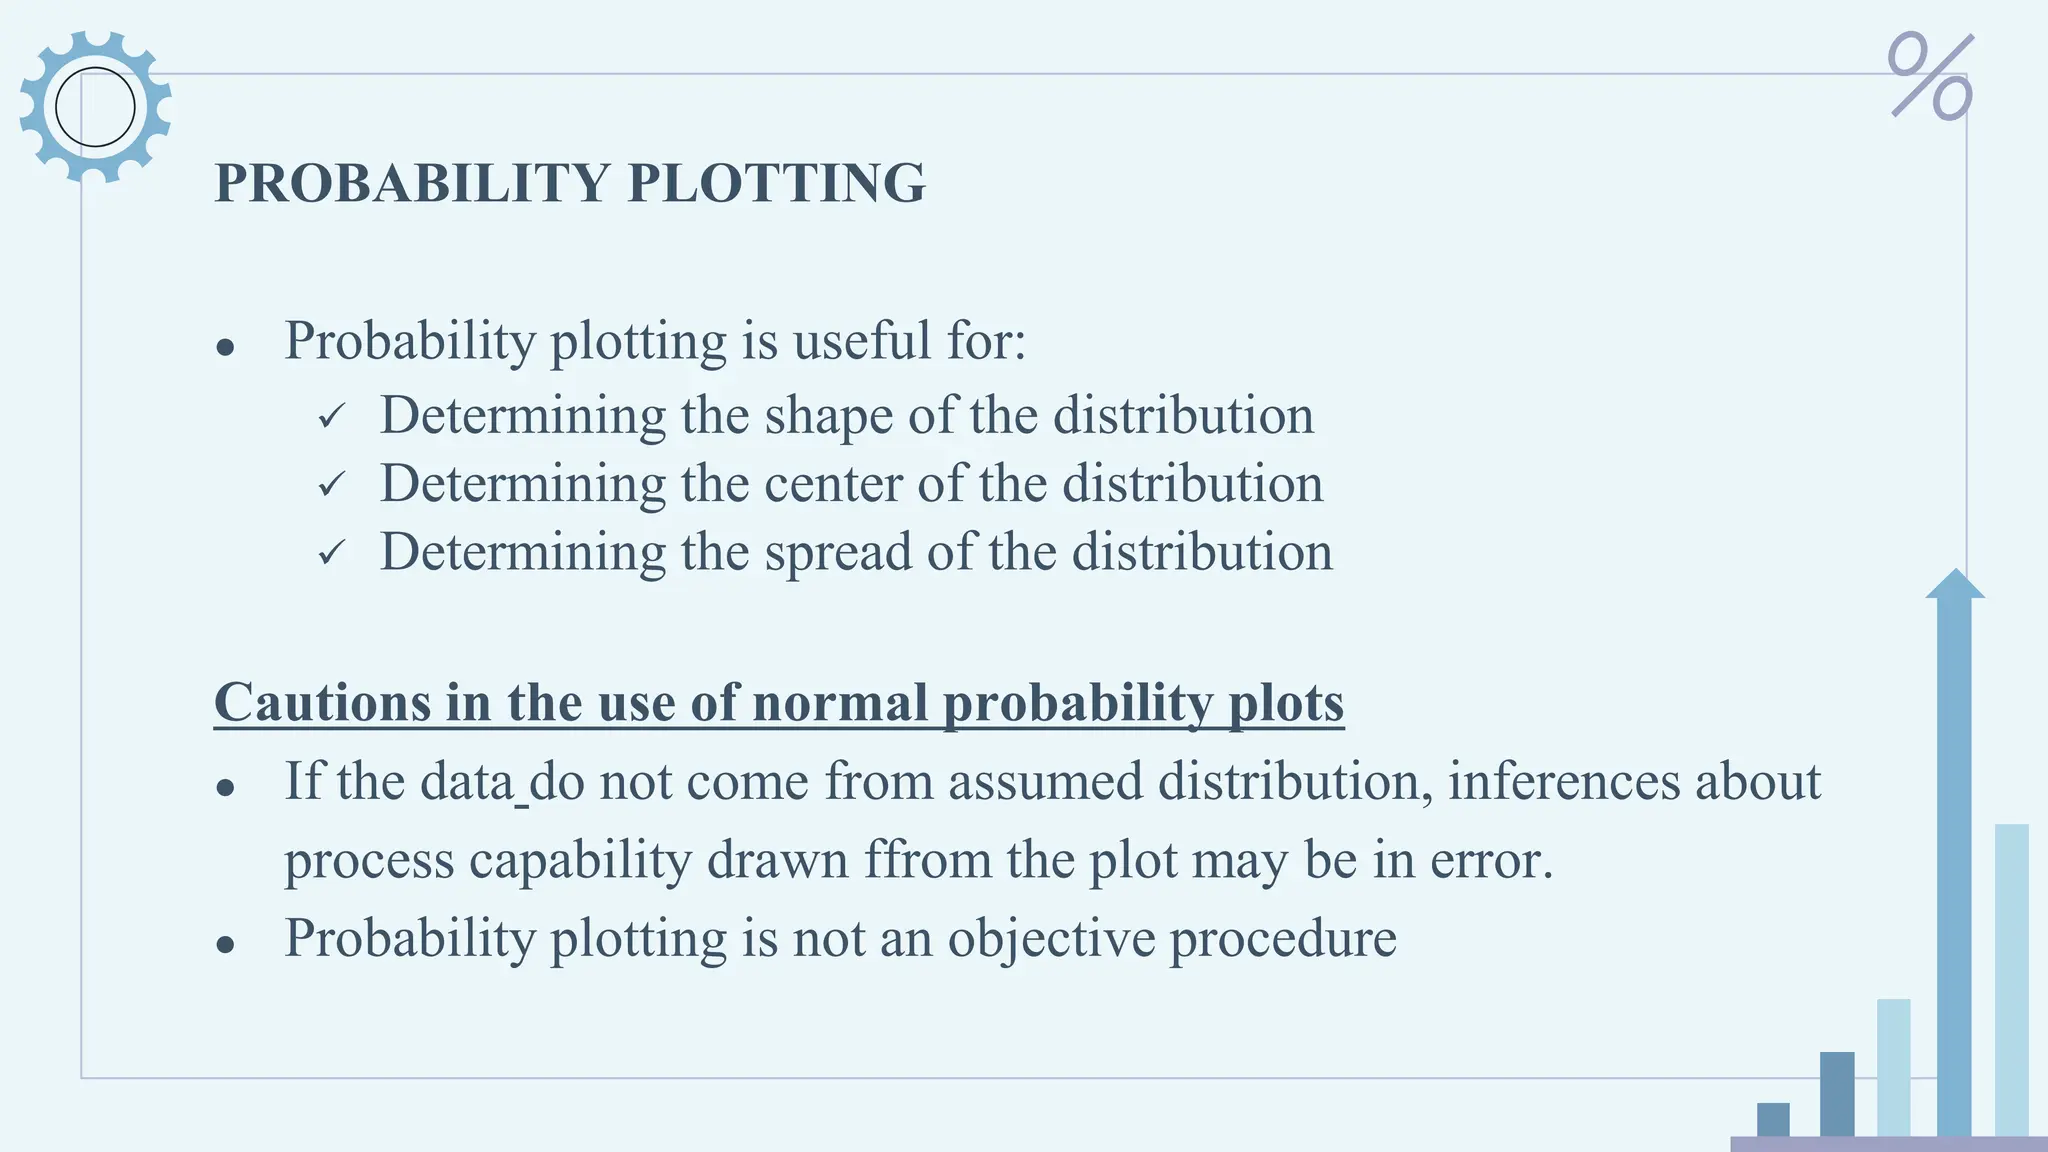
PROBABILITY PLOTTING
● Probabilityplotting is useful for:
✓ Determining the shape of the distribution
✓ Determining the center of the distribution
✓ Determining the spread of the distribution
Cautions in the use of normal probability plots
● If the data do not come from assumed distribution, inferences about
process capability drawn ffrom the plot may be in error.
● Probability plotting is not an objective procedure
8.
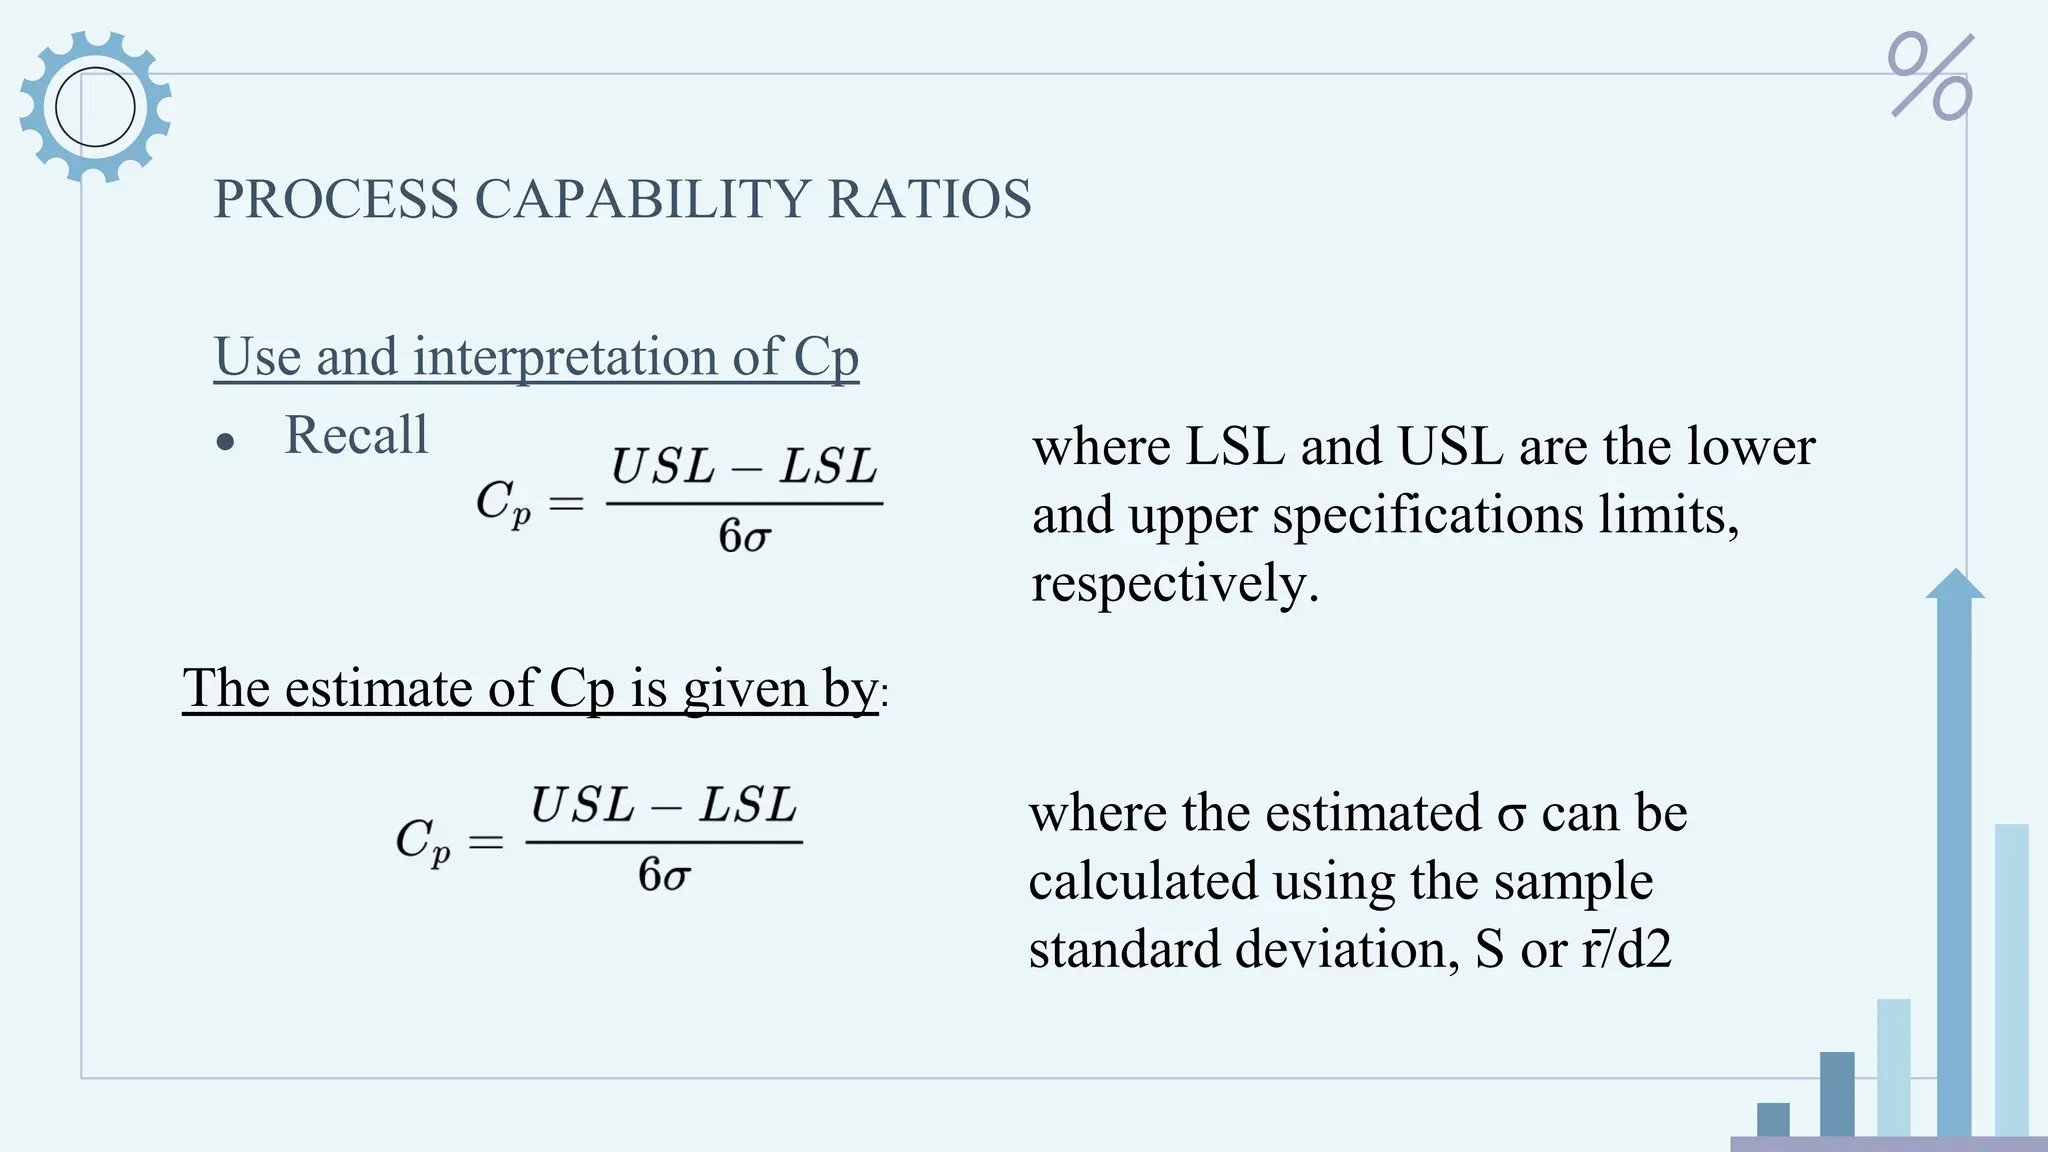
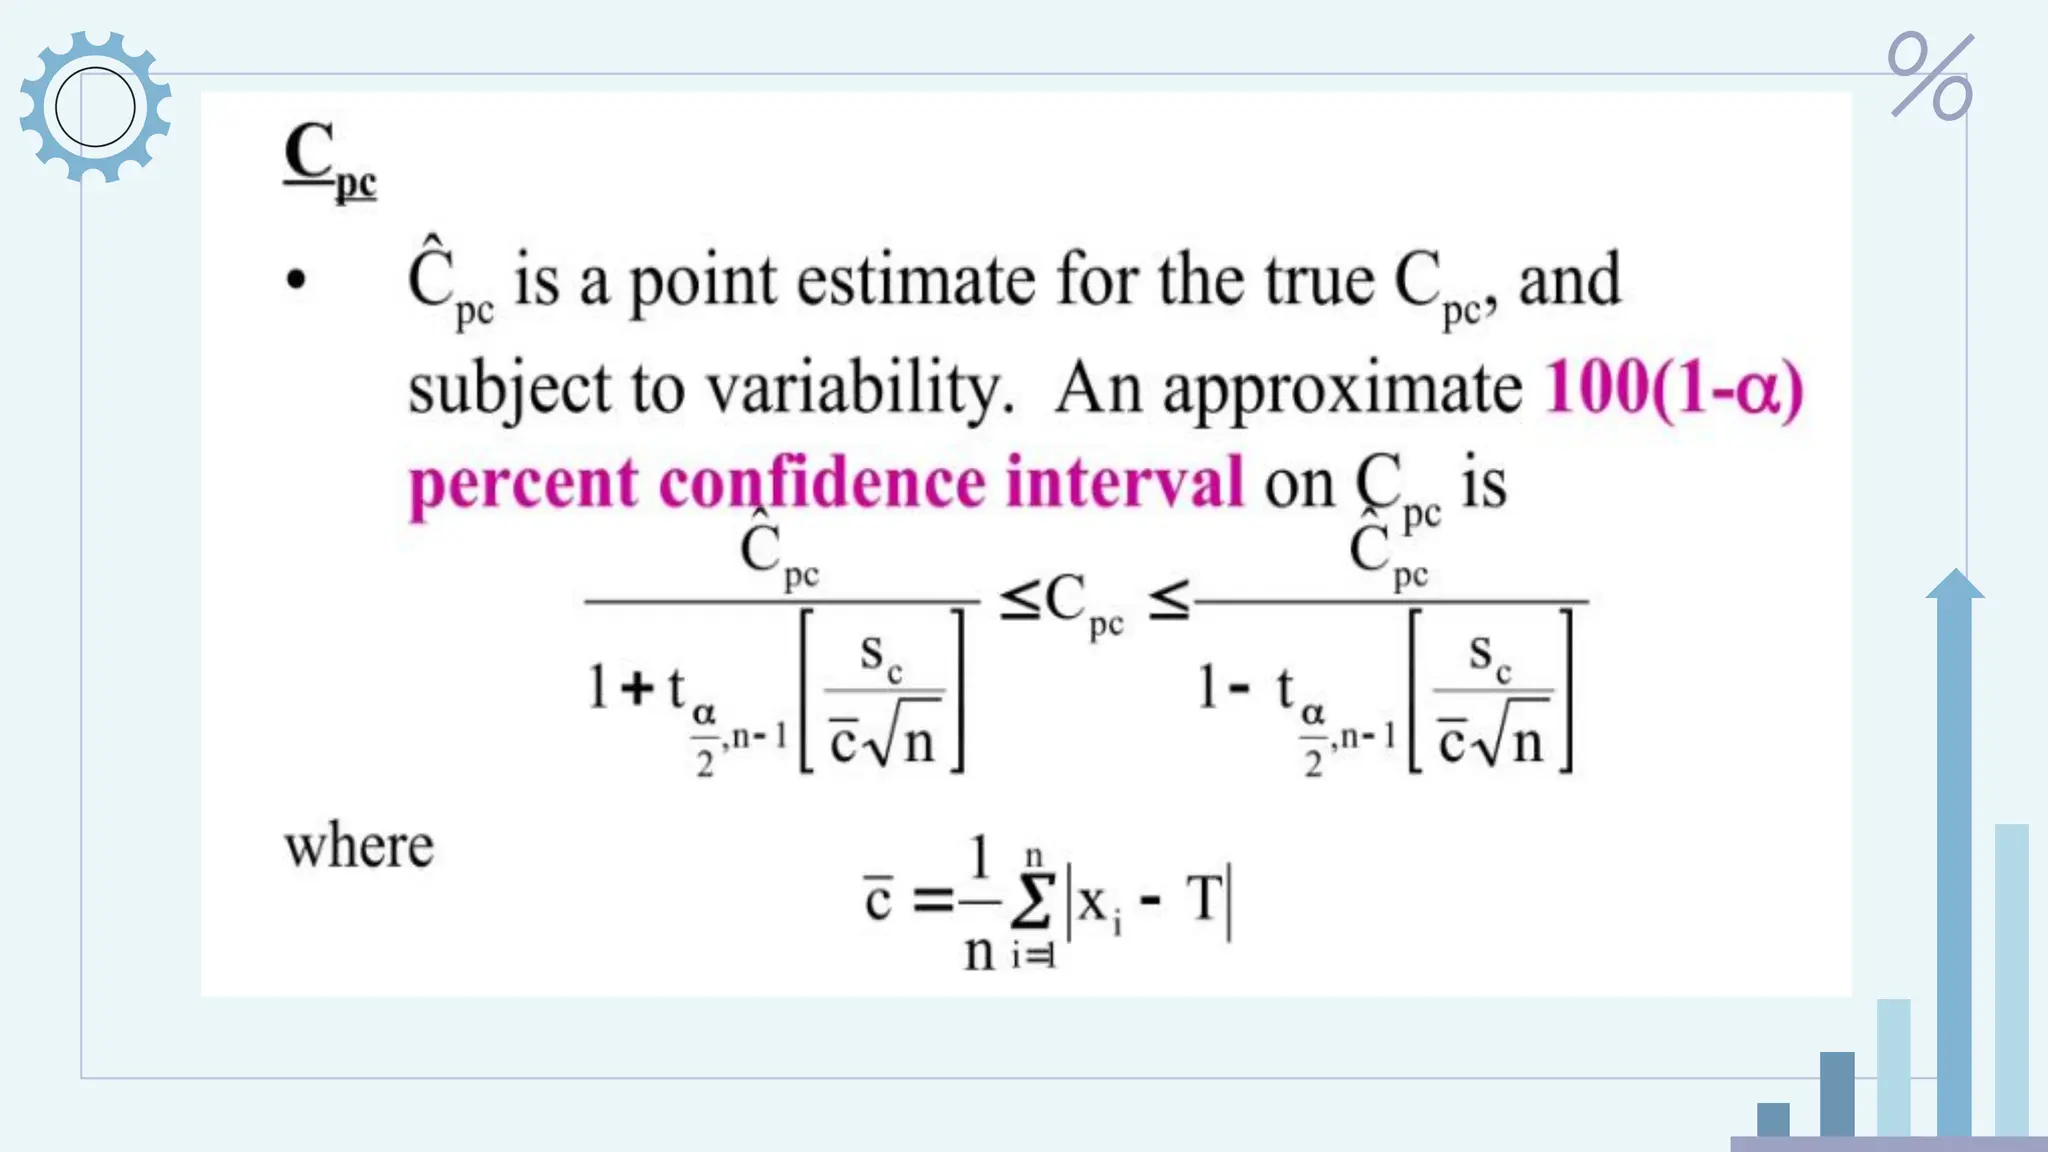
PROCESS CAPABILITY RATIOS
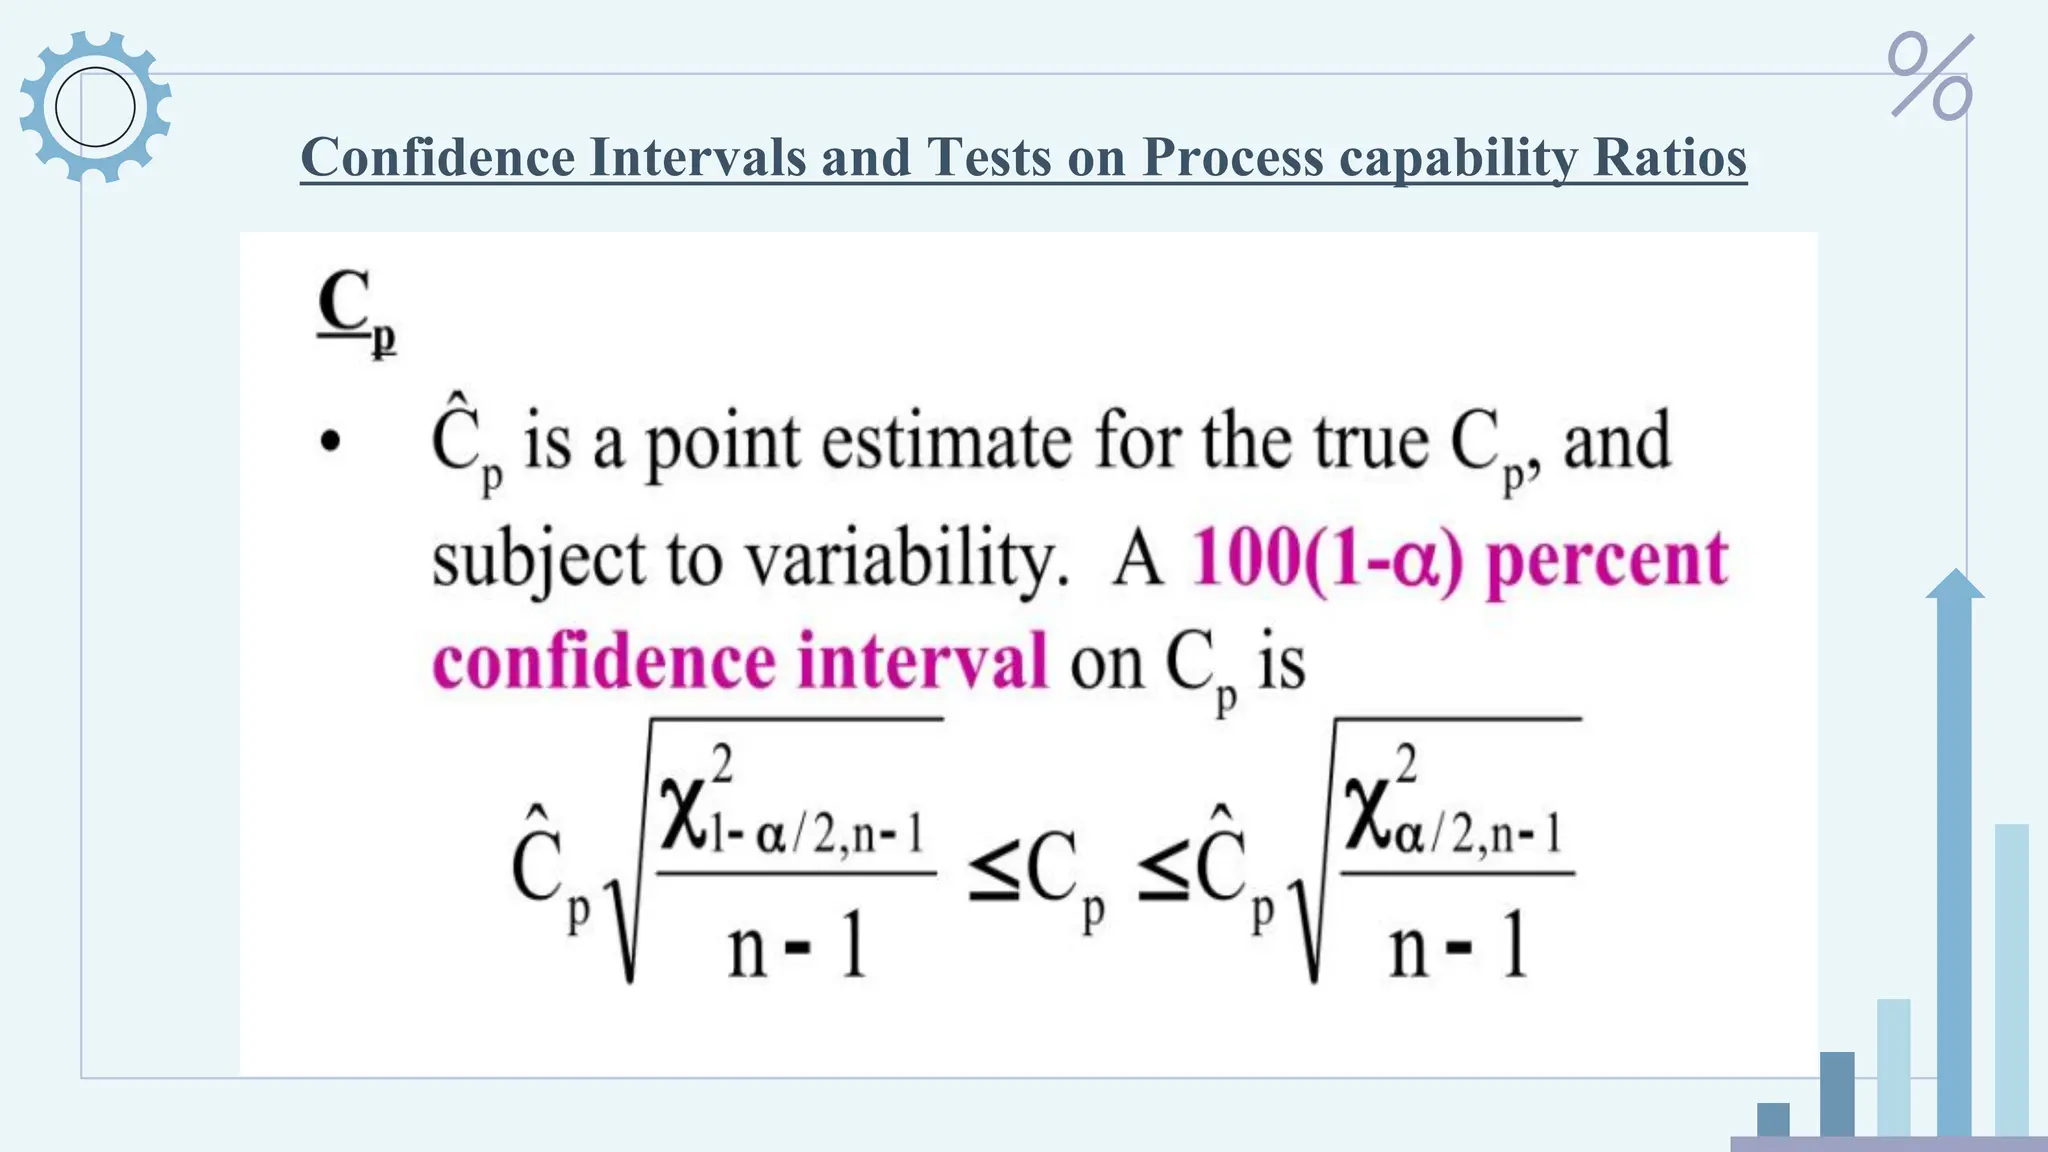
Useand interpretation of Cp
● Recall where LSL and USL are the lower
and upper specifications limits,
respectively.
The estimate of Cp is given by:
where the estimated σ can be
calculated using the sample
standard deviation, S or r̄/d2
9.
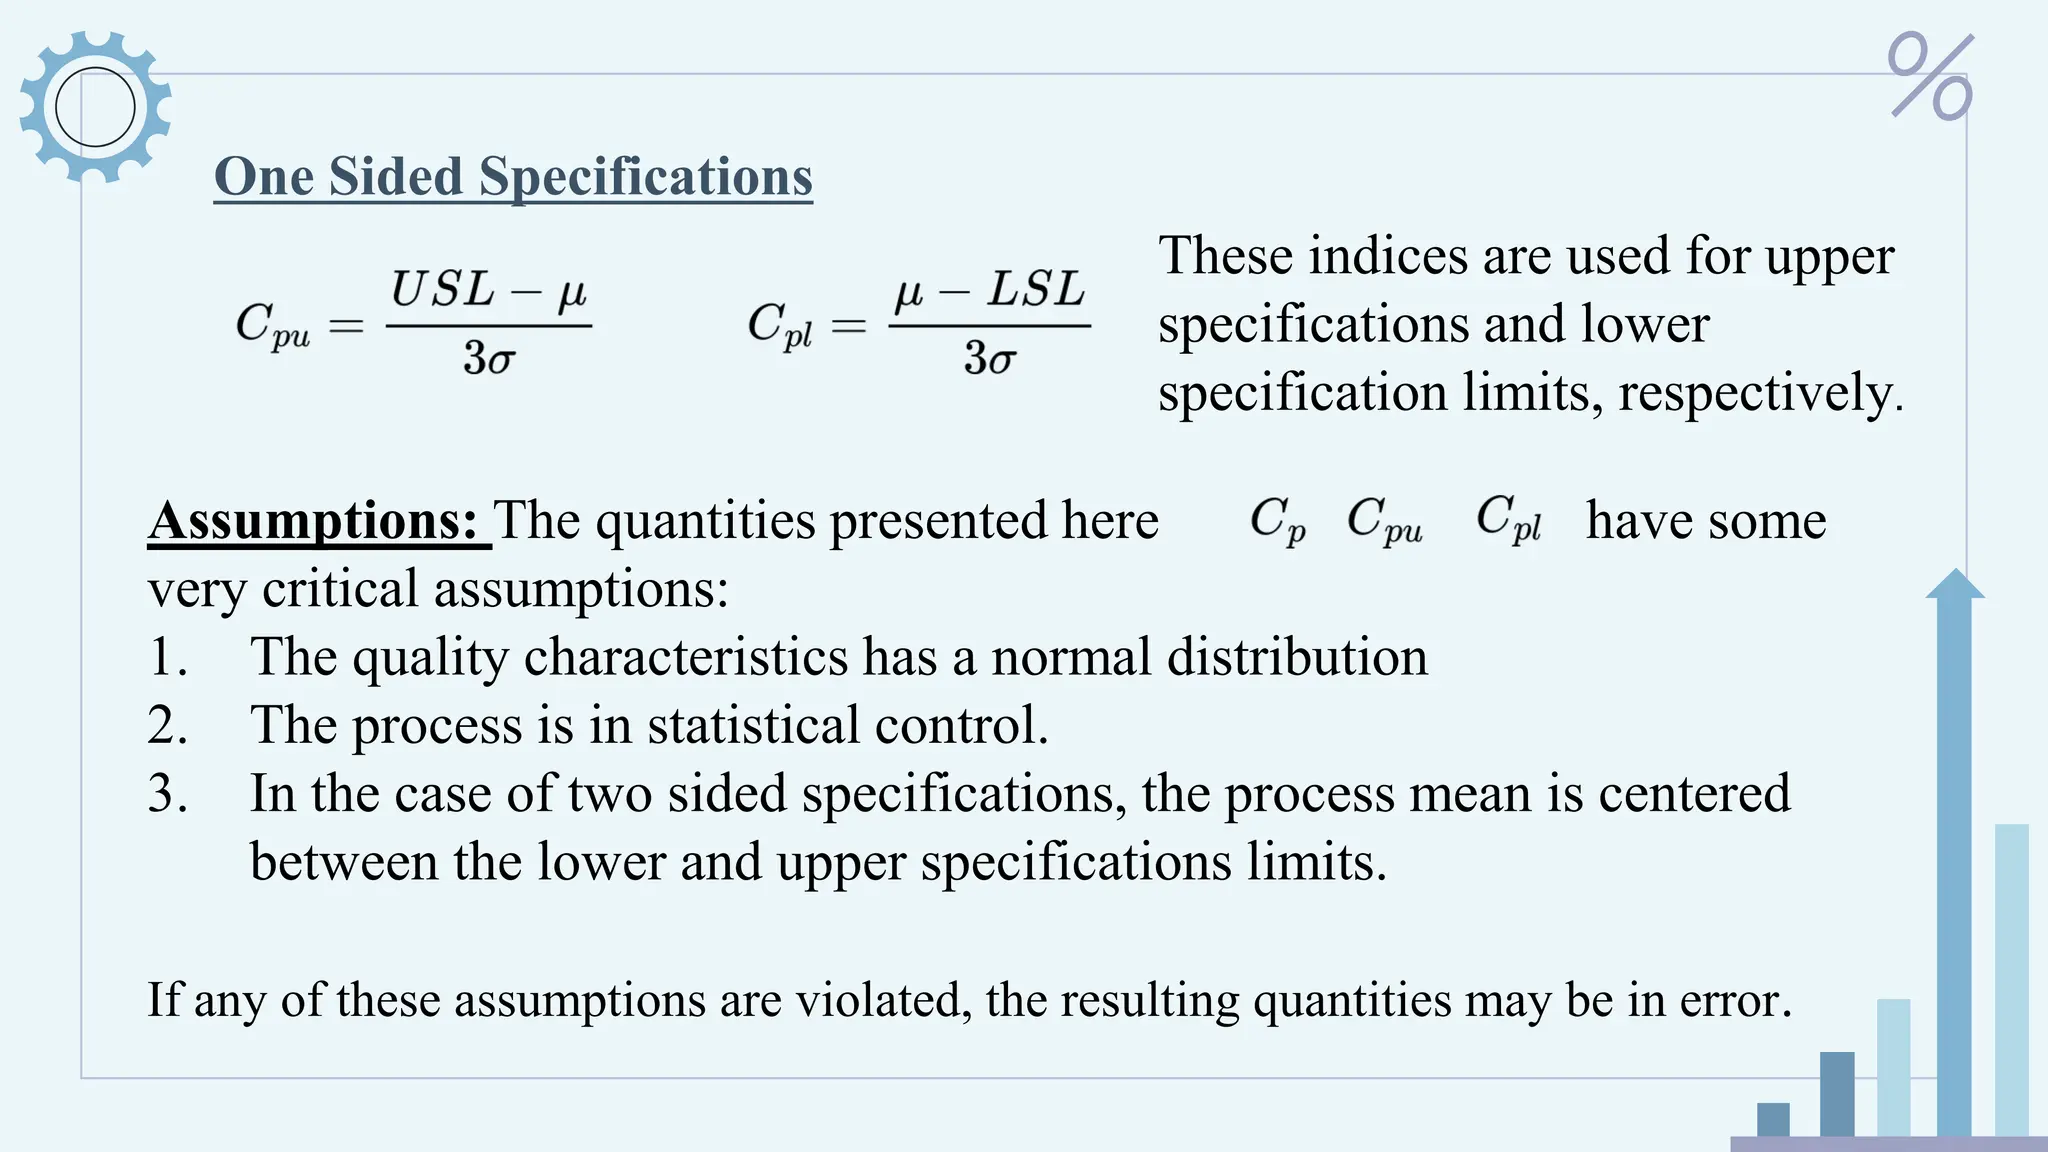
One Sided Specifications
Theseindices are used for upper
specifications and lower
specification limits, respectively.
Assumptions: The quantities presented here have some
very critical assumptions:
1. The quality characteristics has a normal distribution
2. The process is in statistical control.
3. In the case of two sided specifications, the process mean is centered
between the lower and upper specifications limits.
If any of these assumptions are violated, the resulting quantities may be in error.
10.
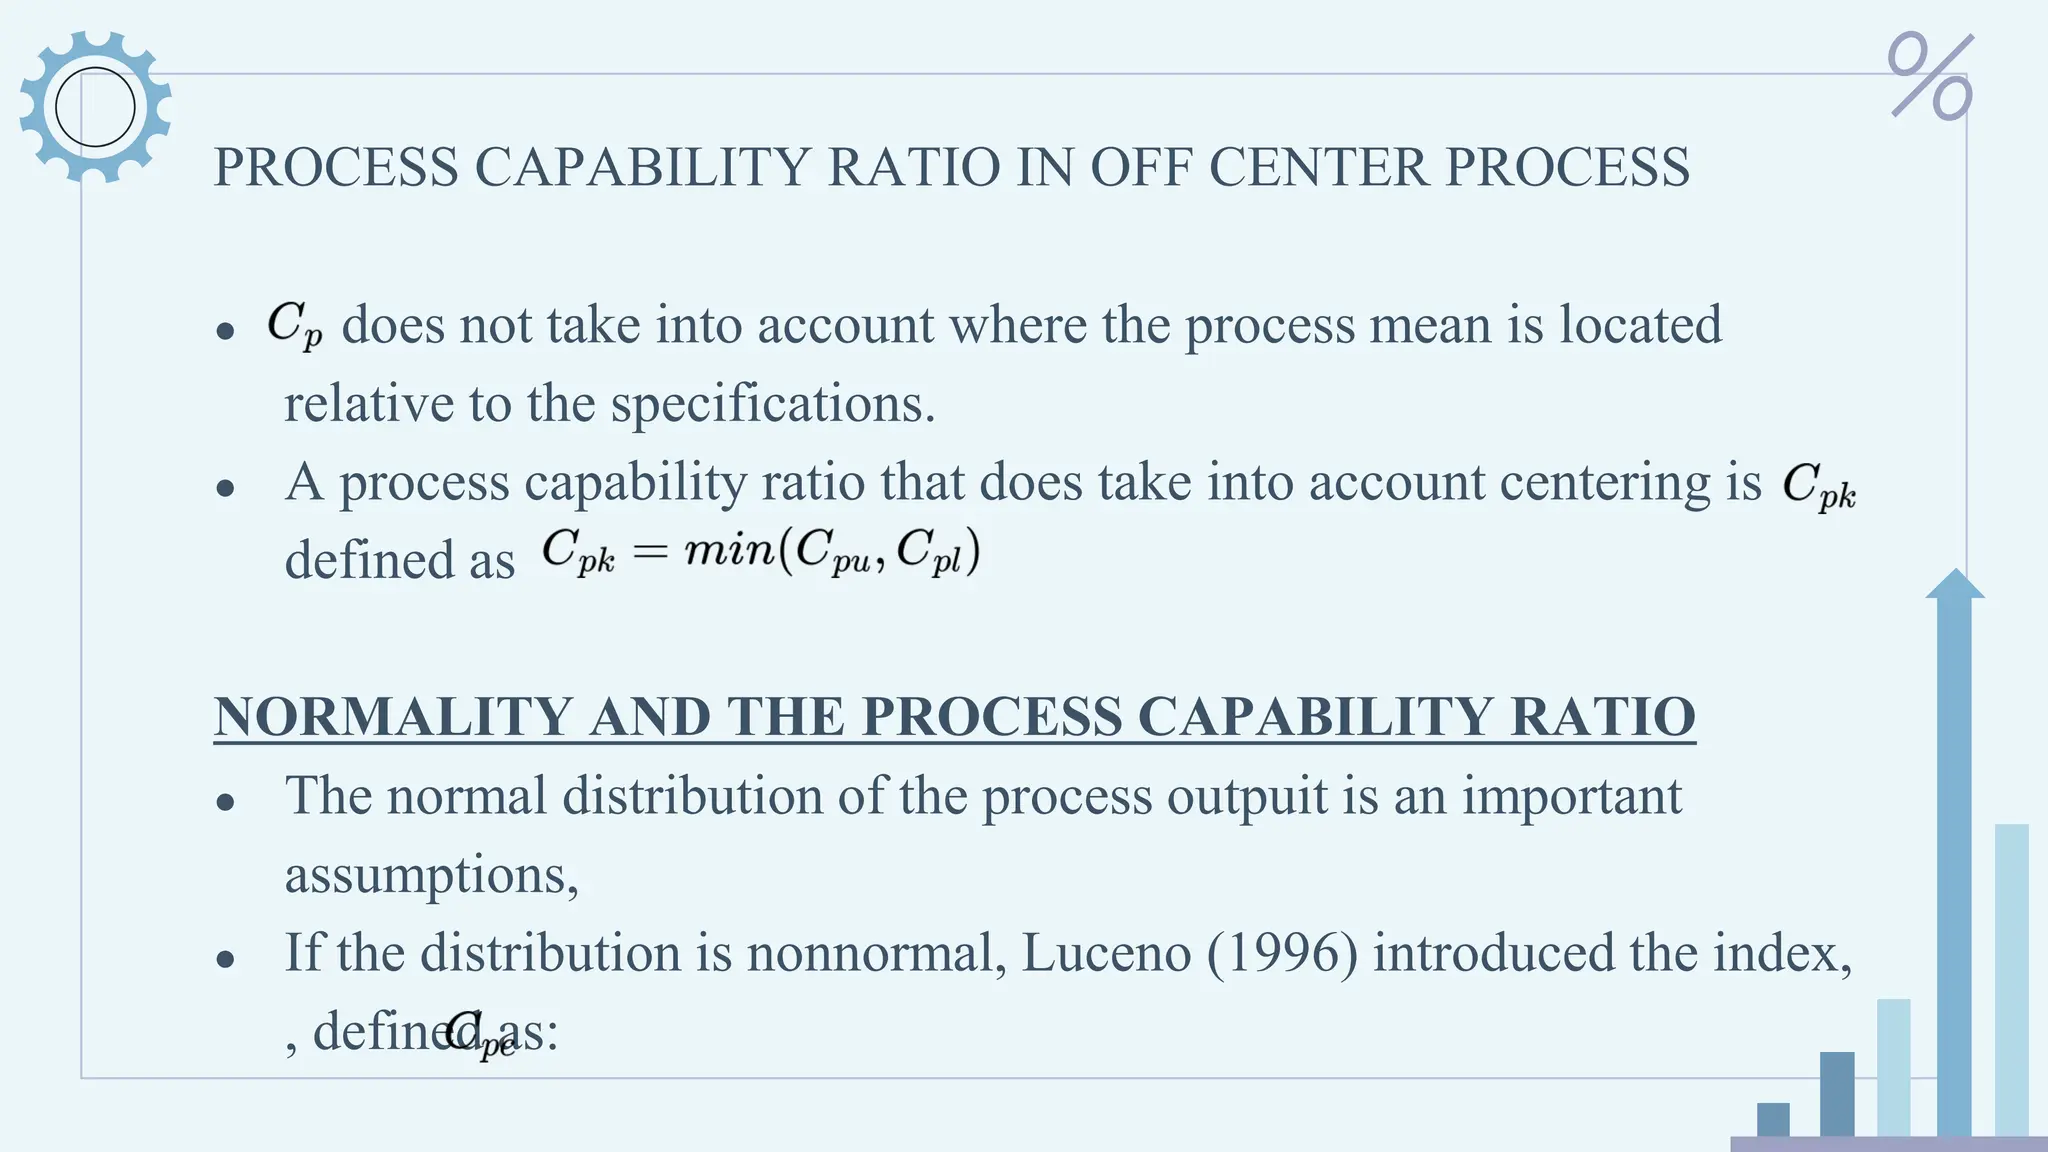
PROCESS CAPABILITY RATIOIN OFF CENTER PROCESS
● does not take into account where the process mean is located
relative to the specifications.
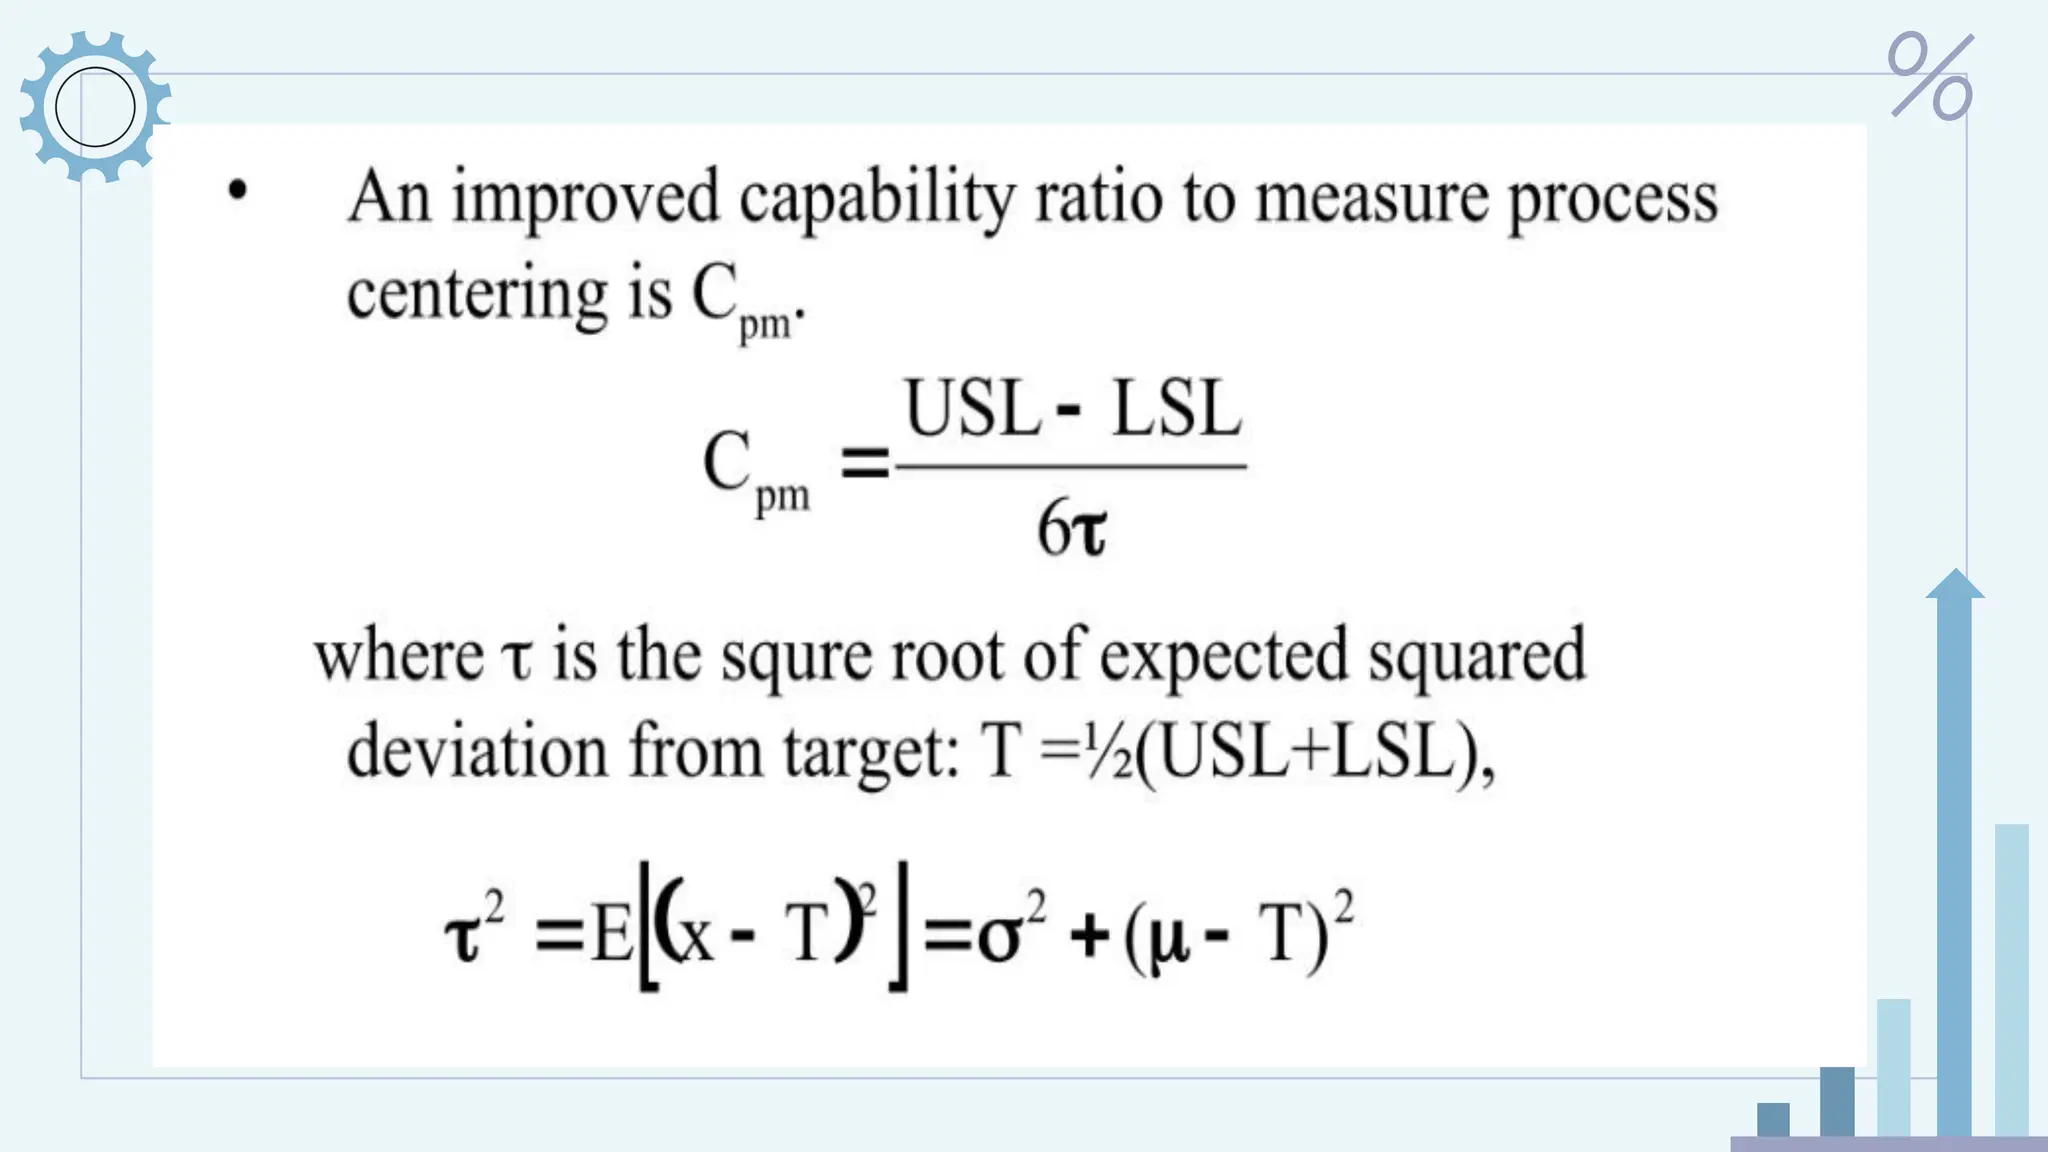
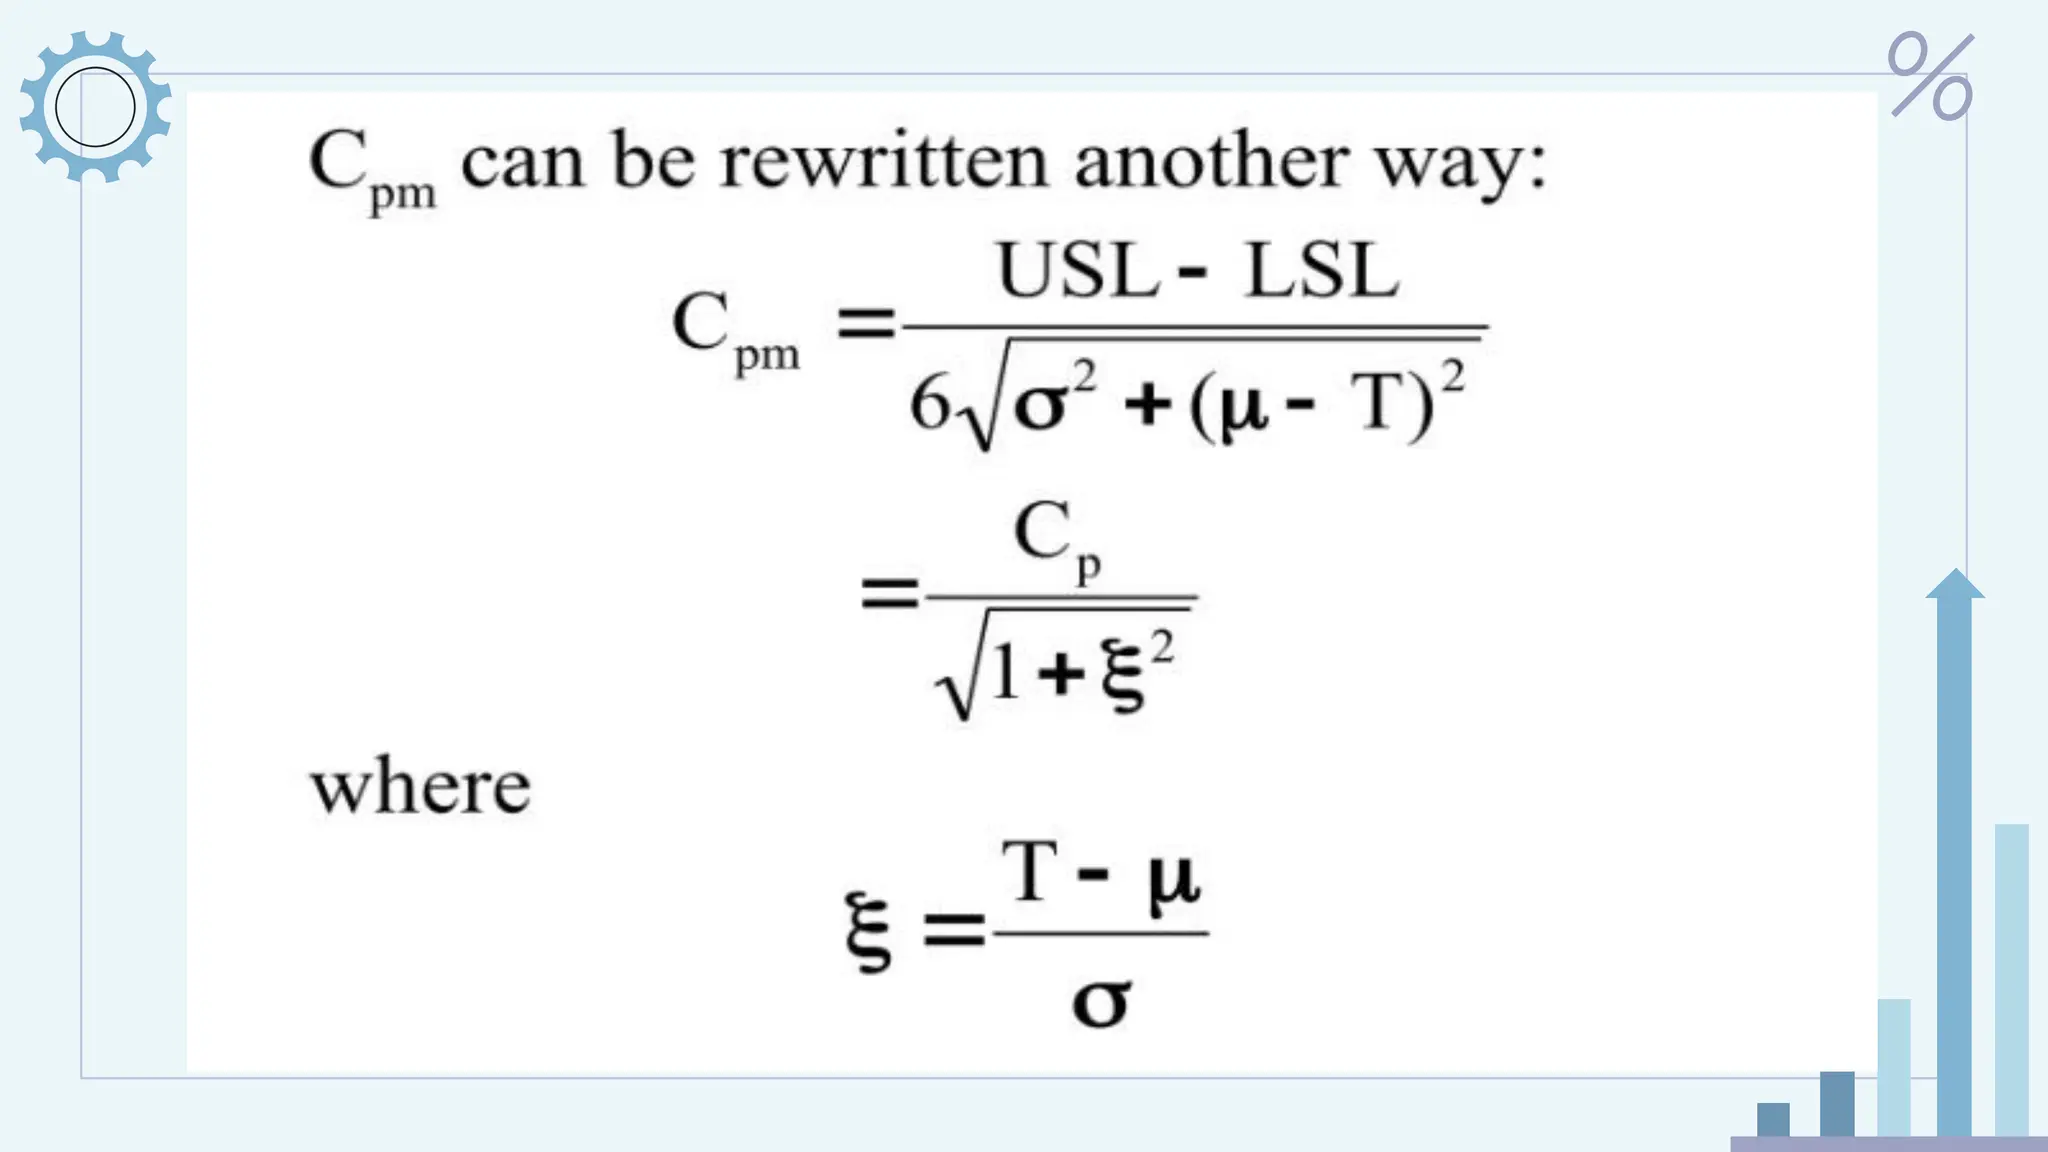
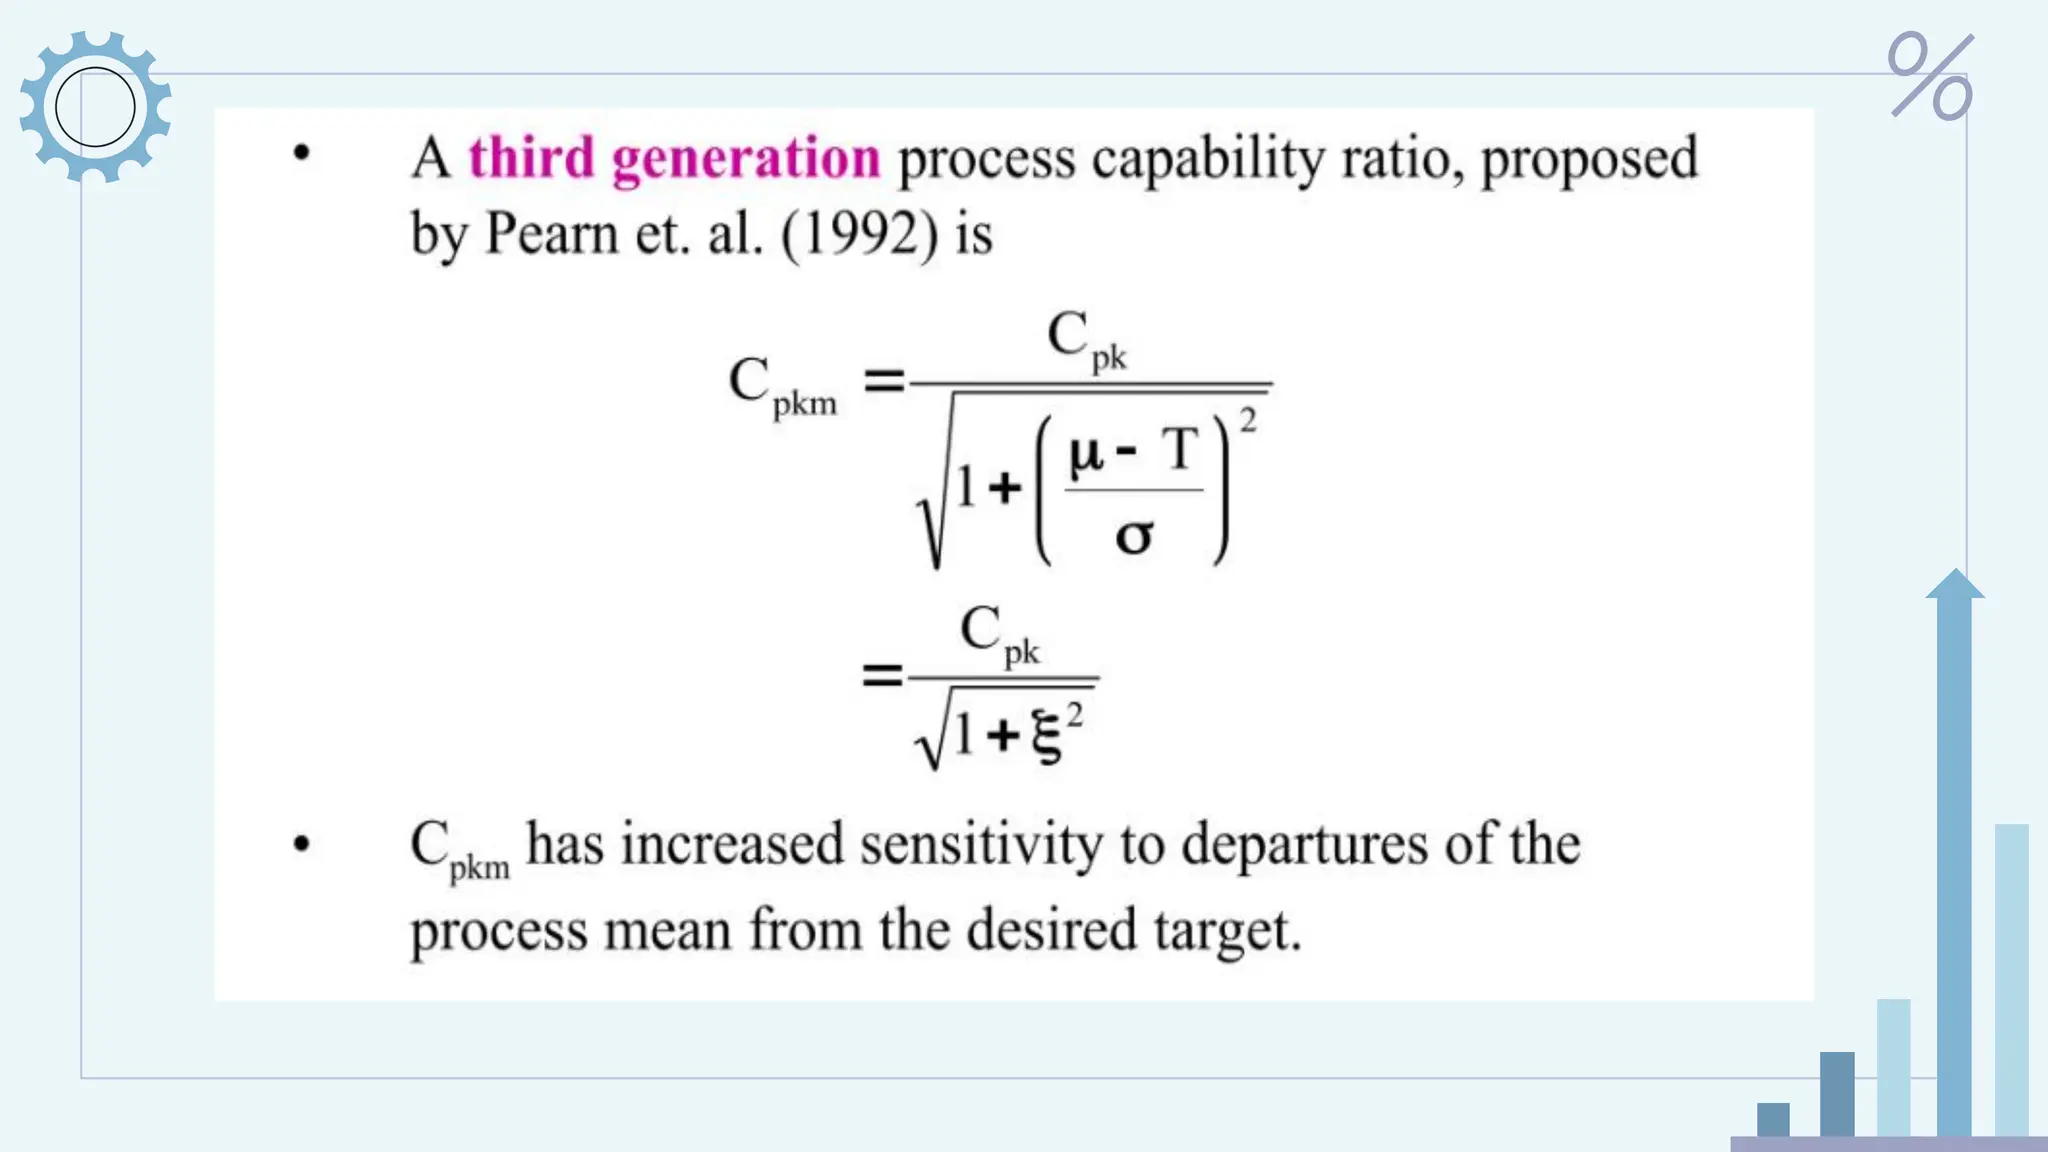
● A process capability ratio that does take into account centering is
defined as
NORMALITY AND THE PROCESS CAPABILITY RATIO
● The normal distribution of the process outpuit is an important
assumptions,
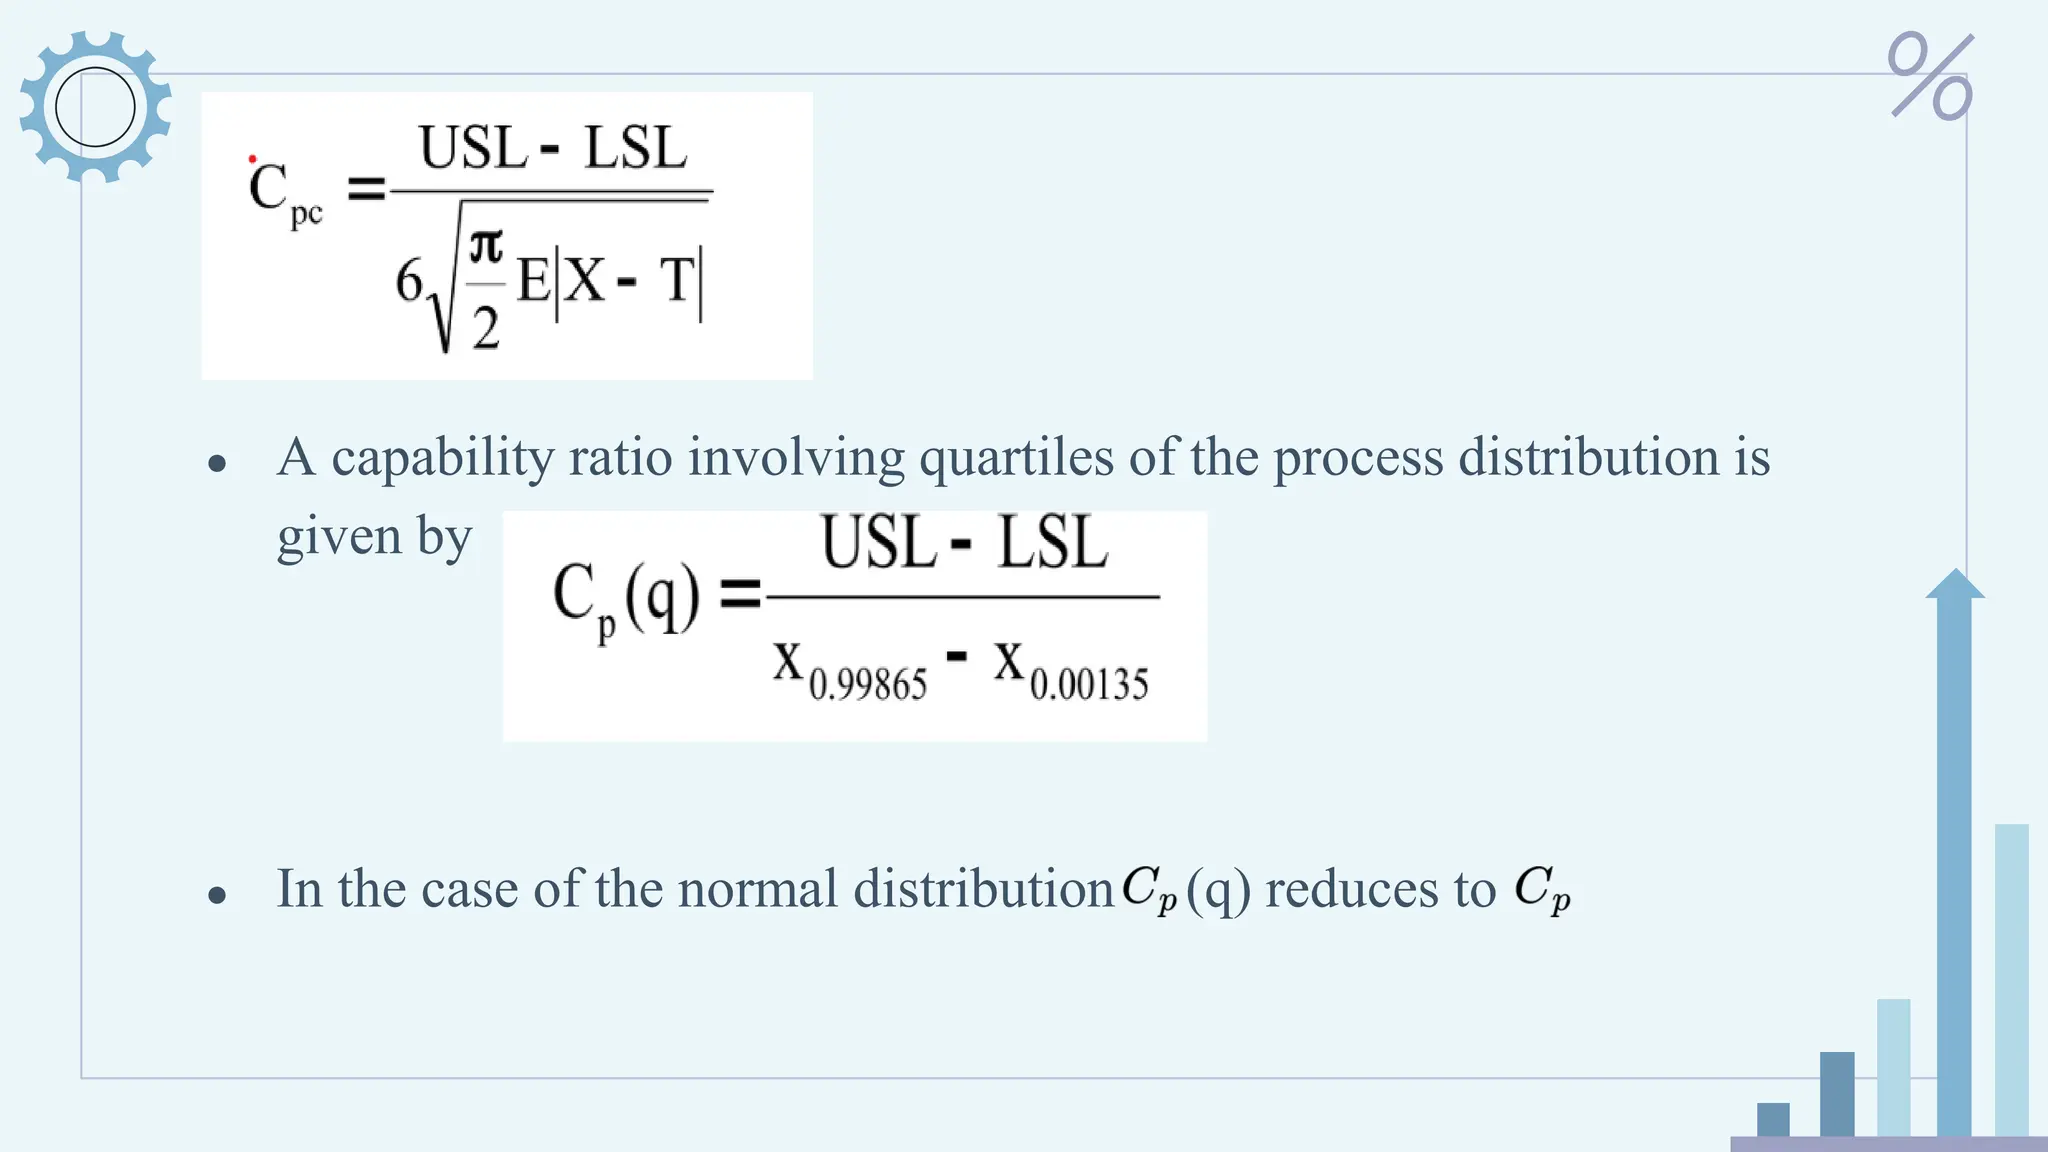
● If the distribution is nonnormal, Luceno (1996) introduced the index,
, defined as:
11.
● A capabilityratio involving quartiles of the process distribution is
given by
● In the case of the normal distribution (q) reduces to
12.
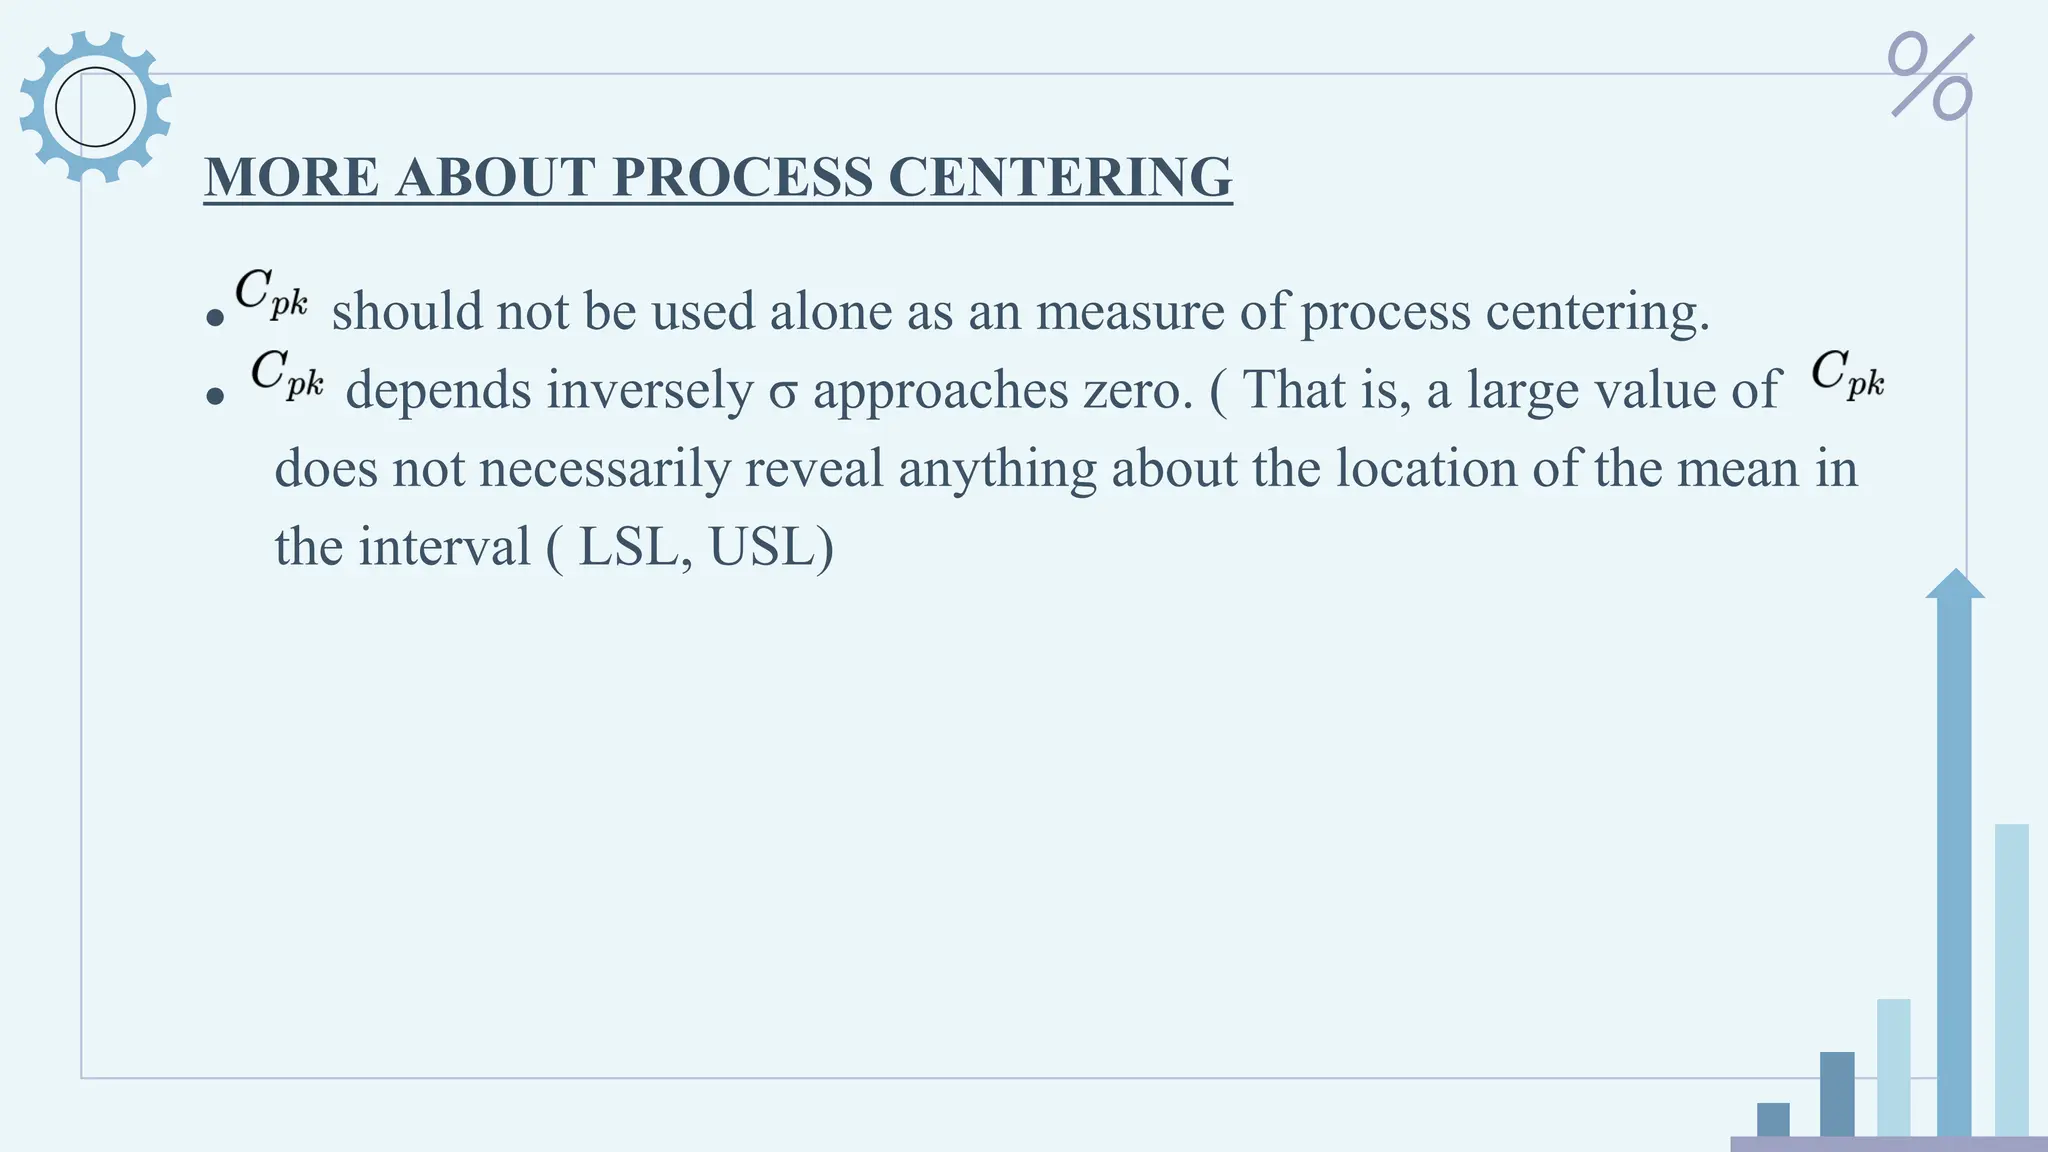
MORE ABOUT PROCESSCENTERING
● should not be used alone as an measure of process centering.
● depends inversely σ approaches zero. ( That is, a large value of
does not necessarily reveal anything about the location of the mean in
the interval ( LSL, USL)
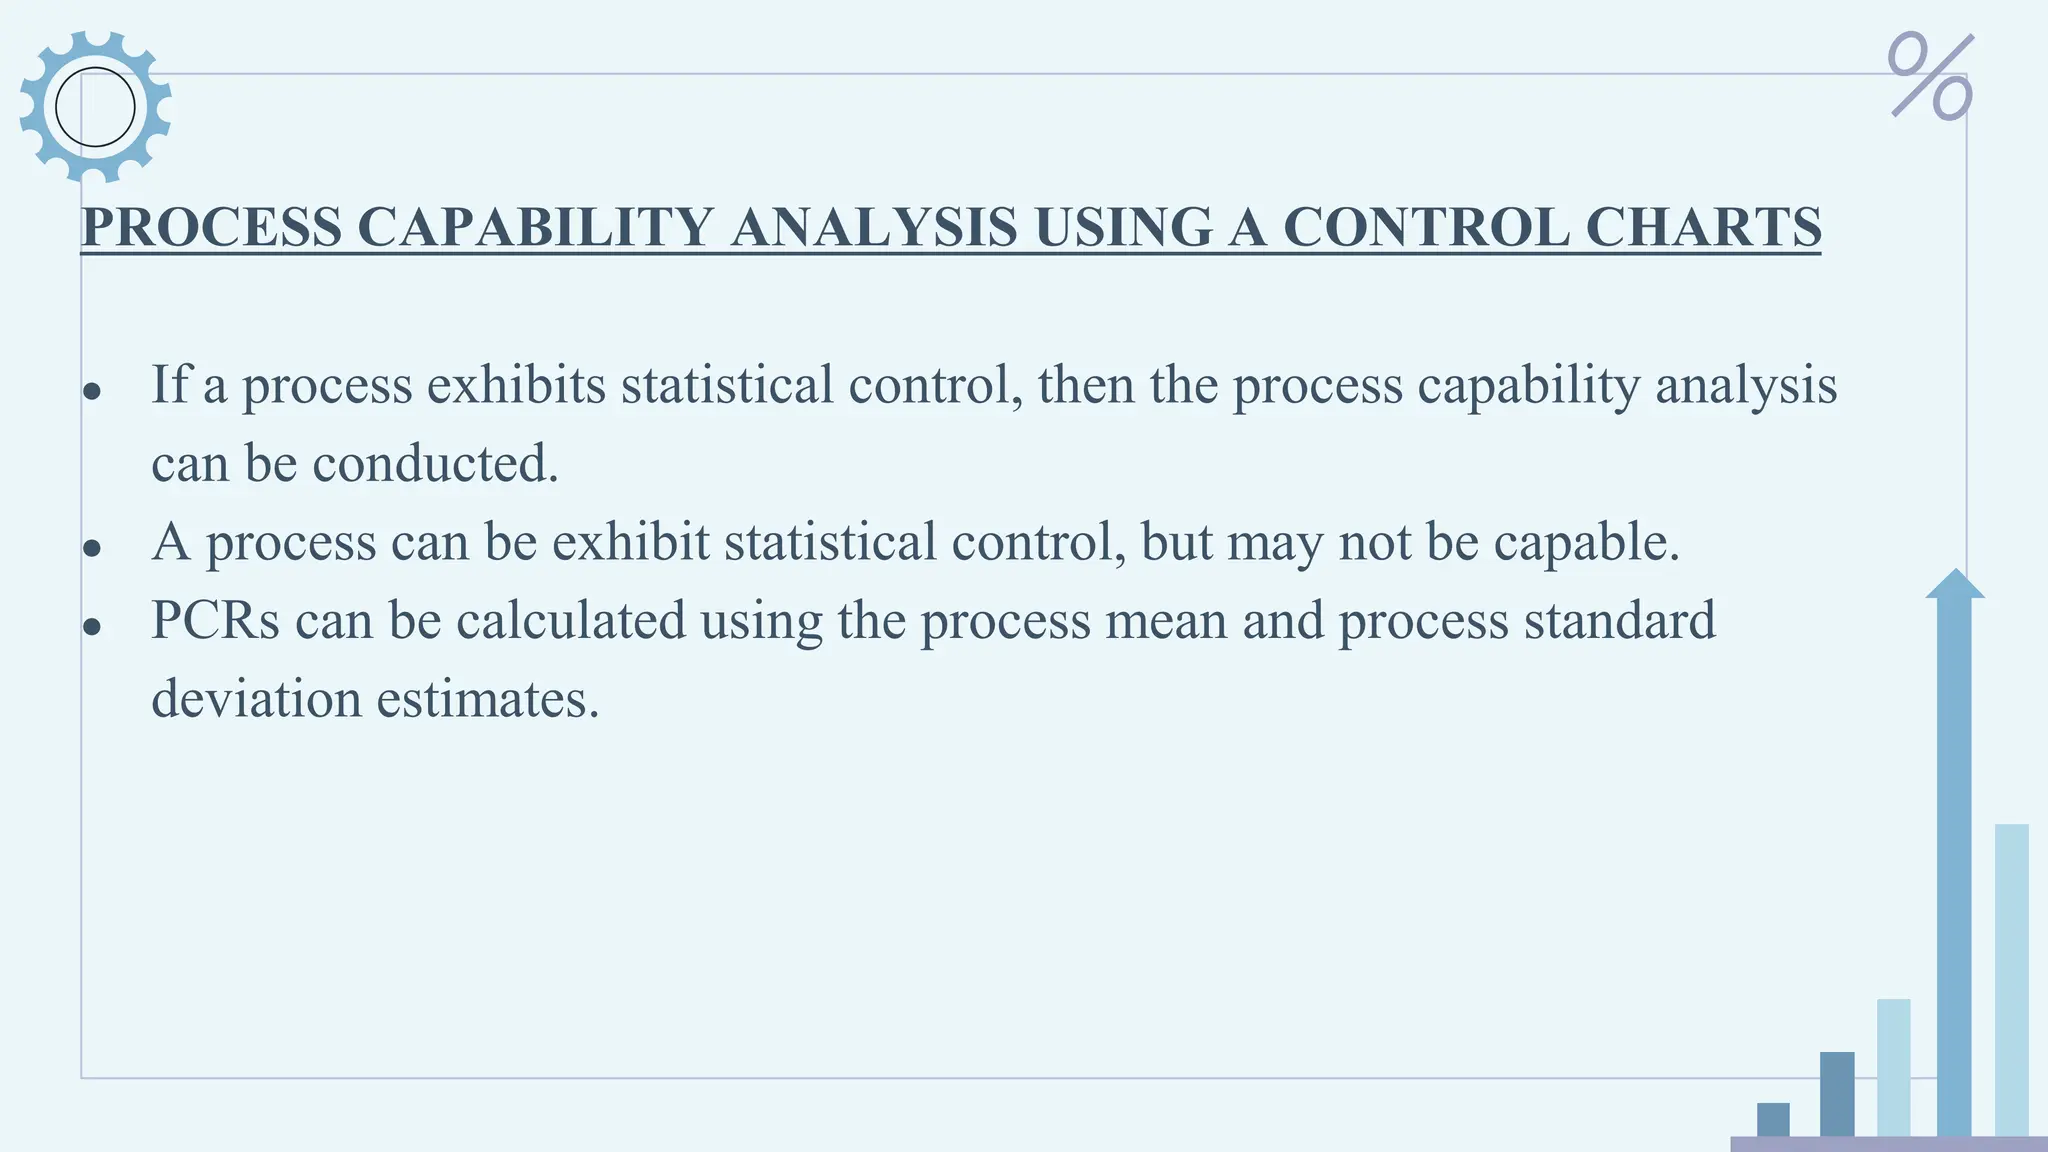
PROCESS CAPABILITY ANALYSISUSING A CONTROL CHARTS
● If a process exhibits statistical control, then the process capability analysis
can be conducted.
● A process can be exhibit statistical control, but may not be capable.
● PCRs can be calculated using the process mean and process standard
deviation estimates.
25.
PROCESS CAPABILITY ANALYSISDESIGNED EXPERIMENTS
● Systematic approach to varying the variables believed to be influential
on the process. ( Factors that are necessary for the devlopment or
product)
● Designed experiments can be determine teh sources of variability in the
process.
26.
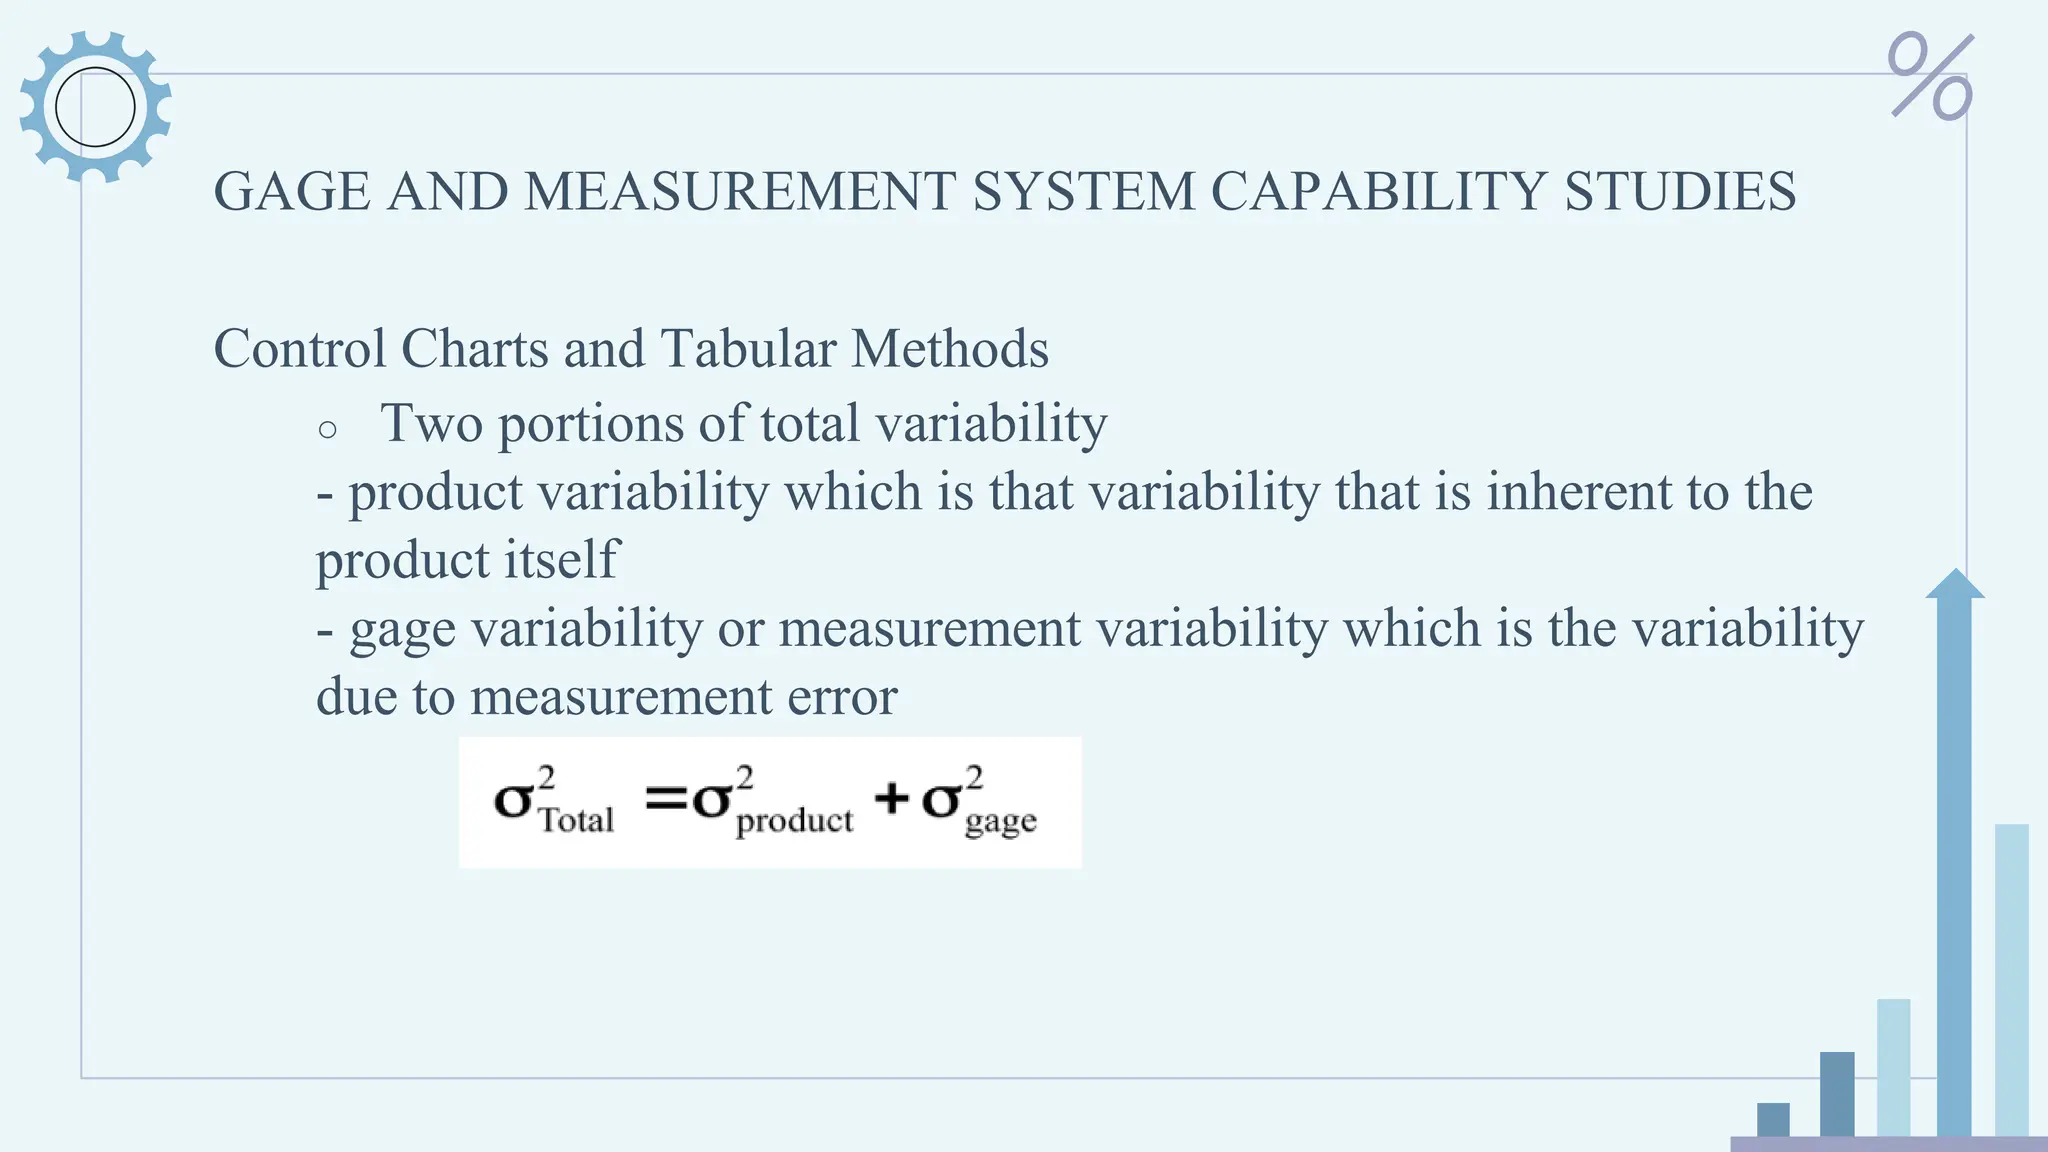
GAGE AND MEASUREMENTSYSTEM CAPABILITY STUDIES
Control Charts and Tabular Methods
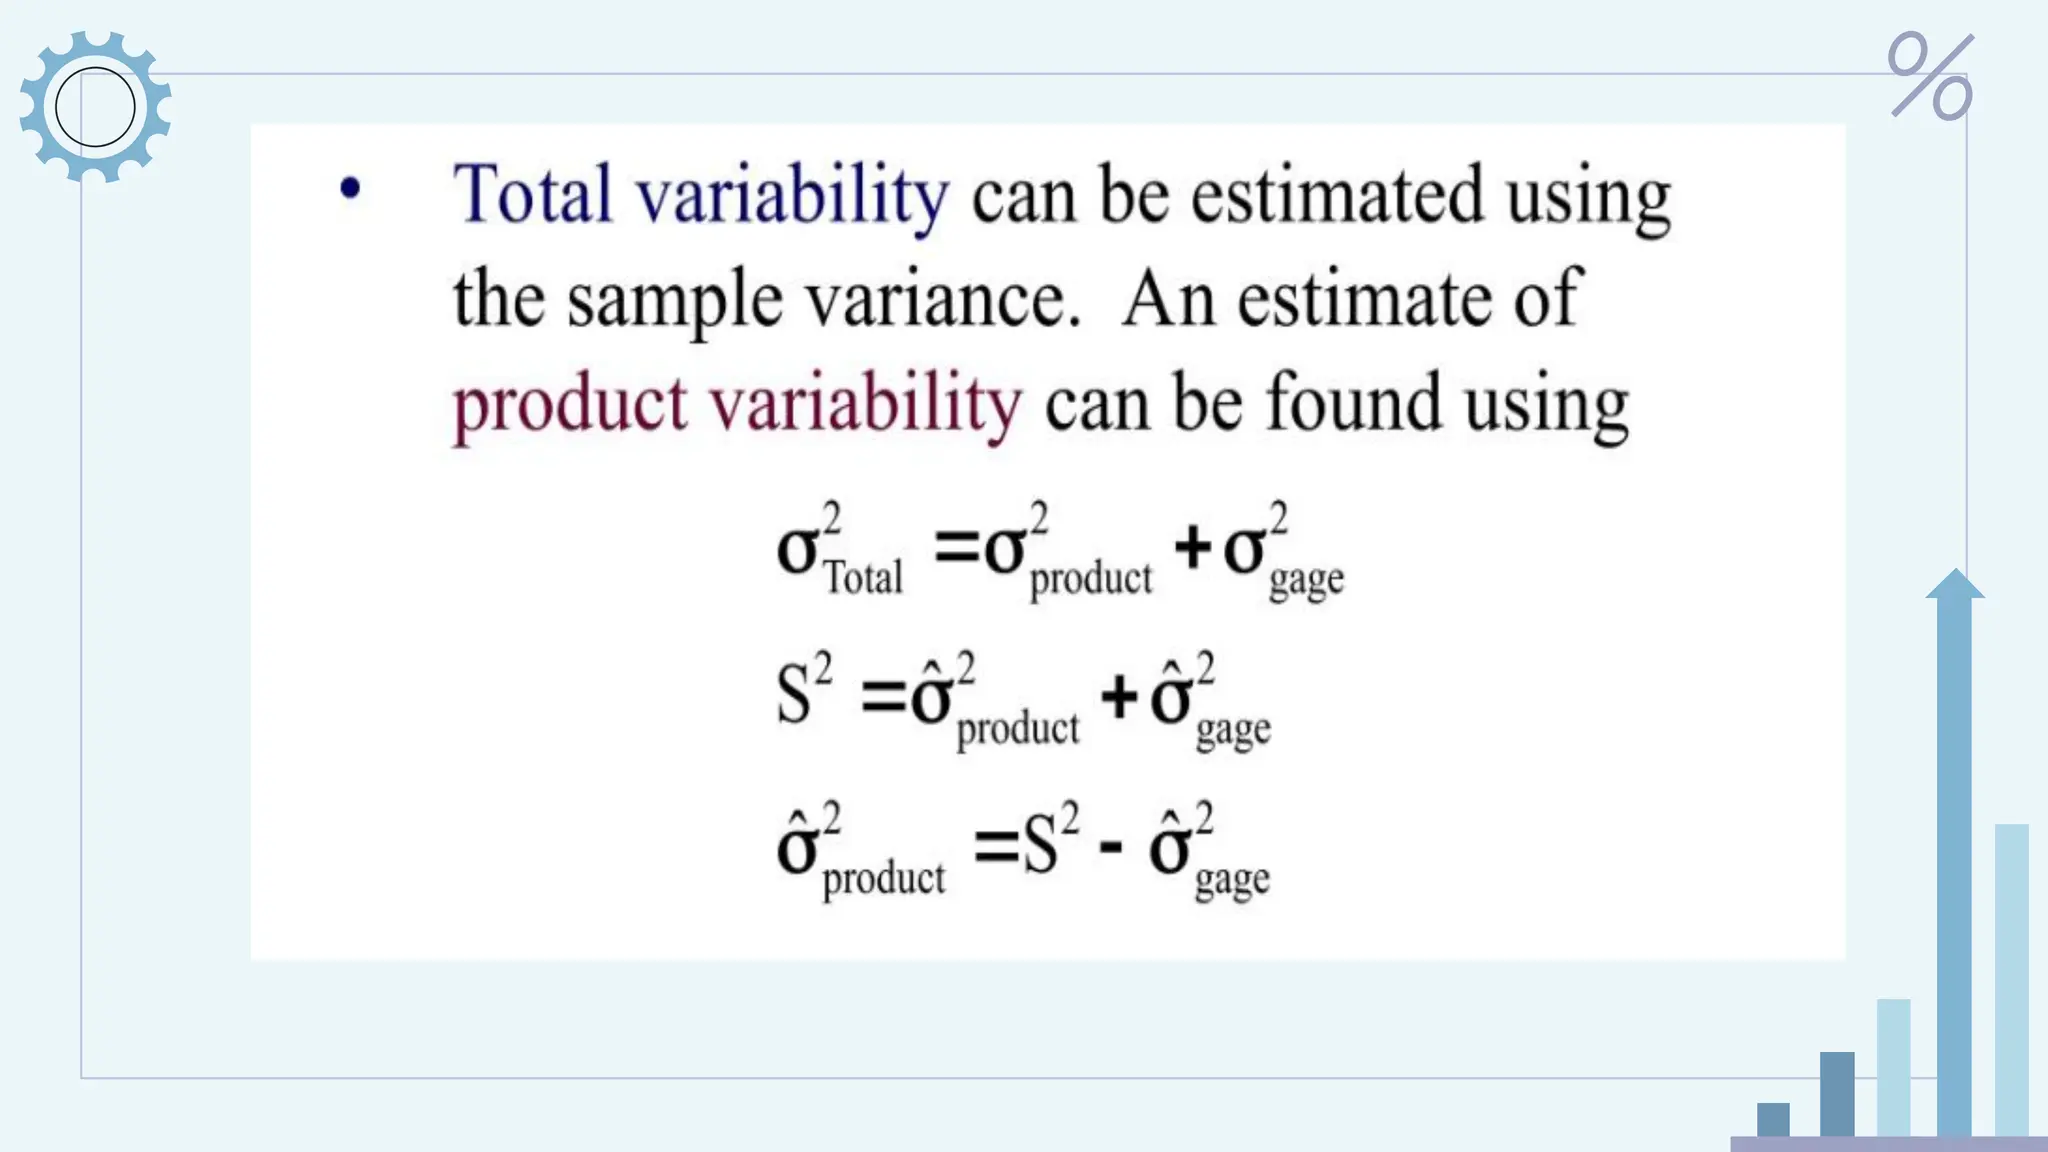
○ Two portions of total variability
- product variability which is that variability that is inherent to the
product itself
- gage variability or measurement variability which is the variability
due to measurement error
31.
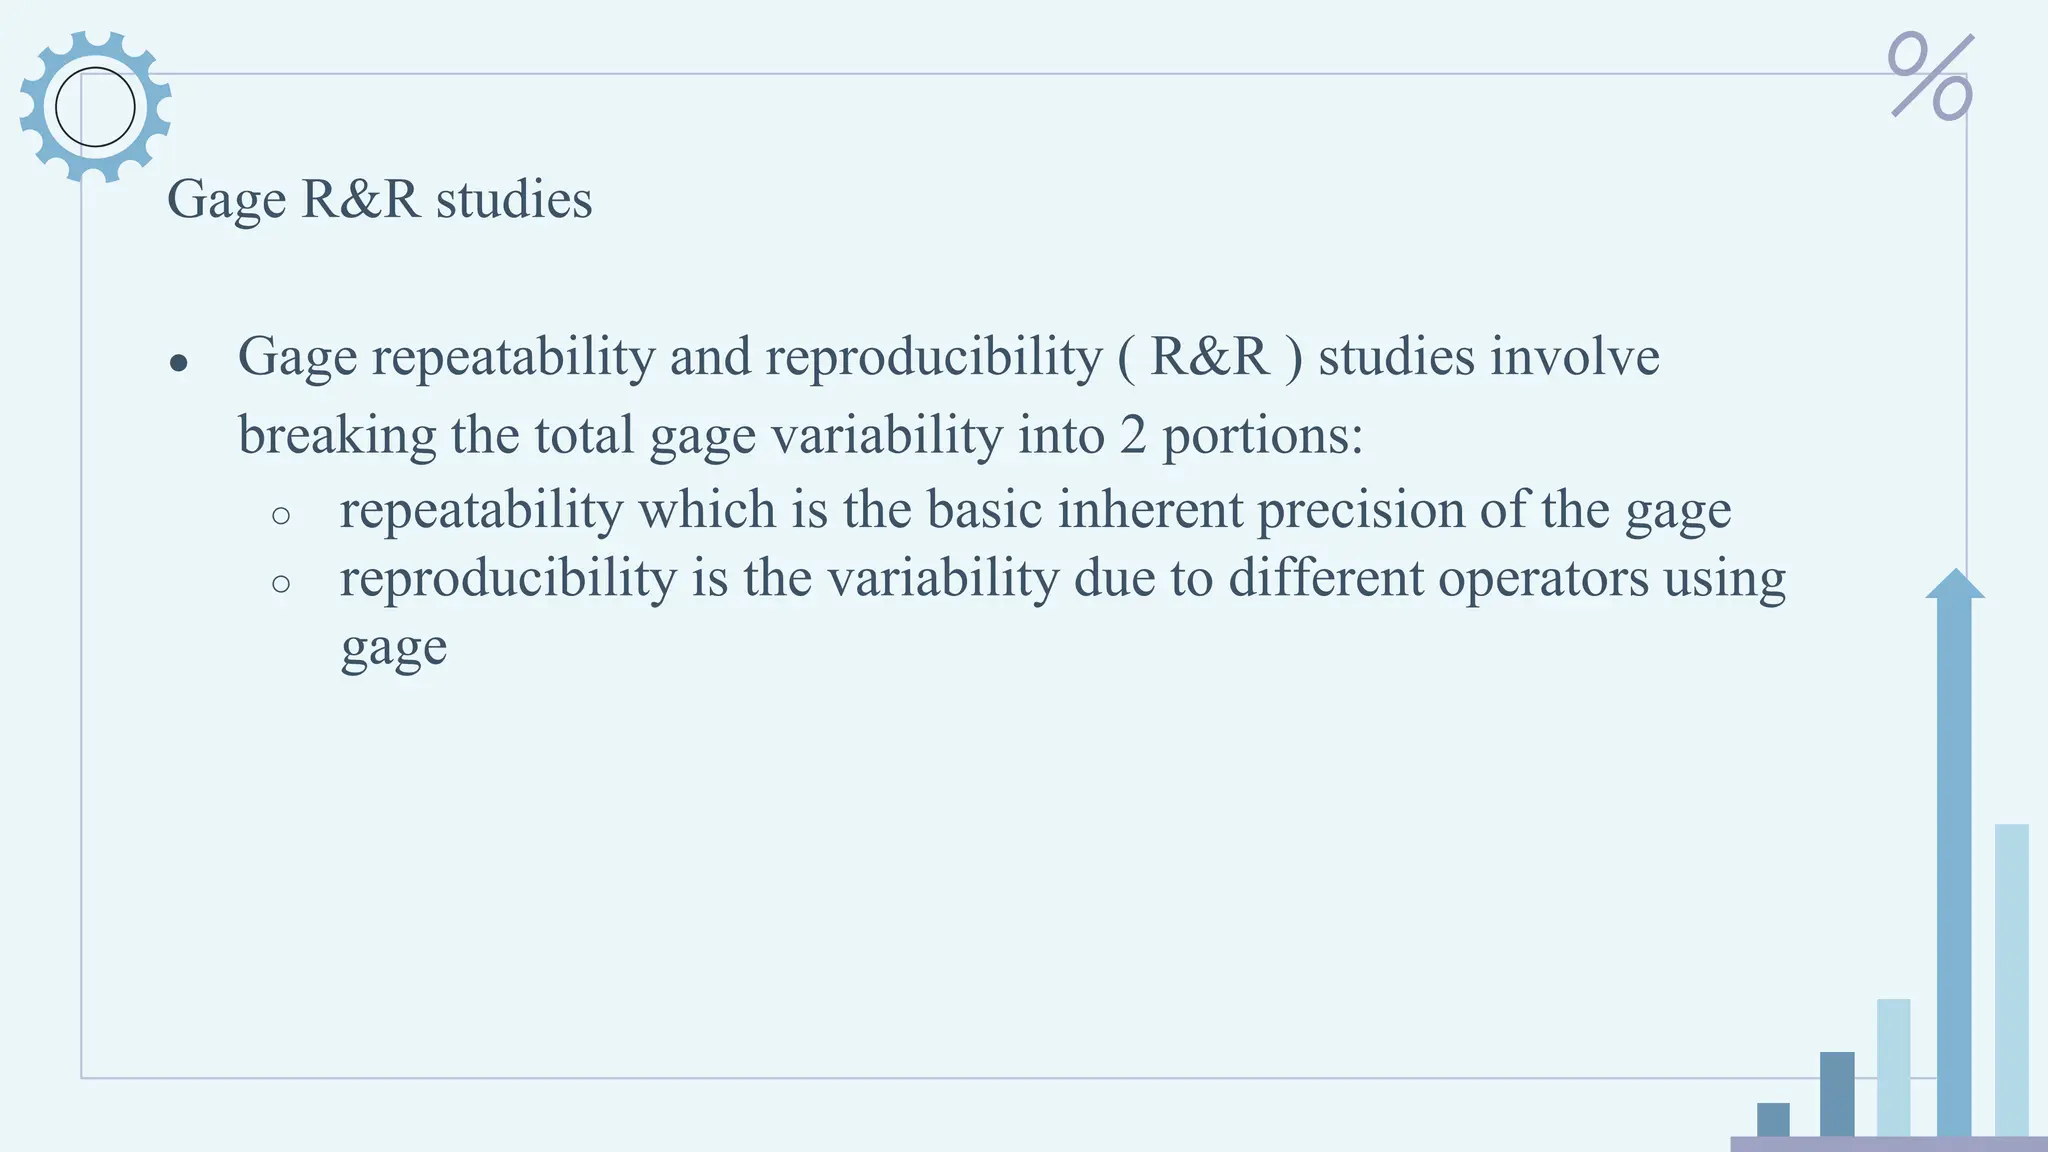
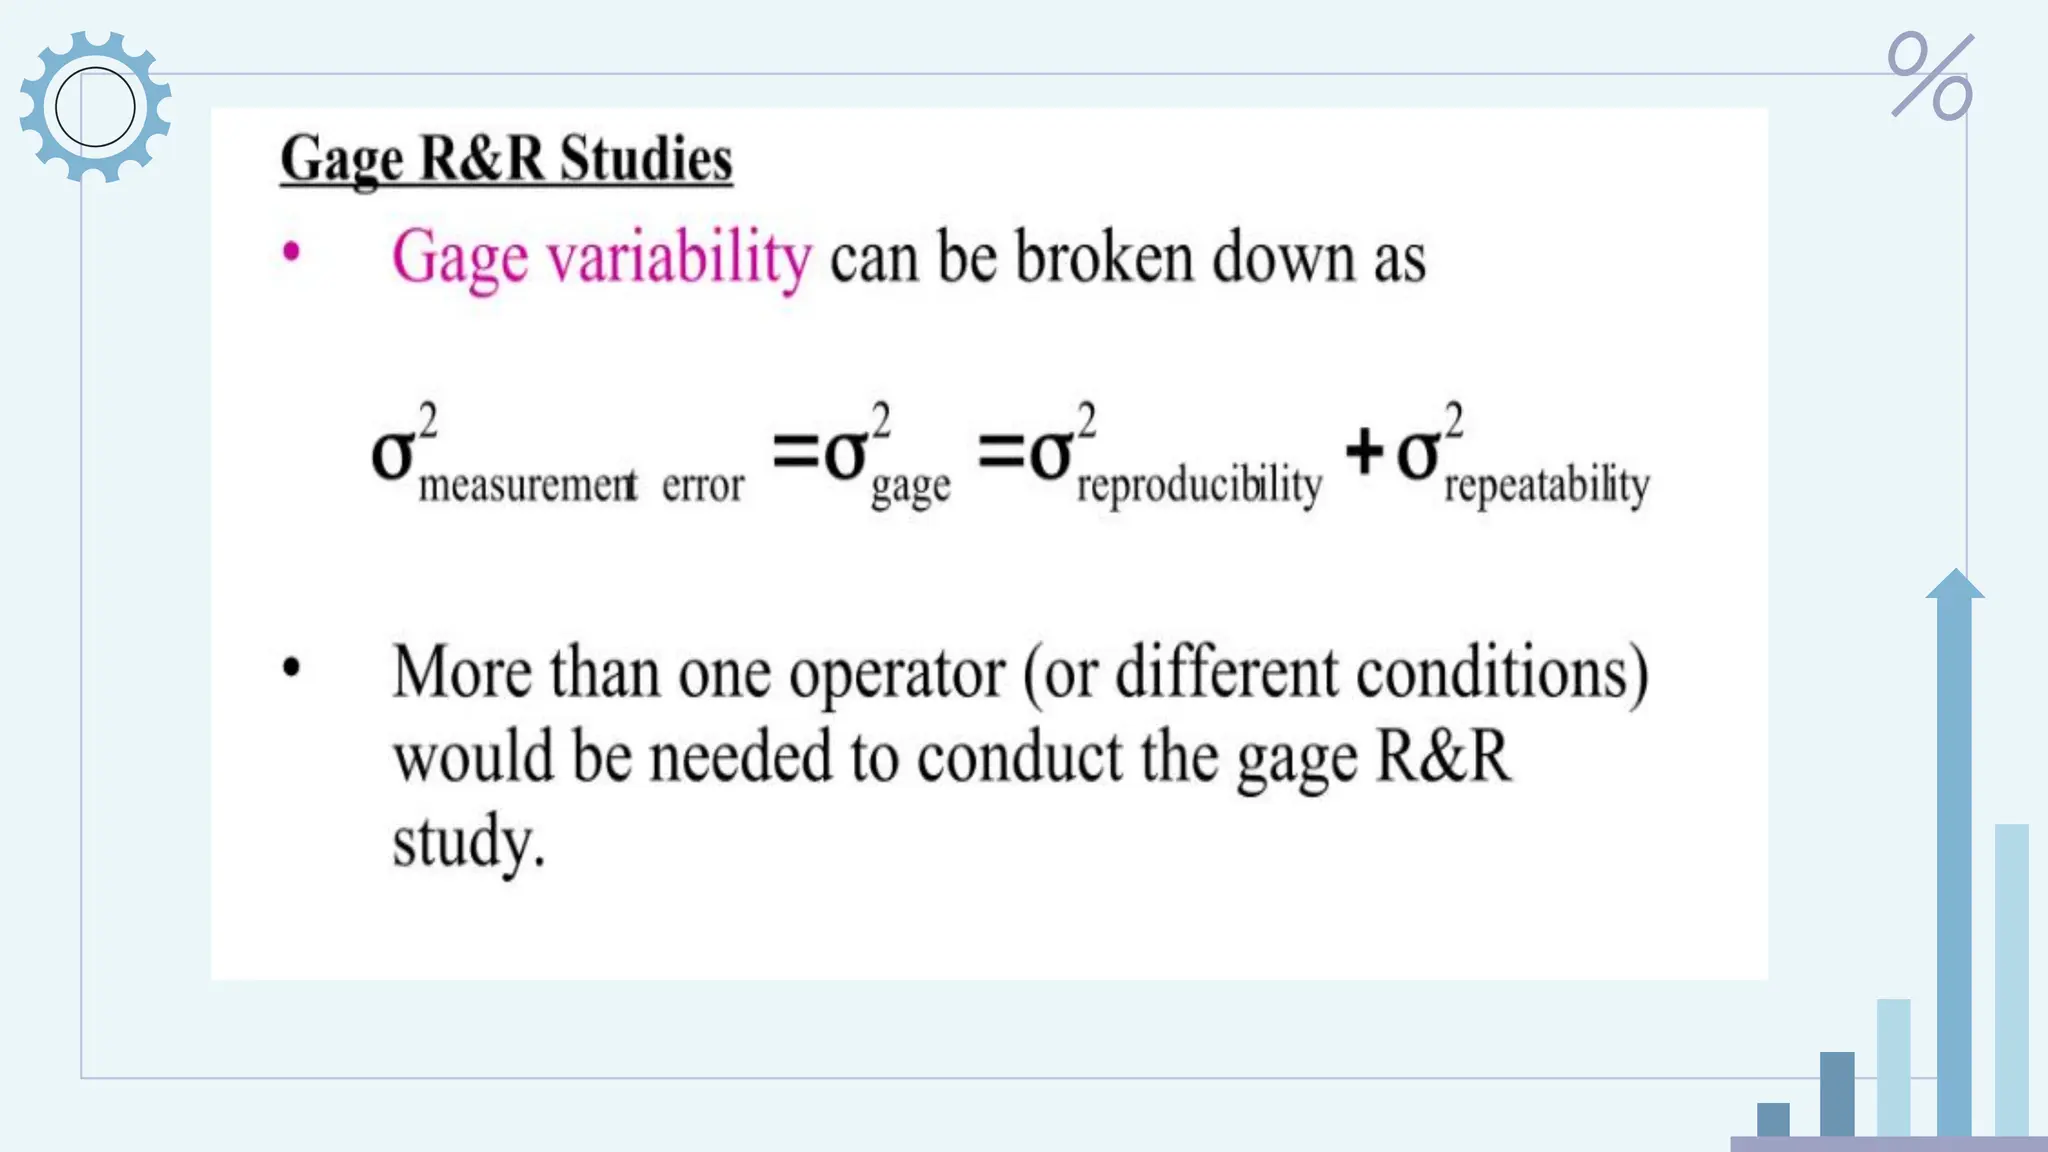
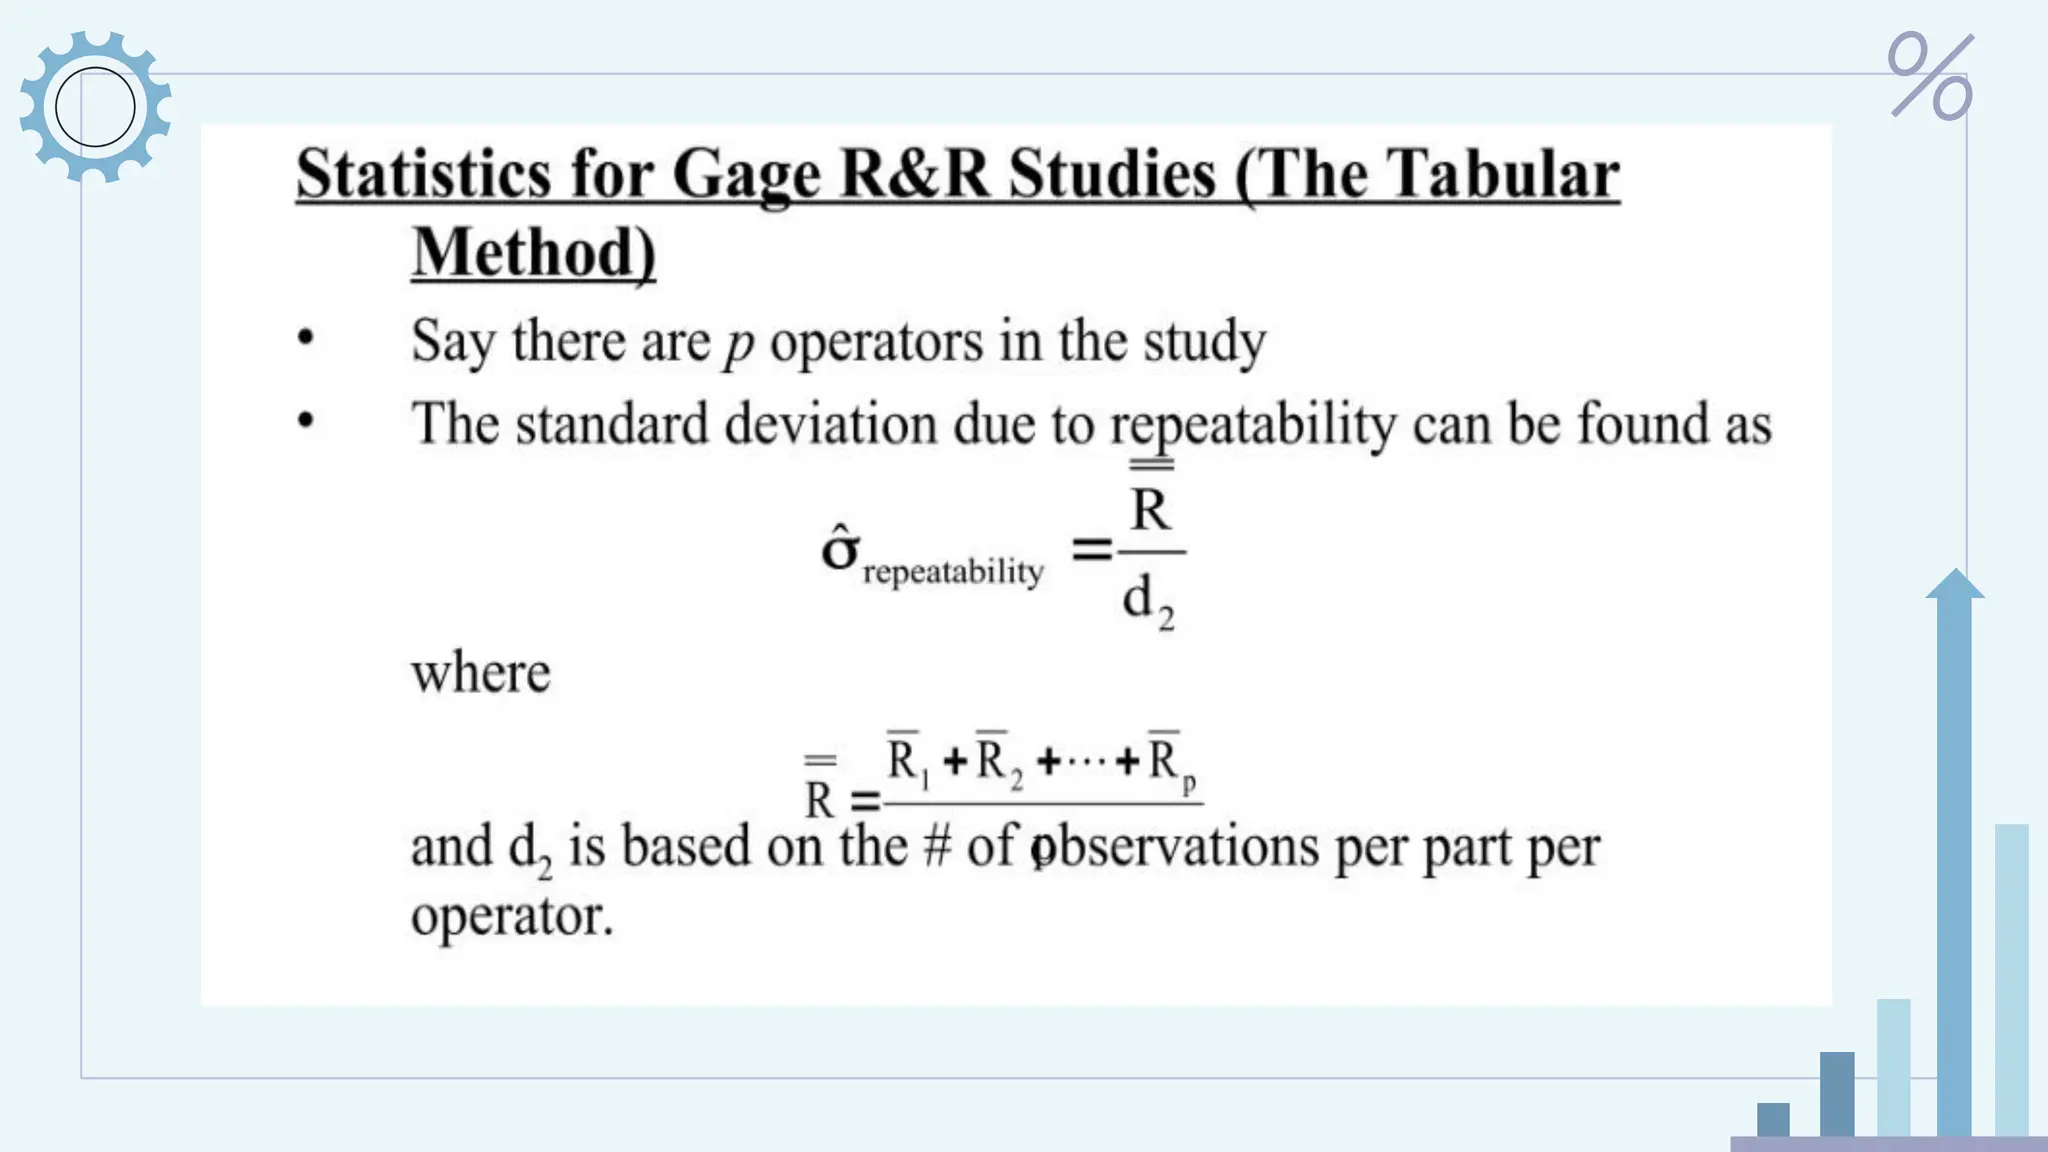
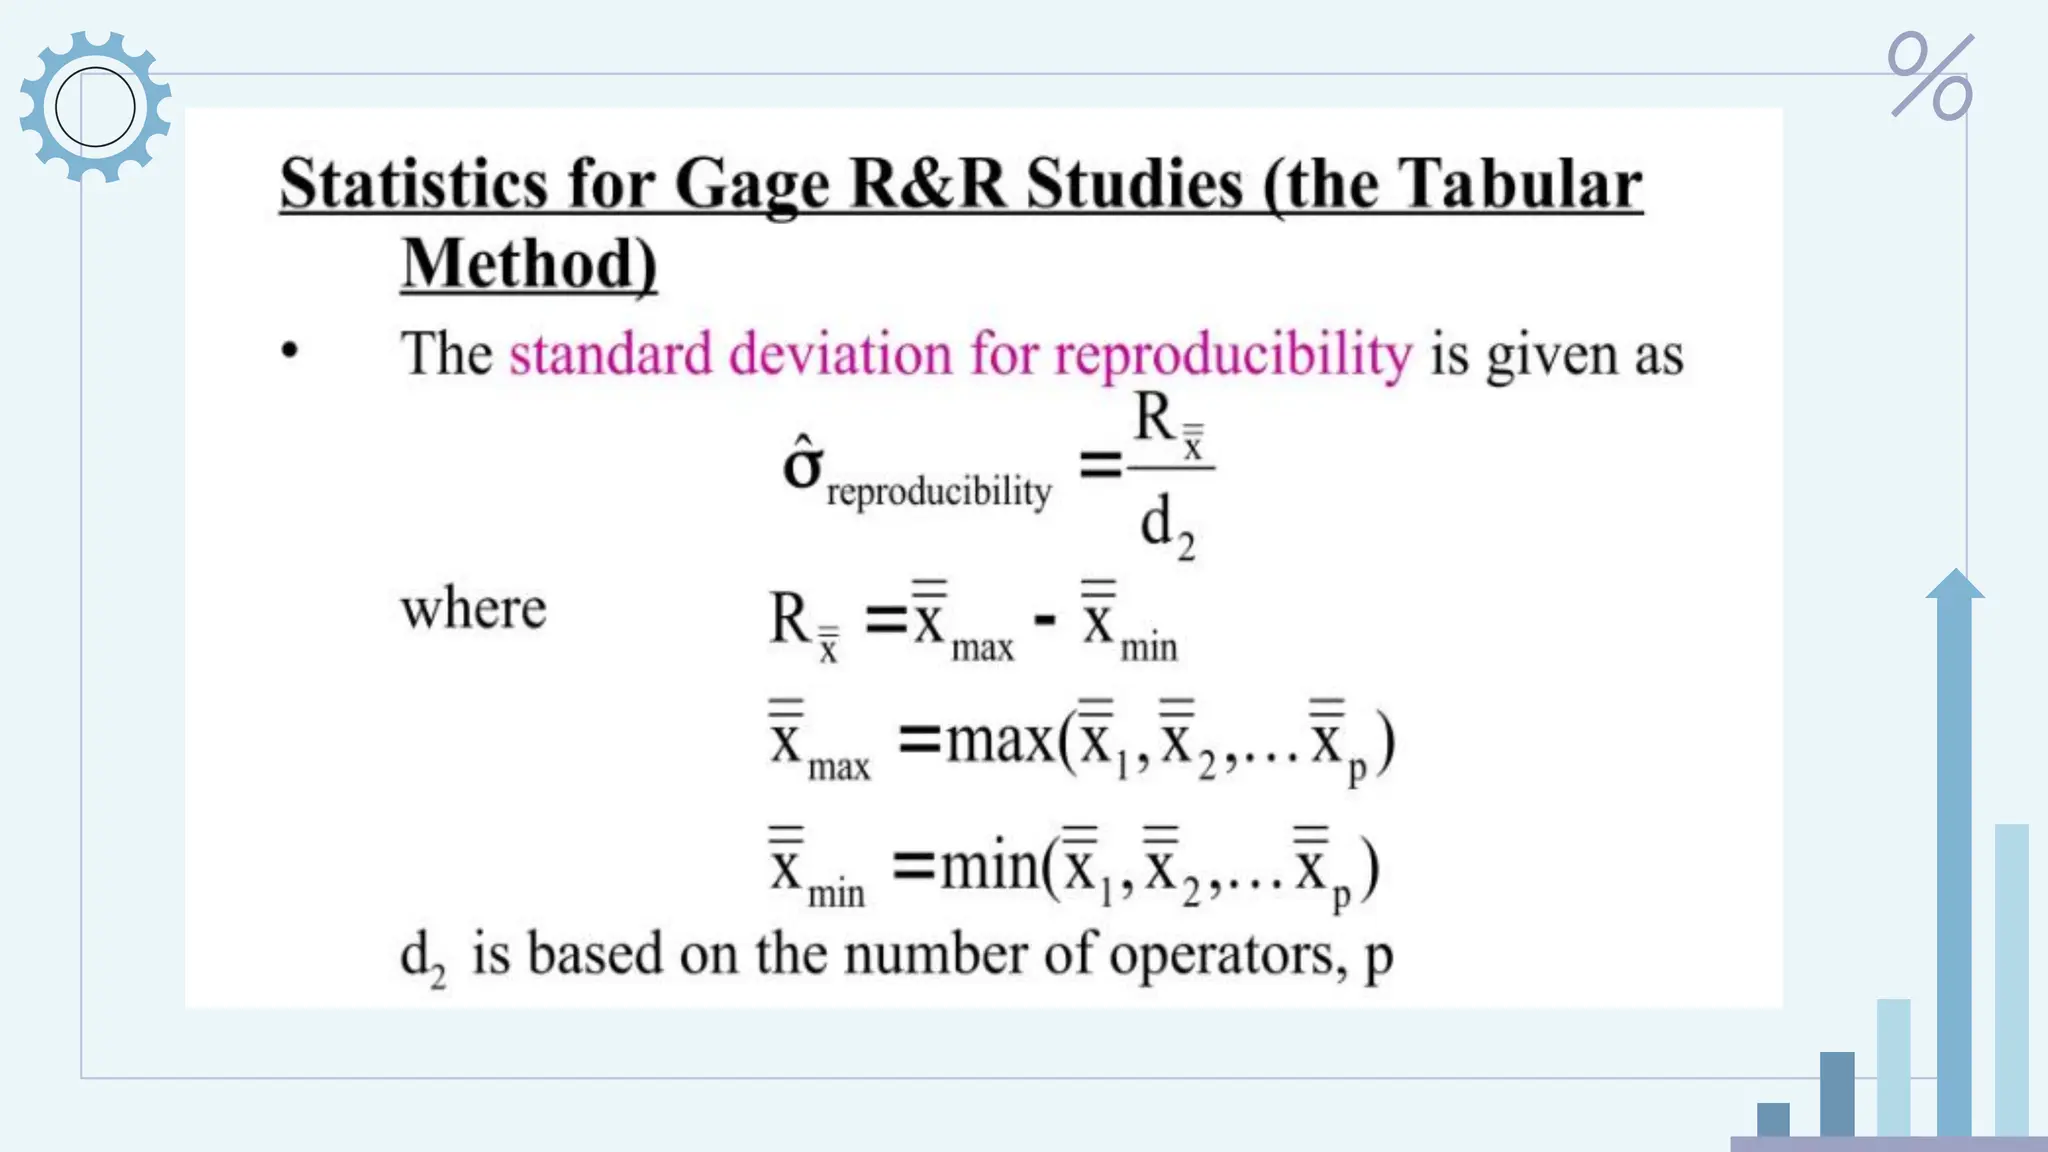
Gage R&R studies
●Gage repeatability and reproducibility ( R&R ) studies involve
breaking the total gage variability into 2 portions:
○ repeatability which is the basic inherent precision of the gage
○ reproducibility is the variability due to different operators using
gage
35.
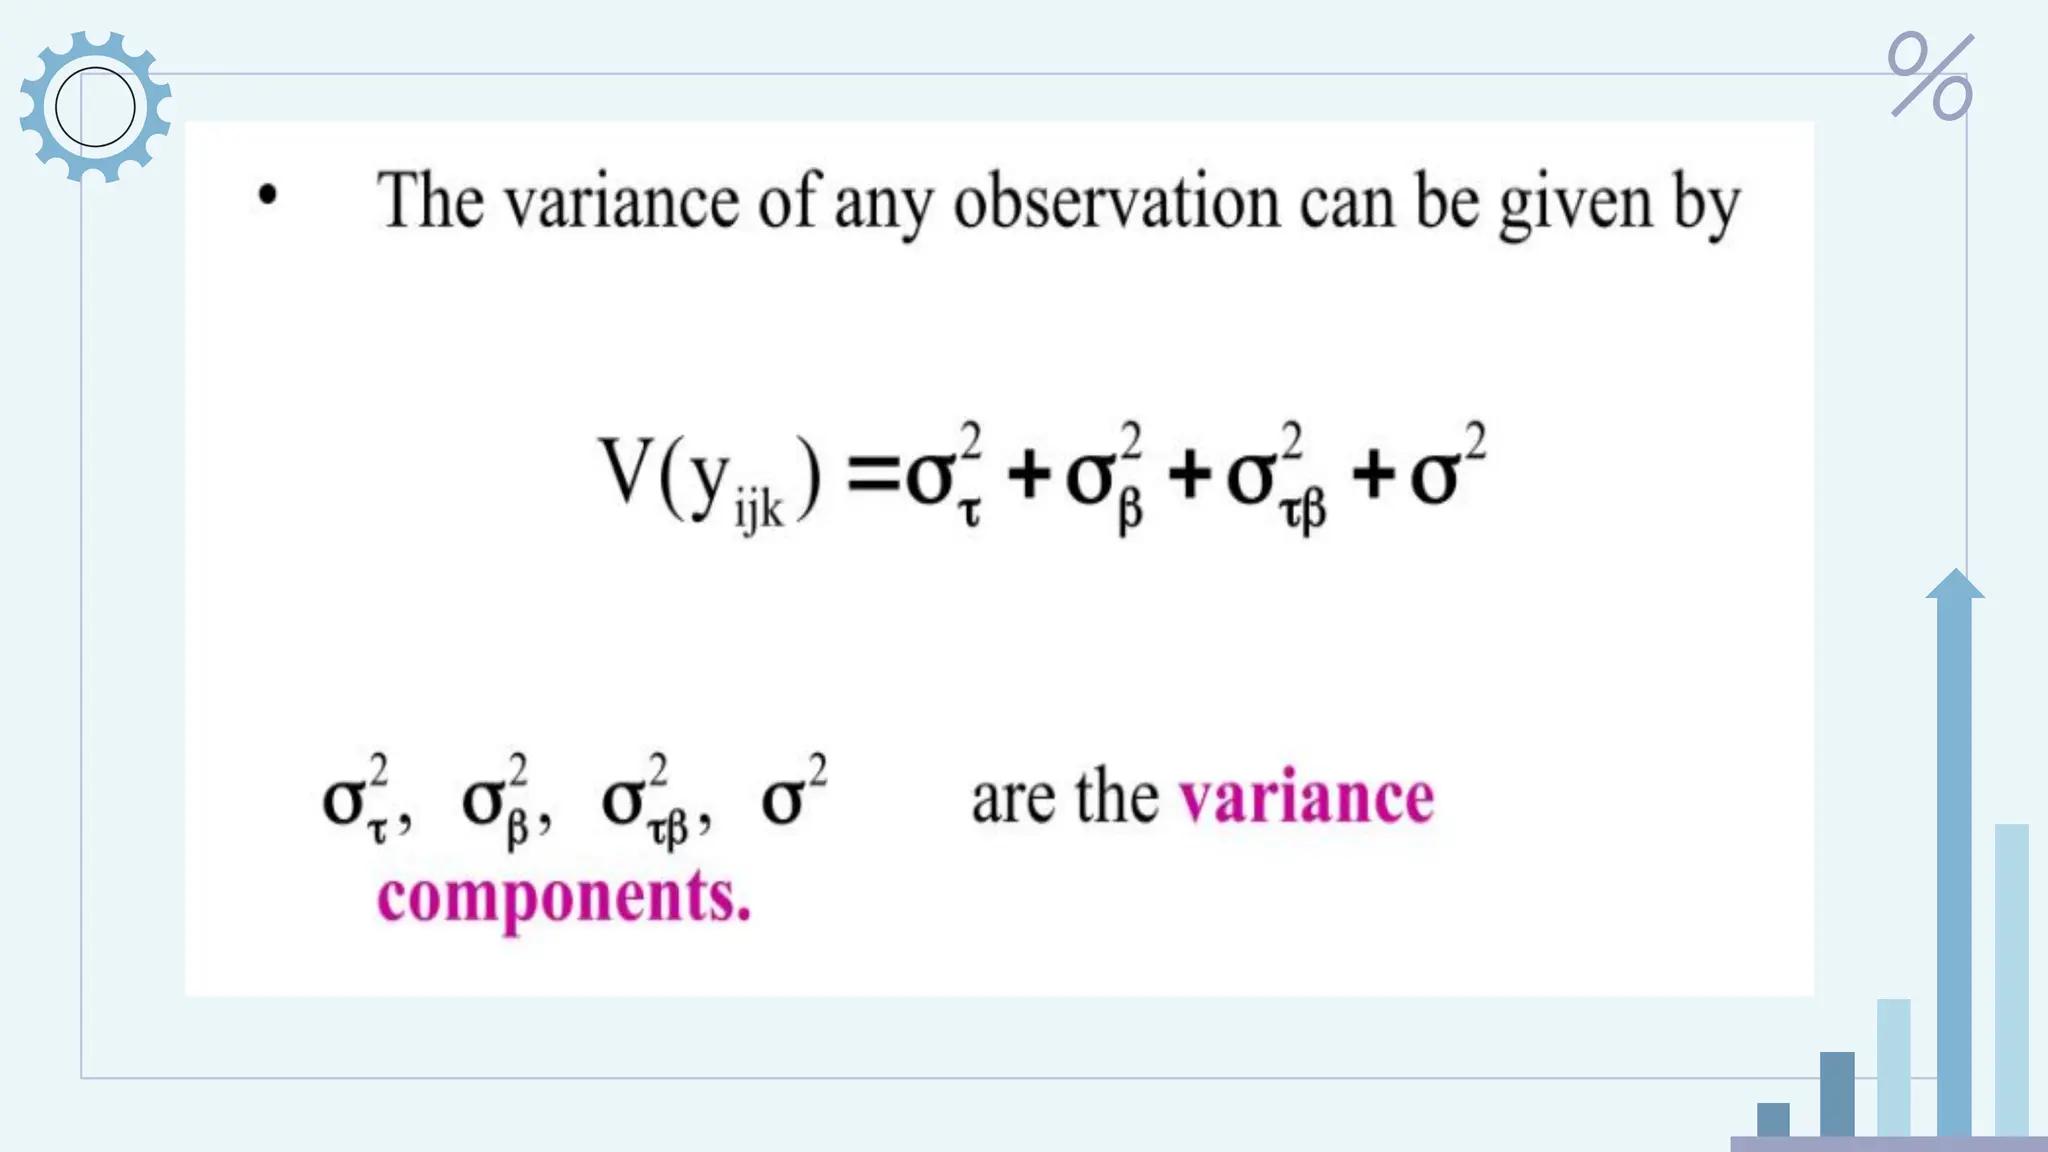
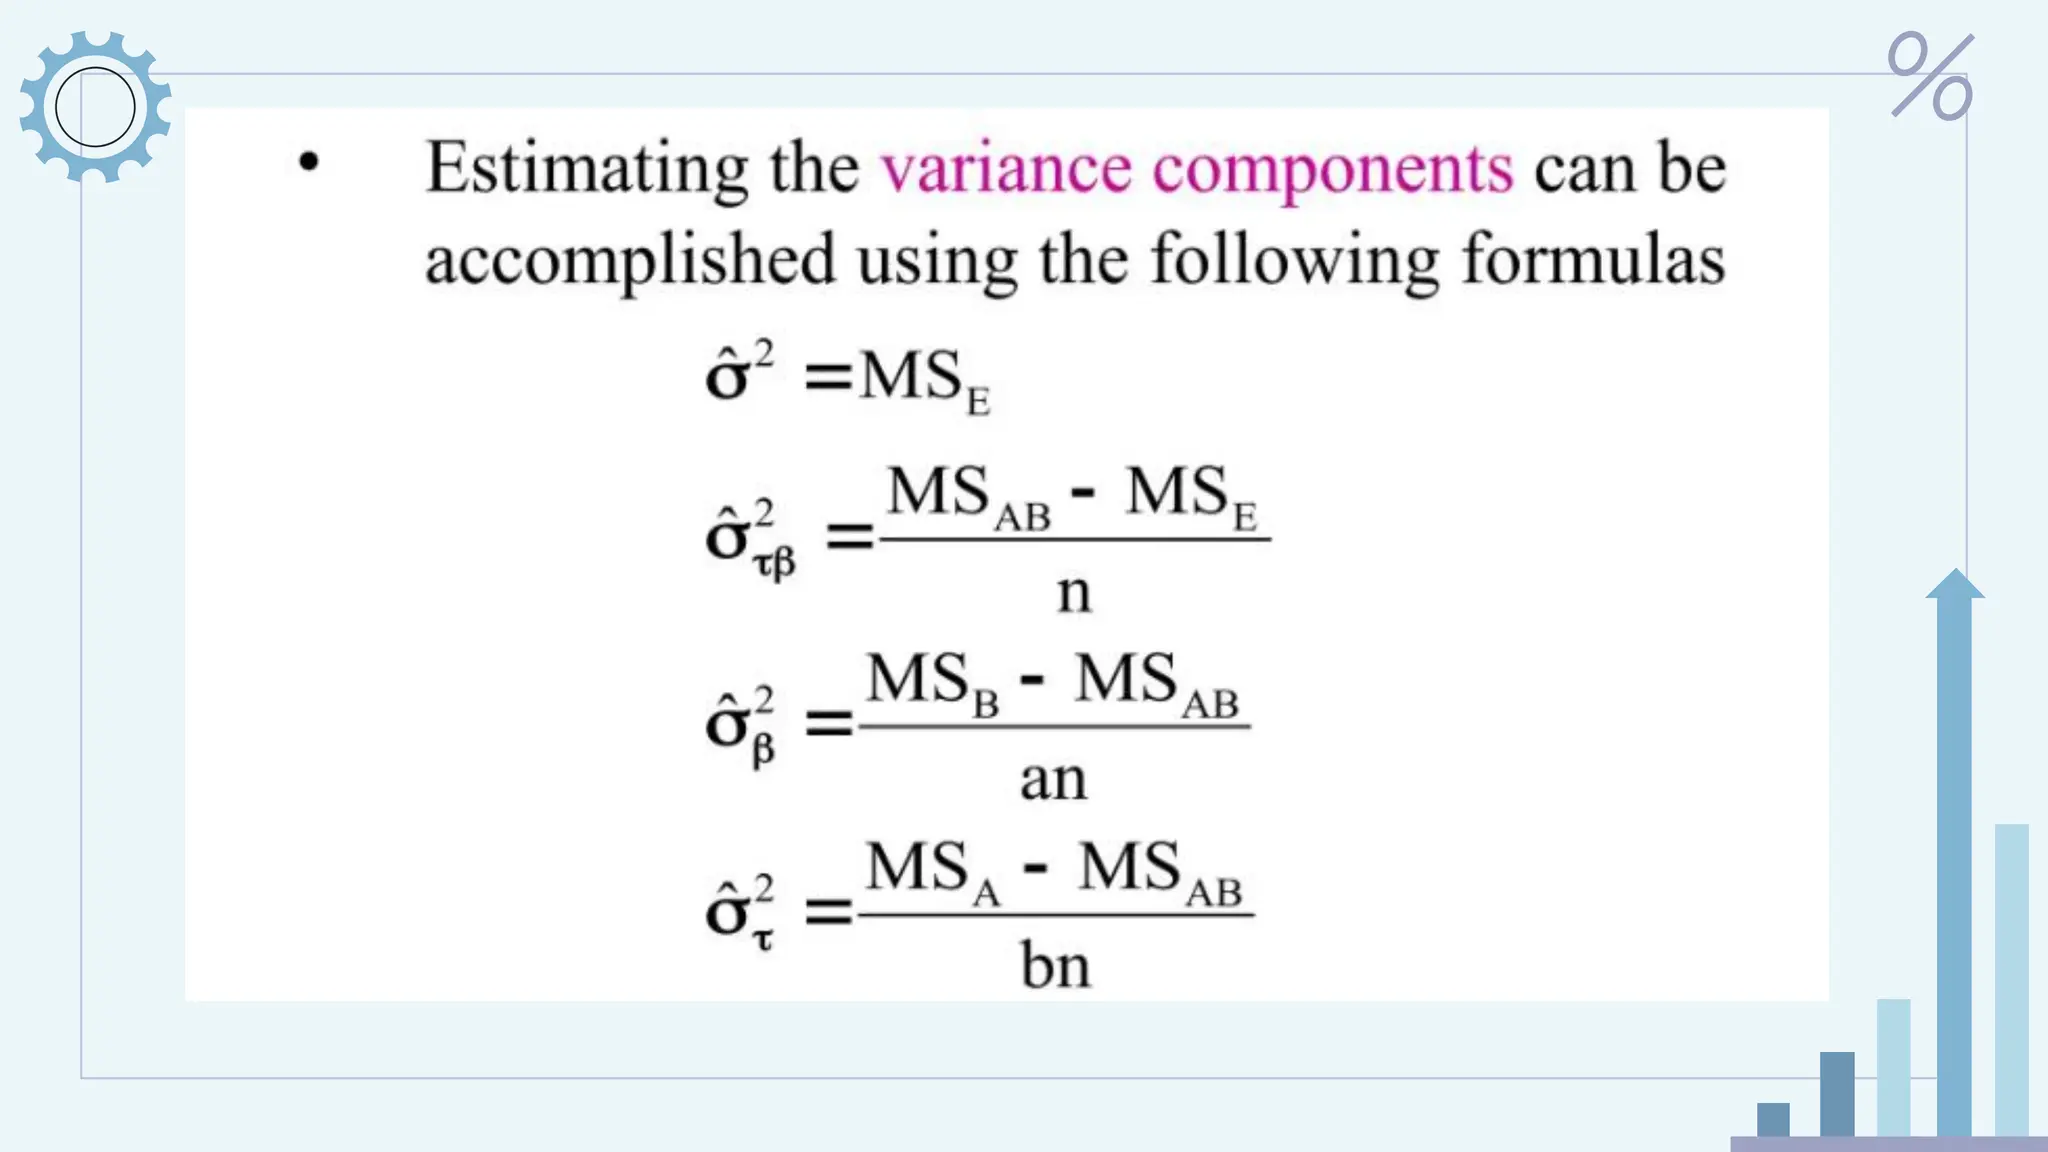
METHODS BASED ONANALYSIS OF VARIANCE
● The analysis of variance can be extended to analyze the data from an
experiment and to estimate the appropriate components of gage
variability.
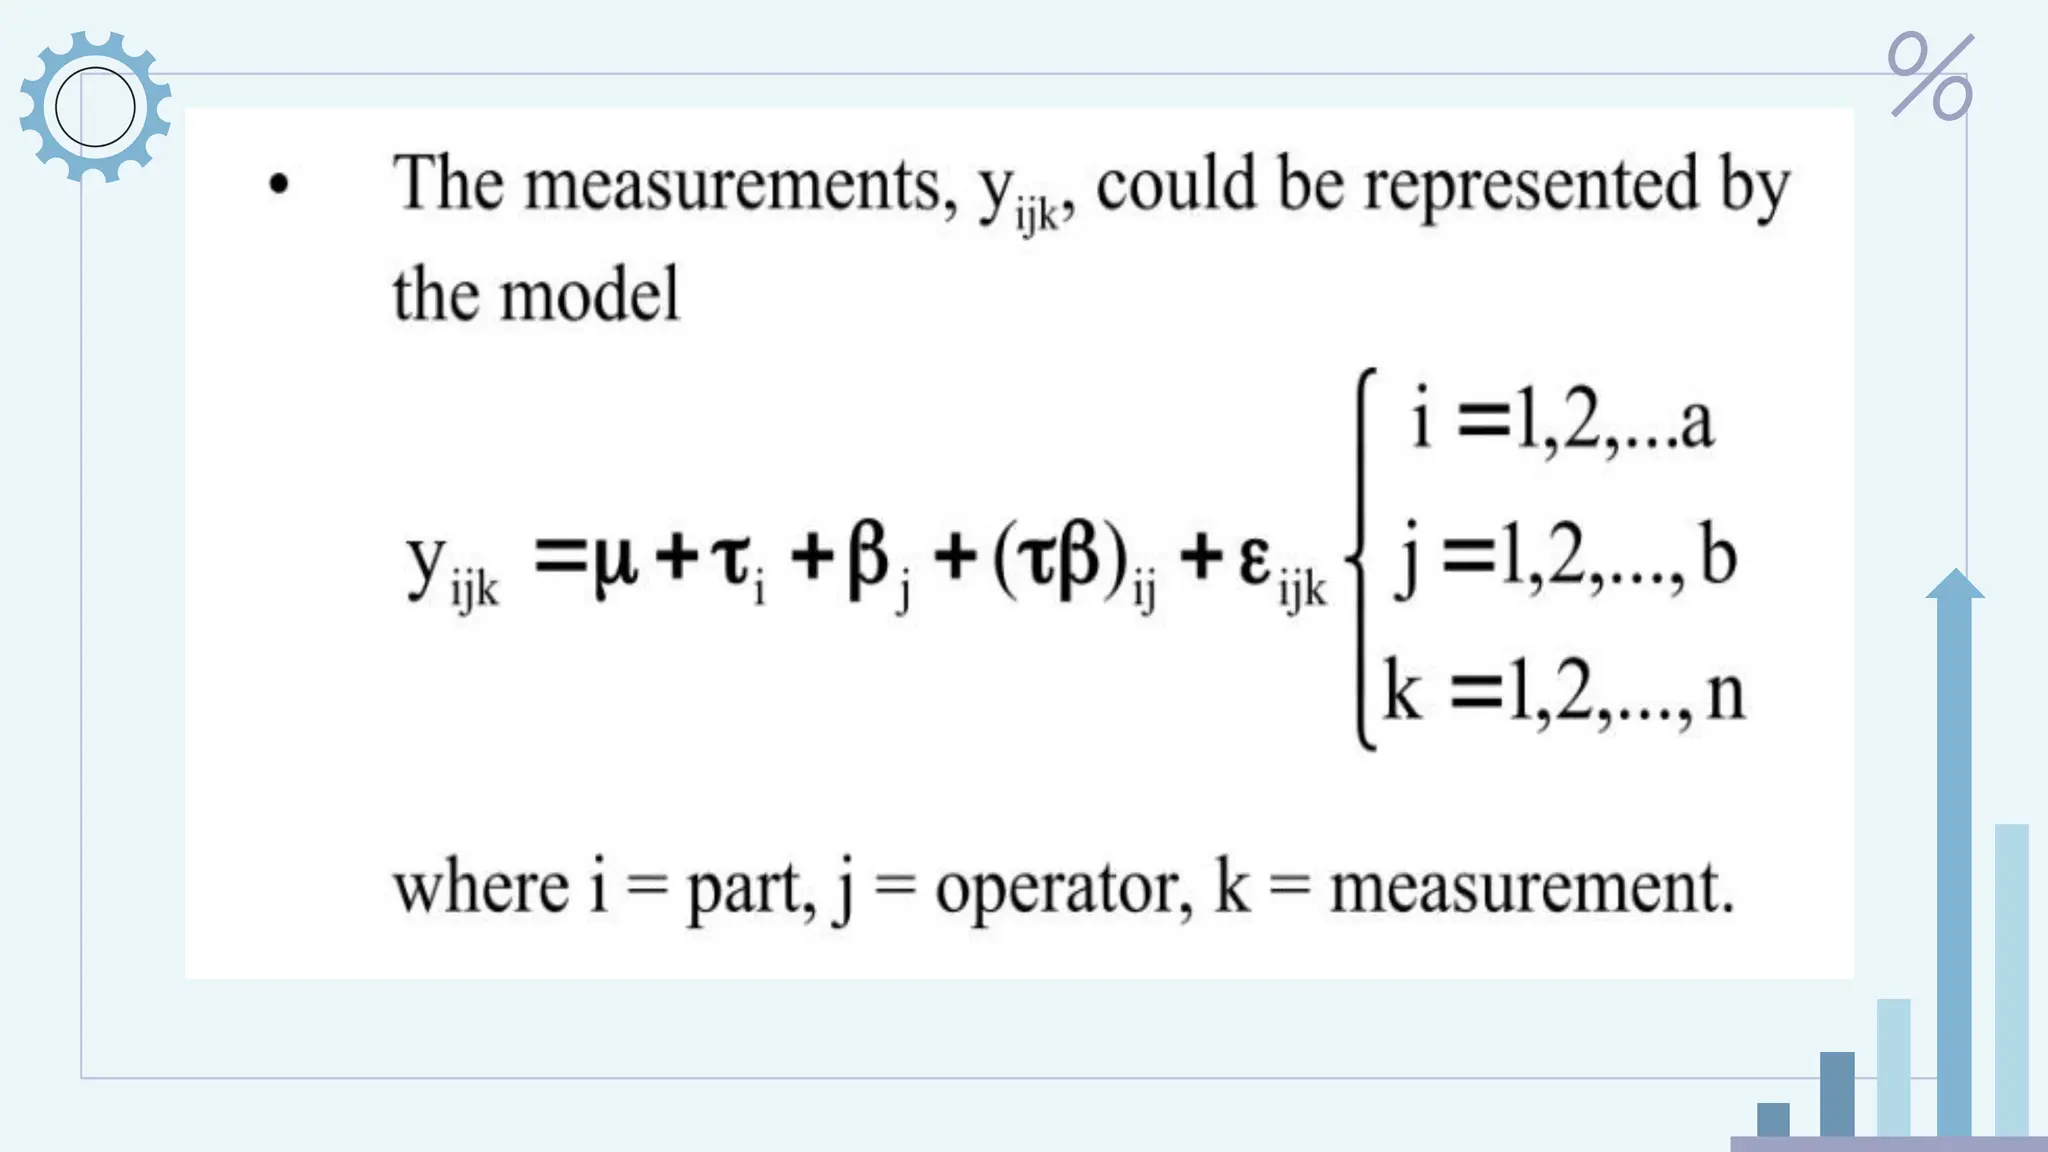
● For illustration, assume there are a parts and b operators, each
operator meausures every part n times.


![Process Capability[1]](https://cdn.slidesharecdn.com/ss_thumbnails/processcapability1-1226090261326164-9-thumbnail.jpg?width=640&height=640&fit=bounds)


![[DSC Europe 25] Boris Perkovic - Lost in performance.pptx](https://cdn.slidesharecdn.com/ss_thumbnails/uq5hrp7vsuahqkxzifux-1-251204082258-fd2ee09d-thumbnail.jpg?width=640&height=640&fit=bounds)

![[DSC Europe 25] Dusan Jovicic - AI Story: From on-prem to cloud and back agai...](https://cdn.slidesharecdn.com/ss_thumbnails/8kp49m6uq22ifnbwhfnk-2-251205085715-964d11a6-thumbnail.jpg?width=640&height=640&fit=bounds)


![[DSC Europe 25] Dragana Ilic - AI for Big Data in Astronomy.pptx](https://cdn.slidesharecdn.com/ss_thumbnails/8palya86qaatvjhva1ms-2-dragana-ilic-ai-ilic-251208151906-652b819c-thumbnail.jpg?width=640&height=640&fit=bounds)


![[DSC Europe 25] Petar Zivanov - AI meets documents From chatbots to AI-powere...](https://cdn.slidesharecdn.com/ss_thumbnails/xer2bb6nrdc8pdpev0pc-8-251204082258-7c2fa4a1-thumbnail.jpg?width=640&height=640&fit=bounds)


![[DSC Europe 25] Dragan Vucic - Building the Learning Organization - How AI Tr...](https://cdn.slidesharecdn.com/ss_thumbnails/8brigo2sbu6qur6gxrra-7-251205085715-6ae07d24-thumbnail.jpg?width=640&height=640&fit=bounds)
