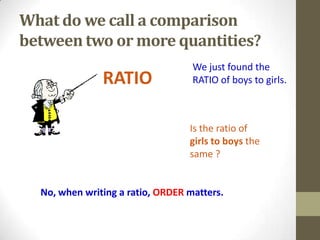
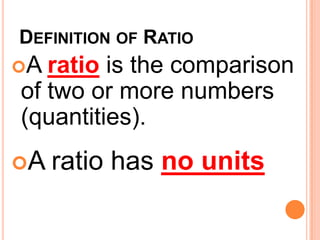
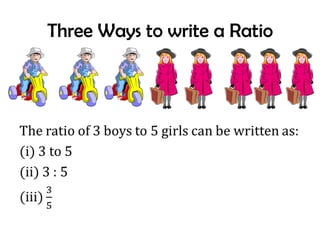
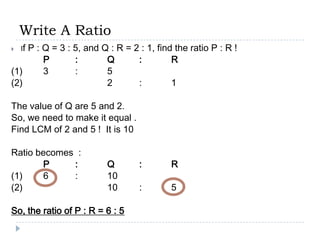
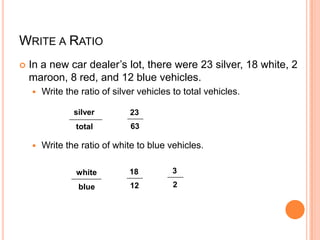
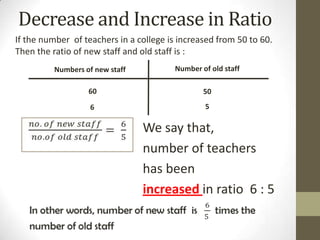
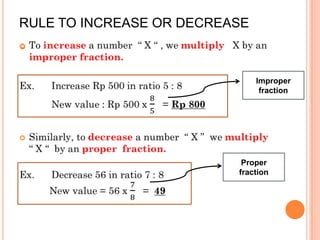
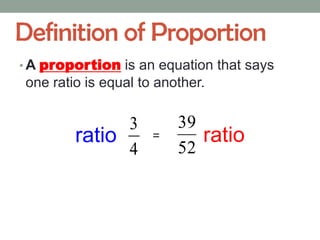
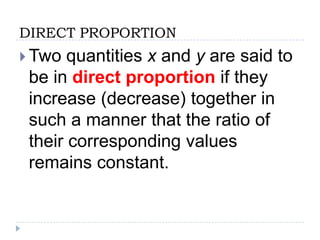
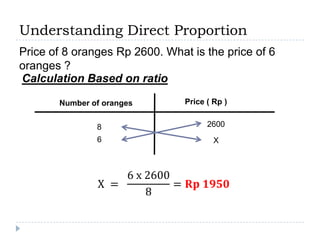
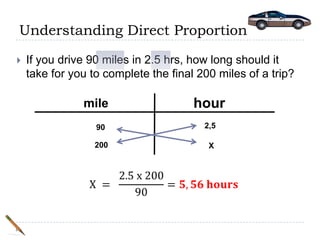
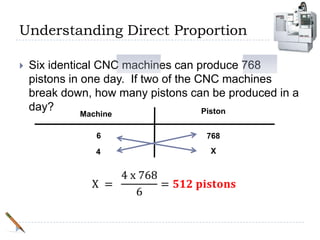
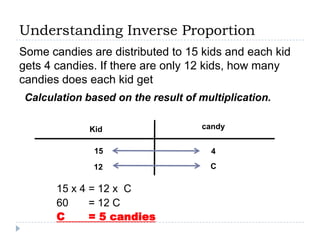
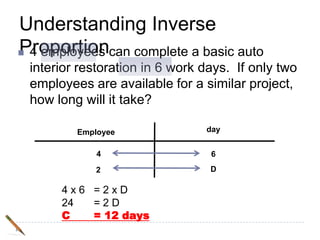
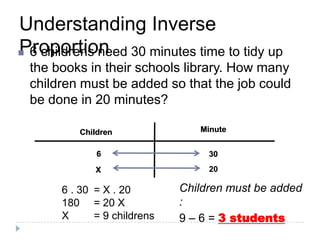
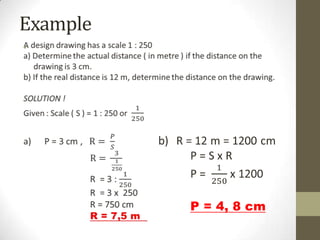
The document discusses ratios, proportions, and scale drawings. It begins by defining a ratio as a comparison of two or more quantities without units. Ratios can be written in different forms such as a:b or a to b. A proportion is an equation stating that one ratio is equal to another. Direct proportion means that as one quantity increases, the other also increases by the same factor. Inverse proportion means that as one quantity increases, the other decreases. Scale drawings use a scale ratio to show the relationship between an object's depicted size and its actual size. Examples are provided to demonstrate calculating ratios, proportions, direct and inverse proportions, and using scale ratios.
This preview may not appear the same on the actual version of the PPT slides.
Some formats may change due to font and size settings available on the audience's device.
To get/buy a soft copy, please send a request to queenyedda@gmail.com
Inclusions of the file attachment:
* Fonts used
* Soft copy of the WHOLE ppt slides with effects
ACCEPTING COMMISSIONED POWERPOINT SLIDES
EMAIL queenyedda@gmail.com
- - - - - - - - - - - - -
- Definition of Angles
- Parts of Angles
- Protractor
- Kinds of Angles
- Measuring Angles
The Assignment on the last slide is for them to have a background on the next lesson.
This slide show was prepared to help my fourth grade students understand and identify the different types of triangles and to help them with their homework.
quantitative aptitude, maths
applicable to
Common Aptitude Test (CAT)
Bank Competitive Exam
UPSC Competitive Exams
SSC Competitive Exams
Defence Competitive Exams
L.I.C/ G. I.C Competitive Exams
Railway Competitive Exam
University Grants Commission (UGC)
Career Aptitude Test (IT Companies) and etc.
Basic geometrical constuctions is how to construct angle by using compass and ruler.
this slide can help students or teachers to construct any angles especially for special angles they are 90 degree, 60 degree, 45 degree and 30 degree.
Dev Dives: Train smarter, not harder – active learning and UiPath LLMs for do...UiPathCommunity
💥 Speed, accuracy, and scaling – discover the superpowers of GenAI in action with UiPath Document Understanding and Communications Mining™:
See how to accelerate model training and optimize model performance with active learning
Learn about the latest enhancements to out-of-the-box document processing – with little to no training required
Get an exclusive demo of the new family of UiPath LLMs – GenAI models specialized for processing different types of documents and messages
This is a hands-on session specifically designed for automation developers and AI enthusiasts seeking to enhance their knowledge in leveraging the latest intelligent document processing capabilities offered by UiPath.
Speakers:
👨🏫 Andras Palfi, Senior Product Manager, UiPath
👩🏫 Lenka Dulovicova, Product Program Manager, UiPath
Essentials of Automations: Optimizing FME Workflows with ParametersSafe Software
Are you looking to streamline your workflows and boost your projects’ efficiency? Do you find yourself searching for ways to add flexibility and control over your FME workflows? If so, you’re in the right place.
Join us for an insightful dive into the world of FME parameters, a critical element in optimizing workflow efficiency. This webinar marks the beginning of our three-part “Essentials of Automation” series. This first webinar is designed to equip you with the knowledge and skills to utilize parameters effectively: enhancing the flexibility, maintainability, and user control of your FME projects.
Here’s what you’ll gain:
- Essentials of FME Parameters: Understand the pivotal role of parameters, including Reader/Writer, Transformer, User, and FME Flow categories. Discover how they are the key to unlocking automation and optimization within your workflows.
- Practical Applications in FME Form: Delve into key user parameter types including choice, connections, and file URLs. Allow users to control how a workflow runs, making your workflows more reusable. Learn to import values and deliver the best user experience for your workflows while enhancing accuracy.
- Optimization Strategies in FME Flow: Explore the creation and strategic deployment of parameters in FME Flow, including the use of deployment and geometry parameters, to maximize workflow efficiency.
- Pro Tips for Success: Gain insights on parameterizing connections and leveraging new features like Conditional Visibility for clarity and simplicity.
We’ll wrap up with a glimpse into future webinars, followed by a Q&A session to address your specific questions surrounding this topic.
Don’t miss this opportunity to elevate your FME expertise and drive your projects to new heights of efficiency.
Smart TV Buyer Insights Survey 2024 by 91mobiles.pdf91mobiles
91mobiles recently conducted a Smart TV Buyer Insights Survey in which we asked over 3,000 respondents about the TV they own, aspects they look at on a new TV, and their TV buying preferences.
Neuro-symbolic is not enough, we need neuro-*semantic*Frank van Harmelen
Neuro-symbolic (NeSy) AI is on the rise. However, simply machine learning on just any symbolic structure is not sufficient to really harvest the gains of NeSy. These will only be gained when the symbolic structures have an actual semantics. I give an operational definition of semantics as “predictable inference”.
All of this illustrated with link prediction over knowledge graphs, but the argument is general.
LF Energy Webinar: Electrical Grid Modelling and Simulation Through PowSyBl -...DanBrown980551
Do you want to learn how to model and simulate an electrical network from scratch in under an hour?
Then welcome to this PowSyBl workshop, hosted by Rte, the French Transmission System Operator (TSO)!
During the webinar, you will discover the PowSyBl ecosystem as well as handle and study an electrical network through an interactive Python notebook.
PowSyBl is an open source project hosted by LF Energy, which offers a comprehensive set of features for electrical grid modelling and simulation. Among other advanced features, PowSyBl provides:
- A fully editable and extendable library for grid component modelling;
- Visualization tools to display your network;
- Grid simulation tools, such as power flows, security analyses (with or without remedial actions) and sensitivity analyses;
The framework is mostly written in Java, with a Python binding so that Python developers can access PowSyBl functionalities as well.
What you will learn during the webinar:
- For beginners: discover PowSyBl's functionalities through a quick general presentation and the notebook, without needing any expert coding skills;
- For advanced developers: master the skills to efficiently apply PowSyBl functionalities to your real-world scenarios.
"Impact of front-end architecture on development cost", Viktor TurskyiFwdays
I have heard many times that architecture is not important for the front-end. Also, many times I have seen how developers implement features on the front-end just following the standard rules for a framework and think that this is enough to successfully launch the project, and then the project fails. How to prevent this and what approach to choose? I have launched dozens of complex projects and during the talk we will analyze which approaches have worked for me and which have not.
UiPath Test Automation using UiPath Test Suite series, part 4DianaGray10
Welcome to UiPath Test Automation using UiPath Test Suite series part 4. In this session, we will cover Test Manager overview along with SAP heatmap.
The UiPath Test Manager overview with SAP heatmap webinar offers a concise yet comprehensive exploration of the role of a Test Manager within SAP environments, coupled with the utilization of heatmaps for effective testing strategies.
Participants will gain insights into the responsibilities, challenges, and best practices associated with test management in SAP projects. Additionally, the webinar delves into the significance of heatmaps as a visual aid for identifying testing priorities, areas of risk, and resource allocation within SAP landscapes. Through this session, attendees can expect to enhance their understanding of test management principles while learning practical approaches to optimize testing processes in SAP environments using heatmap visualization techniques
What will you get from this session?
1. Insights into SAP testing best practices
2. Heatmap utilization for testing
3. Optimization of testing processes
4. Demo
Topics covered:
Execution from the test manager
Orchestrator execution result
Defect reporting
SAP heatmap example with demo
Speaker:
Deepak Rai, Automation Practice Lead, Boundaryless Group and UiPath MVP
Builder.ai Founder Sachin Dev Duggal's Strategic Approach to Create an Innova...Ramesh Iyer
In today's fast-changing business world, Companies that adapt and embrace new ideas often need help to keep up with the competition. However, fostering a culture of innovation takes much work. It takes vision, leadership and willingness to take risks in the right proportion. Sachin Dev Duggal, co-founder of Builder.ai, has perfected the art of this balance, creating a company culture where creativity and growth are nurtured at each stage.
JMeter webinar - integration with InfluxDB and GrafanaRTTS
Watch this recorded webinar about real-time monitoring of application performance. See how to integrate Apache JMeter, the open-source leader in performance testing, with InfluxDB, the open-source time-series database, and Grafana, the open-source analytics and visualization application.
In this webinar, we will review the benefits of leveraging InfluxDB and Grafana when executing load tests and demonstrate how these tools are used to visualize performance metrics.
Length: 30 minutes
Session Overview
-------------------------------------------
During this webinar, we will cover the following topics while demonstrating the integrations of JMeter, InfluxDB and Grafana:
- What out-of-the-box solutions are available for real-time monitoring JMeter tests?
- What are the benefits of integrating InfluxDB and Grafana into the load testing stack?
- Which features are provided by Grafana?
- Demonstration of InfluxDB and Grafana using a practice web application
To view the webinar recording, go to:
https://www.rttsweb.com/jmeter-integration-webinar
Transcript: Selling digital books in 2024: Insights from industry leaders - T...BookNet Canada
The publishing industry has been selling digital audiobooks and ebooks for over a decade and has found its groove. What’s changed? What has stayed the same? Where do we go from here? Join a group of leading sales peers from across the industry for a conversation about the lessons learned since the popularization of digital books, best practices, digital book supply chain management, and more.
Link to video recording: https://bnctechforum.ca/sessions/selling-digital-books-in-2024-insights-from-industry-leaders/
Presented by BookNet Canada on May 28, 2024, with support from the Department of Canadian Heritage.
Key Trends Shaping the Future of Infrastructure.pdfCheryl Hung
Keynote at DIGIT West Expo, Glasgow on 29 May 2024.
Cheryl Hung, ochery.com
Sr Director, Infrastructure Ecosystem, Arm.
The key trends across hardware, cloud and open-source; exploring how these areas are likely to mature and develop over the short and long-term, and then considering how organisations can position themselves to adapt and thrive.
2. DO NOW (not later):
• Compare the number of boys to
girls in the class.
3. • The number of boys =
• The number of girls =
• If we compare boys to girls we get
___ boys to _____ girls.
4. What do we call a comparison
between two or more quantities?
We just found the
RATIO RATIO of boys to girls.
Is the ratio of
girls to boys the
same ?
No, when writing a ratio, ORDER matters.
10. Write A Ratio
Rewrite into a ratio :
a) 15 metre to 2 km
15 m : 2 km ( ratio no units, and km change to m )
15 : 2000 ( write into simplest form )
3 : 400
b) 135 seconds : 1.5 minutes ( minute change to
second )
135 : 90 ( write into simplest form )
3:2
11. Write A Ratio
If
P : Q = 3 : 5, and Q : R = 2 : 1, find the ratio P : R !
P : Q : R
(1) 3 : 5
(2) 2 : 1
The value of Q are 5 and 2.
So, we need to make it equal .
Find LCM of 2 and 5 ! It is 10
Ratio becomes :
P : Q : R
(1) 6 : 10
(2) 10 : 5
So, the ratio of P : R = 6 : 5
12. WRITE A RATIO
In a new car dealer’s lot, there were 23 silver, 18 white, 2
maroon, 8 red, and 12 blue vehicles.
Write the ratio of silver vehicles to total vehicles.
silver 23
total 63
Write the ratio of white to blue vehicles.
white 18 3
blue 12 2
13. Decrease and Increase in Ratio
If the number of teachers in a college is increased from 50 to 60.
Then the ratio of new staff and old staff is :
Numbers of new staff Number of old staff
60 50
6 5
We say that,
number of teachers
has been
increased in ratio 6 : 5
14. RULE TO INCREASE OR DECREASE
Improper
fraction
Proper
fraction
16. Definition of Proportion
• A proportion is an equation that says
one ratio is equal to another.
3 39
ratio = ratio
4 52
17. DIRECT PROPORTION
Two quantities x and y are said to
be in direct proportion if they
increase (decrease) together in
such a manner that the ratio of
their corresponding values
remains constant.
18. Understanding Direct Proportion
Question :
Price of 8 oranges Rp 2600. What is the price of 6
oranges ? based on units
Calculation
Price 8 oranges = Rp 2600
Price 1 orange = Rp 2600 : 8
= Rp 325
Price 6 oranges = 6 x Rp 325
= Rp 1950
19. Understanding Direct Proportion
Price of 8 oranges Rp 2600. What is the price of 6
oranges ?
Calculation Based on ratio
Number of oranges Price ( Rp )
8 2600
6 X
20. Understanding Direct Proportion
If you drive 90 miles in 2.5 hrs, how long should it
take for you to complete the final 200 miles of a trip?
mile hour
90 2,5
200 X
21. Understanding Direct Proportion
Six identical CNC machines can produce 768
pistons in one day. If two of the CNC machines
break down, how many pistons can be produced in a
day? Piston
Machine
6 768
4 X
22. INVERSE PROPORTION
In the inverse proportion, if the
quantity x increases, the
quantity y decreases, or when
the quantity x decreases, the
quantity y increases.
23. Understanding Inverse Proportion
Some candies are distributed to 15 kids and each kid
gets 4 candies. If there are only 12 kids, how many
candies does each kid get
Calculation based on the result of multiplication.
Kid candy
15 4
12 C
15 x 4 = 12 x C
60 = 12 C
C = 5 candies
24. Understanding Inverse
Proportion
4 employees can complete a basic auto
interior restoration in 6 work days. If only two
employees are available for a similar project,
how long will it take?
Employee day
4 6
2 D
4x6 =2xD
24 =2D
C = 12 days
25. Understanding Inverse
Proportion
6 childrens need 30 minutes time to tidy up
the books in their schools library. How many
children must be added so that the job could
be done in 20 minutes?
Children Minute
6 30
X 20
6 . 30 = X . 20 Children must be added
180 = 20 X :
X = 9 childrens 9 – 6 = 3 students