SlideShare a Scribd company logo
Course 3, Lesson 9-5
Find the mean, median, and mode of each data set. Round to
the nearest tenth if necessary.
1. 4, 2, 5, 4, 7, 4, 1, 5
2. 17, 21, 15, 18, 21, 18, 23
3. 35, 34, 39, 33, 34
4. 81, 72, 73, 72, 66, 81
5. The students in Mrs. Hesse’s math class scored
91%, 85%, 77%, 87%, 97%, 63%, 73%, 81%, 62%, and 83%.
What is the range of their scores?
6. What is the interquartile range of the data in the line plot?
Course 3, Lesson 9-5
ANSWERS
1. 4; 4; 4
2. 19; 18; 18 and 21
3. 35; 34; 34
4. 74.2; 72.5; 81 and 72
5. 35
6. 23
HOW are patterns used
when comparing two quantities?
Statistics and Probability
Course 3, Lesson 9-5
Course 3, Lesson 9-5 Common Core State Standards © Copyright 2010. National Governors Association Center for
Best Practices and Council of Chief State School Officers. All rights reserved.
Statistics and Probability
• Preparation for S.ID.2
Use statistics appropriate to the shape of the data distribution to
compare center (median, mean) and spread (interquartile range,
standard deviation) of two or more different data sets.
Mathematical Practices
1 Make sense of problems and persevere in solving them.
3 Construct viable arguments and critique the reasoning of others.
4 Model with mathematics.
7 Look for and make use of structure.
To
• calculate the mean absolute deviation of a
data set,
• use the standard deviation of a data set
Course 3, Lesson 9-5
Statistics and Probability
• mean absolute deviation
• standard deviation
Course 3, Lesson 9-5
Statistics and Probability
1
Need Another Example?
2
3
4
Step-by-Step Example
1. The table shows the heights of the first eight
people standing in line to ride a roller coaster.
Find the mean absolute deviation of the set of
data. Describe what the mean absolute
deviation represents.
Find the absolute value of the differences between each value in the data set
and the mean.
Find the mean.
The mean absolute deviation is 3.75. This means that the average distance
each person’s height is from the mean height is 3.75 inches.
Find the average of the absolute values of the differences between each value in
the data set and the mean.
= 56
|52 – 56| = 4 |59 – 56| = 3
|48 – 56| = 8 |54 – 56| = 2
|60 – 56| = 4 |58 – 56| = 2
|55 – 56| = 1 |62 – 56| = 6
Answer
Need Another Example?
The table shows the admission prices at different movie
theaters. Find the mean absolute deviation of the set of data.
Describe what the mean absolute deviation represents.
0.50; Sample answer: The average distance
each value is from the mean is $0.50.
1
Need Another Example?
2
3
Step-by-Step Example
2. The standard deviation of quiz
scores for Class A is about 1.2.
Describe the quiz scores that are
within one standard deviation of
the mean.
Find the range of values that are within one standard deviation of the mean.
Find the mean.
Quiz scores that are between 7.05 and 9.45 points are within one standard
deviation of the mean.
mean = = 8.25
8.25 – 1.2 = 7.05
8.25 + 1.2 = 9.45
Subtract the standard deviation from the mean.
Add the standard deviation to the mean.
Answer
Need Another Example?
The standard deviation of posts on a Web site
is about 30.7. Describe the posts that are within
one standard deviation of the mean.
The number of posts that are between
145 and 206.4 are within one standard
deviation of the mean.
How did what you learned
today help you answer the
How are patterns used
when comparing two quantities?
Course 3, Lesson 9-5
GeometryStatistics and Probability
How did what you learned
today help you answer the
How are patterns used
when comparing two quantities?
Course 3, Lesson 9-5
GeometryStatistics and Probability
Sample answers:
• One pattern is the mean absolute deviation. The mean
absolute deviation describes the average distance
between each data value and the mean.
• Another pattern is the standard deviation. Most of the
data in a set fall within one standard deviation of the
mean.
Write a set of directions for
finding the mean absolute
deviation for a data set.
Course 3, Lesson 9-5
Ratios and Proportional RelationshipsFunctionsStatistics and Probability

More Related Content

What's hot

Stattistic ii - mode, median, mean
Stattistic ii - mode, median, meanStattistic ii - mode, median, mean
Stattistic ii - mode, median, meanamsy1224
 
Fractional exponents
Fractional exponentsFractional exponents
Fractional exponents
MartinGeraldine
 
Central tendency Measures and Variability
Central tendency Measures and VariabilityCentral tendency Measures and Variability
Central tendency Measures and Variability
Pedro Martinez
 
Union, intersection & compliment
Union, intersection & complimentUnion, intersection & compliment
Union, intersection & compliment
Ahsan Raza
 
Measure of Central Tendency
Measure of Central TendencyMeasure of Central Tendency
Measure of Central Tendency
gladysoliveros
 
Math533 final exam_study_guide
Math533 final exam_study_guideMath533 final exam_study_guide
Math533 final exam_study_guide
gradstudent3
 
Lesson 1.5 (8)
Lesson 1.5 (8)Lesson 1.5 (8)
Lesson 1.5 (8)
wzuri
 
Math 221 week 6 live lecture
Math 221 week 6 live lectureMath 221 week 6 live lecture
Math 221 week 6 live lecture
Brent Heard
 
Sherri Collie
Sherri CollieSherri Collie
Sherri Collie
smcbubbles
 
Math 221 week 1 lecture nov 2012 with help
Math 221 week 1 lecture nov 2012 with helpMath 221 week 1 lecture nov 2012 with help
Math 221 week 1 lecture nov 2012 with help
Brent Heard
 
Lesson plan in mathematics grade 10
Lesson plan in mathematics grade 10Lesson plan in mathematics grade 10
Lesson plan in mathematics grade 10
Randel Roy Raluto
 
Measures of Central Tendency and Dispersion
Measures of Central Tendency and DispersionMeasures of Central Tendency and Dispersion
Measures of Central Tendency and Dispersion
Pharmacy Universe
 
Applied 40S March 23, 2009
Applied 40S March 23, 2009Applied 40S March 23, 2009
Applied 40S March 23, 2009
Darren Kuropatwa
 
Measures of Central Tendencies
Measures of Central TendenciesMeasures of Central Tendencies
Measures of Central Tendencies
Angel Mae Longakit
 
Non Conventional Methods for Solving Equations
Non Conventional Methods for Solving EquationsNon Conventional Methods for Solving Equations
Non Conventional Methods for Solving Equations
MHS
 
Mean, median, mode, and range
Mean, median, mode, and rangeMean, median, mode, and range
Mean, median, mode, and rangeschool4251181
 
Tendency
TendencyTendency
Tendency
magoffinsave
 

What's hot (20)

Stattistic ii - mode, median, mean
Stattistic ii - mode, median, meanStattistic ii - mode, median, mean
Stattistic ii - mode, median, mean
 
Fractional exponents
Fractional exponentsFractional exponents
Fractional exponents
 
Chapter 3.2
Chapter 3.2Chapter 3.2
Chapter 3.2
 
Central tendency Measures and Variability
Central tendency Measures and VariabilityCentral tendency Measures and Variability
Central tendency Measures and Variability
 
Union, intersection & compliment
Union, intersection & complimentUnion, intersection & compliment
Union, intersection & compliment
 
Measure of Central Tendency
Measure of Central TendencyMeasure of Central Tendency
Measure of Central Tendency
 
Math533 final exam_study_guide
Math533 final exam_study_guideMath533 final exam_study_guide
Math533 final exam_study_guide
 
Lesson 1.5 (8)
Lesson 1.5 (8)Lesson 1.5 (8)
Lesson 1.5 (8)
 
Math 221 week 6 live lecture
Math 221 week 6 live lectureMath 221 week 6 live lecture
Math 221 week 6 live lecture
 
Sherri Collie
Sherri CollieSherri Collie
Sherri Collie
 
Math 221 week 1 lecture nov 2012 with help
Math 221 week 1 lecture nov 2012 with helpMath 221 week 1 lecture nov 2012 with help
Math 221 week 1 lecture nov 2012 with help
 
Lesson plan in mathematics grade 10
Lesson plan in mathematics grade 10Lesson plan in mathematics grade 10
Lesson plan in mathematics grade 10
 
Measures of Central Tendency and Dispersion
Measures of Central Tendency and DispersionMeasures of Central Tendency and Dispersion
Measures of Central Tendency and Dispersion
 
Applied 40S March 23, 2009
Applied 40S March 23, 2009Applied 40S March 23, 2009
Applied 40S March 23, 2009
 
Measures of Central Tendencies
Measures of Central TendenciesMeasures of Central Tendencies
Measures of Central Tendencies
 
Non Conventional Methods for Solving Equations
Non Conventional Methods for Solving EquationsNon Conventional Methods for Solving Equations
Non Conventional Methods for Solving Equations
 
Mean, median, mode, and range
Mean, median, mode, and rangeMean, median, mode, and range
Mean, median, mode, and range
 
P1 Stroop
P1 StroopP1 Stroop
P1 Stroop
 
06 regression
06 regression06 regression
06 regression
 
Tendency
TendencyTendency
Tendency
 

Similar to (8) Lesson 9.5

(8) Lesson 9.3
(8) Lesson 9.3(8) Lesson 9.3
(8) Lesson 9.3
wzuri
 
(8) Lesson 9.4
(8) Lesson 9.4(8) Lesson 9.4
(8) Lesson 9.4
wzuri
 
Module 3 statistics
Module 3   statisticsModule 3   statistics
Module 3 statistics
dionesioable
 
Algebra unit 9.3
Algebra unit 9.3Algebra unit 9.3
Algebra unit 9.3
Mark Ryder
 
Applied Math 40S March 17, 2008
Applied Math 40S March 17, 2008Applied Math 40S March 17, 2008
Applied Math 40S March 17, 2008
Darren Kuropatwa
 
Practice Test 1
Practice Test 1Practice Test 1
Practice Test 1
Long Beach City College
 
Kumpulan soal statistik dalam Bahasa Inggris
Kumpulan soal statistik dalam Bahasa InggrisKumpulan soal statistik dalam Bahasa Inggris
Kumpulan soal statistik dalam Bahasa InggrisRetna Rindayani
 
presentation2.pptx
presentation2.pptxpresentation2.pptx
presentation2.pptx
JOANNAMARIECAOILE
 
MEASURES OF CENTRAL TENDENCY AND VARIABILITY
MEASURES OF CENTRAL TENDENCY AND VARIABILITYMEASURES OF CENTRAL TENDENCY AND VARIABILITY
MEASURES OF CENTRAL TENDENCY AND VARIABILITYMariele Brutas
 
Penggambaran Data Secara Numerik
Penggambaran Data Secara NumerikPenggambaran Data Secara Numerik
Penggambaran Data Secara Numerik
anom1392
 
Measures of Central Tendency
Measures of Central TendencyMeasures of Central Tendency
Measures of Central Tendency
Regina Cruz
 
Measures of central tendency
Measures of central tendencyMeasures of central tendency
Measures of central tendency
Srinivasan Padmanaban
 
Topic 8a Basic Statistics
Topic 8a Basic StatisticsTopic 8a Basic Statistics
Topic 8a Basic StatisticsYee Bee Choo
 
Module 2 lesson 3 notes
Module 2 lesson 3 notesModule 2 lesson 3 notes
Module 2 lesson 3 notes
Cumberland County Schools
 
As mentioned earlier, the mid-term will have conceptual and quanti.docx
As mentioned earlier, the mid-term will have conceptual and quanti.docxAs mentioned earlier, the mid-term will have conceptual and quanti.docx
As mentioned earlier, the mid-term will have conceptual and quanti.docx
fredharris32
 

Similar to (8) Lesson 9.5 (20)

(8) Lesson 9.3
(8) Lesson 9.3(8) Lesson 9.3
(8) Lesson 9.3
 
(8) Lesson 9.4
(8) Lesson 9.4(8) Lesson 9.4
(8) Lesson 9.4
 
Module 3 statistics
Module 3   statisticsModule 3   statistics
Module 3 statistics
 
Algebra unit 9.3
Algebra unit 9.3Algebra unit 9.3
Algebra unit 9.3
 
Applied Math 40S March 17, 2008
Applied Math 40S March 17, 2008Applied Math 40S March 17, 2008
Applied Math 40S March 17, 2008
 
Practice Test 1
Practice Test 1Practice Test 1
Practice Test 1
 
Mean, median, mode and range
Mean, median, mode and rangeMean, median, mode and range
Mean, median, mode and range
 
Kumpulan soal statistik dalam Bahasa Inggris
Kumpulan soal statistik dalam Bahasa InggrisKumpulan soal statistik dalam Bahasa Inggris
Kumpulan soal statistik dalam Bahasa Inggris
 
Test pp
Test ppTest pp
Test pp
 
Unit 2 - Statistics
Unit 2 - StatisticsUnit 2 - Statistics
Unit 2 - Statistics
 
Chapter 3
Chapter 3Chapter 3
Chapter 3
 
Chapter 3
Chapter 3Chapter 3
Chapter 3
 
presentation2.pptx
presentation2.pptxpresentation2.pptx
presentation2.pptx
 
MEASURES OF CENTRAL TENDENCY AND VARIABILITY
MEASURES OF CENTRAL TENDENCY AND VARIABILITYMEASURES OF CENTRAL TENDENCY AND VARIABILITY
MEASURES OF CENTRAL TENDENCY AND VARIABILITY
 
Penggambaran Data Secara Numerik
Penggambaran Data Secara NumerikPenggambaran Data Secara Numerik
Penggambaran Data Secara Numerik
 
Measures of Central Tendency
Measures of Central TendencyMeasures of Central Tendency
Measures of Central Tendency
 
Measures of central tendency
Measures of central tendencyMeasures of central tendency
Measures of central tendency
 
Topic 8a Basic Statistics
Topic 8a Basic StatisticsTopic 8a Basic Statistics
Topic 8a Basic Statistics
 
Module 2 lesson 3 notes
Module 2 lesson 3 notesModule 2 lesson 3 notes
Module 2 lesson 3 notes
 
As mentioned earlier, the mid-term will have conceptual and quanti.docx
As mentioned earlier, the mid-term will have conceptual and quanti.docxAs mentioned earlier, the mid-term will have conceptual and quanti.docx
As mentioned earlier, the mid-term will have conceptual and quanti.docx
 

More from wzuri

Chapter 3
Chapter 3Chapter 3
Chapter 3
wzuri
 
Chapter 2 inquiry_lab_presentation_course_3 (1)
Chapter 2 inquiry_lab_presentation_course_3 (1)Chapter 2 inquiry_lab_presentation_course_3 (1)
Chapter 2 inquiry_lab_presentation_course_3 (1)
wzuri
 
Chapter 2 Review
Chapter 2 ReviewChapter 2 Review
Chapter 2 Review
wzuri
 
Chapter 2 lesson_4_presentation_course_3
Chapter 2 lesson_4_presentation_course_3Chapter 2 lesson_4_presentation_course_3
Chapter 2 lesson_4_presentation_course_3
wzuri
 
Chapter 5
Chapter 5Chapter 5
Chapter 5
wzuri
 
Lesson 5.1
Lesson 5.1Lesson 5.1
Lesson 5.1
wzuri
 
Lesson 1.8 grade 8
Lesson 1.8   grade 8Lesson 1.8   grade 8
Lesson 1.8 grade 8
wzuri
 
Chapter 7
Chapter 7Chapter 7
Chapter 7
wzuri
 
Lesson 7.4
Lesson 7.4Lesson 7.4
Lesson 7.4
wzuri
 
Lesson 7.3 (8)
Lesson 7.3 (8)Lesson 7.3 (8)
Lesson 7.3 (8)
wzuri
 
Lesson 7.2
Lesson 7.2Lesson 7.2
Lesson 7.2
wzuri
 
Pat05 ppt 0201
Pat05 ppt 0201Pat05 ppt 0201
Pat05 ppt 0201
wzuri
 
Chapter 6
Chapter 6Chapter 6
Chapter 6
wzuri
 
Pat05 ppt 0106
Pat05 ppt 0106Pat05 ppt 0106
Pat05 ppt 0106
wzuri
 
Pat05 ppt 0105
Pat05 ppt 0105Pat05 ppt 0105
Pat05 ppt 0105
wzuri
 
Chapter 1 Review
Chapter 1 ReviewChapter 1 Review
Chapter 1 Review
wzuri
 
Lesson 1.10 grade 8
Lesson 1.10   grade 8Lesson 1.10   grade 8
Lesson 1.10 grade 8
wzuri
 
Lesson 1.9 grade 8
Lesson 1.9   grade 8Lesson 1.9   grade 8
Lesson 1.9 grade 8
wzuri
 
Lesson 1.7 grade 8
Lesson 1.7   grade 8Lesson 1.7   grade 8
Lesson 1.7 grade 8
wzuri
 
Lesson 1.7 grade 8
Lesson 1.7   grade 8Lesson 1.7   grade 8
Lesson 1.7 grade 8
wzuri
 

More from wzuri (20)

Chapter 3
Chapter 3Chapter 3
Chapter 3
 
Chapter 2 inquiry_lab_presentation_course_3 (1)
Chapter 2 inquiry_lab_presentation_course_3 (1)Chapter 2 inquiry_lab_presentation_course_3 (1)
Chapter 2 inquiry_lab_presentation_course_3 (1)
 
Chapter 2 Review
Chapter 2 ReviewChapter 2 Review
Chapter 2 Review
 
Chapter 2 lesson_4_presentation_course_3
Chapter 2 lesson_4_presentation_course_3Chapter 2 lesson_4_presentation_course_3
Chapter 2 lesson_4_presentation_course_3
 
Chapter 5
Chapter 5Chapter 5
Chapter 5
 
Lesson 5.1
Lesson 5.1Lesson 5.1
Lesson 5.1
 
Lesson 1.8 grade 8
Lesson 1.8   grade 8Lesson 1.8   grade 8
Lesson 1.8 grade 8
 
Chapter 7
Chapter 7Chapter 7
Chapter 7
 
Lesson 7.4
Lesson 7.4Lesson 7.4
Lesson 7.4
 
Lesson 7.3 (8)
Lesson 7.3 (8)Lesson 7.3 (8)
Lesson 7.3 (8)
 
Lesson 7.2
Lesson 7.2Lesson 7.2
Lesson 7.2
 
Pat05 ppt 0201
Pat05 ppt 0201Pat05 ppt 0201
Pat05 ppt 0201
 
Chapter 6
Chapter 6Chapter 6
Chapter 6
 
Pat05 ppt 0106
Pat05 ppt 0106Pat05 ppt 0106
Pat05 ppt 0106
 
Pat05 ppt 0105
Pat05 ppt 0105Pat05 ppt 0105
Pat05 ppt 0105
 
Chapter 1 Review
Chapter 1 ReviewChapter 1 Review
Chapter 1 Review
 
Lesson 1.10 grade 8
Lesson 1.10   grade 8Lesson 1.10   grade 8
Lesson 1.10 grade 8
 
Lesson 1.9 grade 8
Lesson 1.9   grade 8Lesson 1.9   grade 8
Lesson 1.9 grade 8
 
Lesson 1.7 grade 8
Lesson 1.7   grade 8Lesson 1.7   grade 8
Lesson 1.7 grade 8
 
Lesson 1.7 grade 8
Lesson 1.7   grade 8Lesson 1.7   grade 8
Lesson 1.7 grade 8
 

Recently uploaded

Operation Blue Star - Saka Neela Tara
Operation Blue Star   -  Saka Neela TaraOperation Blue Star   -  Saka Neela Tara
Operation Blue Star - Saka Neela Tara
Balvir Singh
 
A Survey of Techniques for Maximizing LLM Performance.pptx
A Survey of Techniques for Maximizing LLM Performance.pptxA Survey of Techniques for Maximizing LLM Performance.pptx
A Survey of Techniques for Maximizing LLM Performance.pptx
thanhdowork
 
A Strategic Approach: GenAI in Education
A Strategic Approach: GenAI in EducationA Strategic Approach: GenAI in Education
A Strategic Approach: GenAI in Education
Peter Windle
 
"Protectable subject matters, Protection in biotechnology, Protection of othe...
"Protectable subject matters, Protection in biotechnology, Protection of othe..."Protectable subject matters, Protection in biotechnology, Protection of othe...
"Protectable subject matters, Protection in biotechnology, Protection of othe...
SACHIN R KONDAGURI
 
Digital Artifact 2 - Investigating Pavilion Designs
Digital Artifact 2 - Investigating Pavilion DesignsDigital Artifact 2 - Investigating Pavilion Designs
Digital Artifact 2 - Investigating Pavilion Designs
chanes7
 
Francesca Gottschalk - How can education support child empowerment.pptx
Francesca Gottschalk - How can education support child empowerment.pptxFrancesca Gottschalk - How can education support child empowerment.pptx
Francesca Gottschalk - How can education support child empowerment.pptx
EduSkills OECD
 
Group Presentation 2 Economics.Ariana Buscigliopptx
Group Presentation 2 Economics.Ariana BuscigliopptxGroup Presentation 2 Economics.Ariana Buscigliopptx
Group Presentation 2 Economics.Ariana Buscigliopptx
ArianaBusciglio
 
Unit 2- Research Aptitude (UGC NET Paper I).pdf
Unit 2- Research Aptitude (UGC NET Paper I).pdfUnit 2- Research Aptitude (UGC NET Paper I).pdf
Unit 2- Research Aptitude (UGC NET Paper I).pdf
Thiyagu K
 
Marketing internship report file for MBA
Marketing internship report file for MBAMarketing internship report file for MBA
Marketing internship report file for MBA
gb193092
 
Chapter -12, Antibiotics (One Page Notes).pdf
Chapter -12, Antibiotics (One Page Notes).pdfChapter -12, Antibiotics (One Page Notes).pdf
Chapter -12, Antibiotics (One Page Notes).pdf
Kartik Tiwari
 
Home assignment II on Spectroscopy 2024 Answers.pdf
Home assignment II on Spectroscopy 2024 Answers.pdfHome assignment II on Spectroscopy 2024 Answers.pdf
Home assignment II on Spectroscopy 2024 Answers.pdf
Tamralipta Mahavidyalaya
 
Acetabularia Information For Class 9 .docx
Acetabularia Information For Class 9  .docxAcetabularia Information For Class 9  .docx
Acetabularia Information For Class 9 .docx
vaibhavrinwa19
 
Honest Reviews of Tim Han LMA Course Program.pptx
Honest Reviews of Tim Han LMA Course Program.pptxHonest Reviews of Tim Han LMA Course Program.pptx
Honest Reviews of Tim Han LMA Course Program.pptx
timhan337
 
Best Digital Marketing Institute In NOIDA
Best Digital Marketing Institute In NOIDABest Digital Marketing Institute In NOIDA
Best Digital Marketing Institute In NOIDA
deeptiverma2406
 
S1-Introduction-Biopesticides in ICM.pptx
S1-Introduction-Biopesticides in ICM.pptxS1-Introduction-Biopesticides in ICM.pptx
S1-Introduction-Biopesticides in ICM.pptx
tarandeep35
 
Synthetic Fiber Construction in lab .pptx
Synthetic Fiber Construction in lab .pptxSynthetic Fiber Construction in lab .pptx
Synthetic Fiber Construction in lab .pptx
Pavel ( NSTU)
 
The basics of sentences session 5pptx.pptx
The basics of sentences session 5pptx.pptxThe basics of sentences session 5pptx.pptx
The basics of sentences session 5pptx.pptx
heathfieldcps1
 
How to Make a Field invisible in Odoo 17
How to Make a Field invisible in Odoo 17How to Make a Field invisible in Odoo 17
How to Make a Field invisible in Odoo 17
Celine George
 
Introduction to AI for Nonprofits with Tapp Network
Introduction to AI for Nonprofits with Tapp NetworkIntroduction to AI for Nonprofits with Tapp Network
Introduction to AI for Nonprofits with Tapp Network
TechSoup
 
Digital Tools and AI for Teaching Learning and Research
Digital Tools and AI for Teaching Learning and ResearchDigital Tools and AI for Teaching Learning and Research
Digital Tools and AI for Teaching Learning and Research
Vikramjit Singh
 

Recently uploaded (20)

Operation Blue Star - Saka Neela Tara
Operation Blue Star   -  Saka Neela TaraOperation Blue Star   -  Saka Neela Tara
Operation Blue Star - Saka Neela Tara
 
A Survey of Techniques for Maximizing LLM Performance.pptx
A Survey of Techniques for Maximizing LLM Performance.pptxA Survey of Techniques for Maximizing LLM Performance.pptx
A Survey of Techniques for Maximizing LLM Performance.pptx
 
A Strategic Approach: GenAI in Education
A Strategic Approach: GenAI in EducationA Strategic Approach: GenAI in Education
A Strategic Approach: GenAI in Education
 
"Protectable subject matters, Protection in biotechnology, Protection of othe...
"Protectable subject matters, Protection in biotechnology, Protection of othe..."Protectable subject matters, Protection in biotechnology, Protection of othe...
"Protectable subject matters, Protection in biotechnology, Protection of othe...
 
Digital Artifact 2 - Investigating Pavilion Designs
Digital Artifact 2 - Investigating Pavilion DesignsDigital Artifact 2 - Investigating Pavilion Designs
Digital Artifact 2 - Investigating Pavilion Designs
 
Francesca Gottschalk - How can education support child empowerment.pptx
Francesca Gottschalk - How can education support child empowerment.pptxFrancesca Gottschalk - How can education support child empowerment.pptx
Francesca Gottschalk - How can education support child empowerment.pptx
 
Group Presentation 2 Economics.Ariana Buscigliopptx
Group Presentation 2 Economics.Ariana BuscigliopptxGroup Presentation 2 Economics.Ariana Buscigliopptx
Group Presentation 2 Economics.Ariana Buscigliopptx
 
Unit 2- Research Aptitude (UGC NET Paper I).pdf
Unit 2- Research Aptitude (UGC NET Paper I).pdfUnit 2- Research Aptitude (UGC NET Paper I).pdf
Unit 2- Research Aptitude (UGC NET Paper I).pdf
 
Marketing internship report file for MBA
Marketing internship report file for MBAMarketing internship report file for MBA
Marketing internship report file for MBA
 
Chapter -12, Antibiotics (One Page Notes).pdf
Chapter -12, Antibiotics (One Page Notes).pdfChapter -12, Antibiotics (One Page Notes).pdf
Chapter -12, Antibiotics (One Page Notes).pdf
 
Home assignment II on Spectroscopy 2024 Answers.pdf
Home assignment II on Spectroscopy 2024 Answers.pdfHome assignment II on Spectroscopy 2024 Answers.pdf
Home assignment II on Spectroscopy 2024 Answers.pdf
 
Acetabularia Information For Class 9 .docx
Acetabularia Information For Class 9  .docxAcetabularia Information For Class 9  .docx
Acetabularia Information For Class 9 .docx
 
Honest Reviews of Tim Han LMA Course Program.pptx
Honest Reviews of Tim Han LMA Course Program.pptxHonest Reviews of Tim Han LMA Course Program.pptx
Honest Reviews of Tim Han LMA Course Program.pptx
 
Best Digital Marketing Institute In NOIDA
Best Digital Marketing Institute In NOIDABest Digital Marketing Institute In NOIDA
Best Digital Marketing Institute In NOIDA
 
S1-Introduction-Biopesticides in ICM.pptx
S1-Introduction-Biopesticides in ICM.pptxS1-Introduction-Biopesticides in ICM.pptx
S1-Introduction-Biopesticides in ICM.pptx
 
Synthetic Fiber Construction in lab .pptx
Synthetic Fiber Construction in lab .pptxSynthetic Fiber Construction in lab .pptx
Synthetic Fiber Construction in lab .pptx
 
The basics of sentences session 5pptx.pptx
The basics of sentences session 5pptx.pptxThe basics of sentences session 5pptx.pptx
The basics of sentences session 5pptx.pptx
 
How to Make a Field invisible in Odoo 17
How to Make a Field invisible in Odoo 17How to Make a Field invisible in Odoo 17
How to Make a Field invisible in Odoo 17
 
Introduction to AI for Nonprofits with Tapp Network
Introduction to AI for Nonprofits with Tapp NetworkIntroduction to AI for Nonprofits with Tapp Network
Introduction to AI for Nonprofits with Tapp Network
 
Digital Tools and AI for Teaching Learning and Research
Digital Tools and AI for Teaching Learning and ResearchDigital Tools and AI for Teaching Learning and Research
Digital Tools and AI for Teaching Learning and Research
 

(8) Lesson 9.5

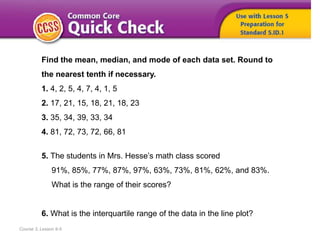
  • 1. Course 3, Lesson 9-5 Find the mean, median, and mode of each data set. Round to the nearest tenth if necessary. 1. 4, 2, 5, 4, 7, 4, 1, 5 2. 17, 21, 15, 18, 21, 18, 23 3. 35, 34, 39, 33, 34 4. 81, 72, 73, 72, 66, 81 5. The students in Mrs. Hesse’s math class scored 91%, 85%, 77%, 87%, 97%, 63%, 73%, 81%, 62%, and 83%. What is the range of their scores? 6. What is the interquartile range of the data in the line plot?
  • 2. Course 3, Lesson 9-5 ANSWERS 1. 4; 4; 4 2. 19; 18; 18 and 21 3. 35; 34; 34 4. 74.2; 72.5; 81 and 72 5. 35 6. 23
  • 3. HOW are patterns used when comparing two quantities? Statistics and Probability Course 3, Lesson 9-5
  • 4. Course 3, Lesson 9-5 Common Core State Standards © Copyright 2010. National Governors Association Center for Best Practices and Council of Chief State School Officers. All rights reserved. Statistics and Probability • Preparation for S.ID.2 Use statistics appropriate to the shape of the data distribution to compare center (median, mean) and spread (interquartile range, standard deviation) of two or more different data sets. Mathematical Practices 1 Make sense of problems and persevere in solving them. 3 Construct viable arguments and critique the reasoning of others. 4 Model with mathematics. 7 Look for and make use of structure.
  • 5. To • calculate the mean absolute deviation of a data set, • use the standard deviation of a data set Course 3, Lesson 9-5 Statistics and Probability
  • 6. • mean absolute deviation • standard deviation Course 3, Lesson 9-5 Statistics and Probability
  • 7. 1 Need Another Example? 2 3 4 Step-by-Step Example 1. The table shows the heights of the first eight people standing in line to ride a roller coaster. Find the mean absolute deviation of the set of data. Describe what the mean absolute deviation represents. Find the absolute value of the differences between each value in the data set and the mean. Find the mean. The mean absolute deviation is 3.75. This means that the average distance each person’s height is from the mean height is 3.75 inches. Find the average of the absolute values of the differences between each value in the data set and the mean. = 56 |52 – 56| = 4 |59 – 56| = 3 |48 – 56| = 8 |54 – 56| = 2 |60 – 56| = 4 |58 – 56| = 2 |55 – 56| = 1 |62 – 56| = 6
  • 8. Answer Need Another Example? The table shows the admission prices at different movie theaters. Find the mean absolute deviation of the set of data. Describe what the mean absolute deviation represents. 0.50; Sample answer: The average distance each value is from the mean is $0.50.
  • 9. 1 Need Another Example? 2 3 Step-by-Step Example 2. The standard deviation of quiz scores for Class A is about 1.2. Describe the quiz scores that are within one standard deviation of the mean. Find the range of values that are within one standard deviation of the mean. Find the mean. Quiz scores that are between 7.05 and 9.45 points are within one standard deviation of the mean. mean = = 8.25 8.25 – 1.2 = 7.05 8.25 + 1.2 = 9.45 Subtract the standard deviation from the mean. Add the standard deviation to the mean.
  • 10. Answer Need Another Example? The standard deviation of posts on a Web site is about 30.7. Describe the posts that are within one standard deviation of the mean. The number of posts that are between 145 and 206.4 are within one standard deviation of the mean.
  • 11. How did what you learned today help you answer the How are patterns used when comparing two quantities? Course 3, Lesson 9-5 GeometryStatistics and Probability
  • 12. How did what you learned today help you answer the How are patterns used when comparing two quantities? Course 3, Lesson 9-5 GeometryStatistics and Probability Sample answers: • One pattern is the mean absolute deviation. The mean absolute deviation describes the average distance between each data value and the mean. • Another pattern is the standard deviation. Most of the data in a set fall within one standard deviation of the mean.
  • 13. Write a set of directions for finding the mean absolute deviation for a data set. Course 3, Lesson 9-5 Ratios and Proportional RelationshipsFunctionsStatistics and Probability