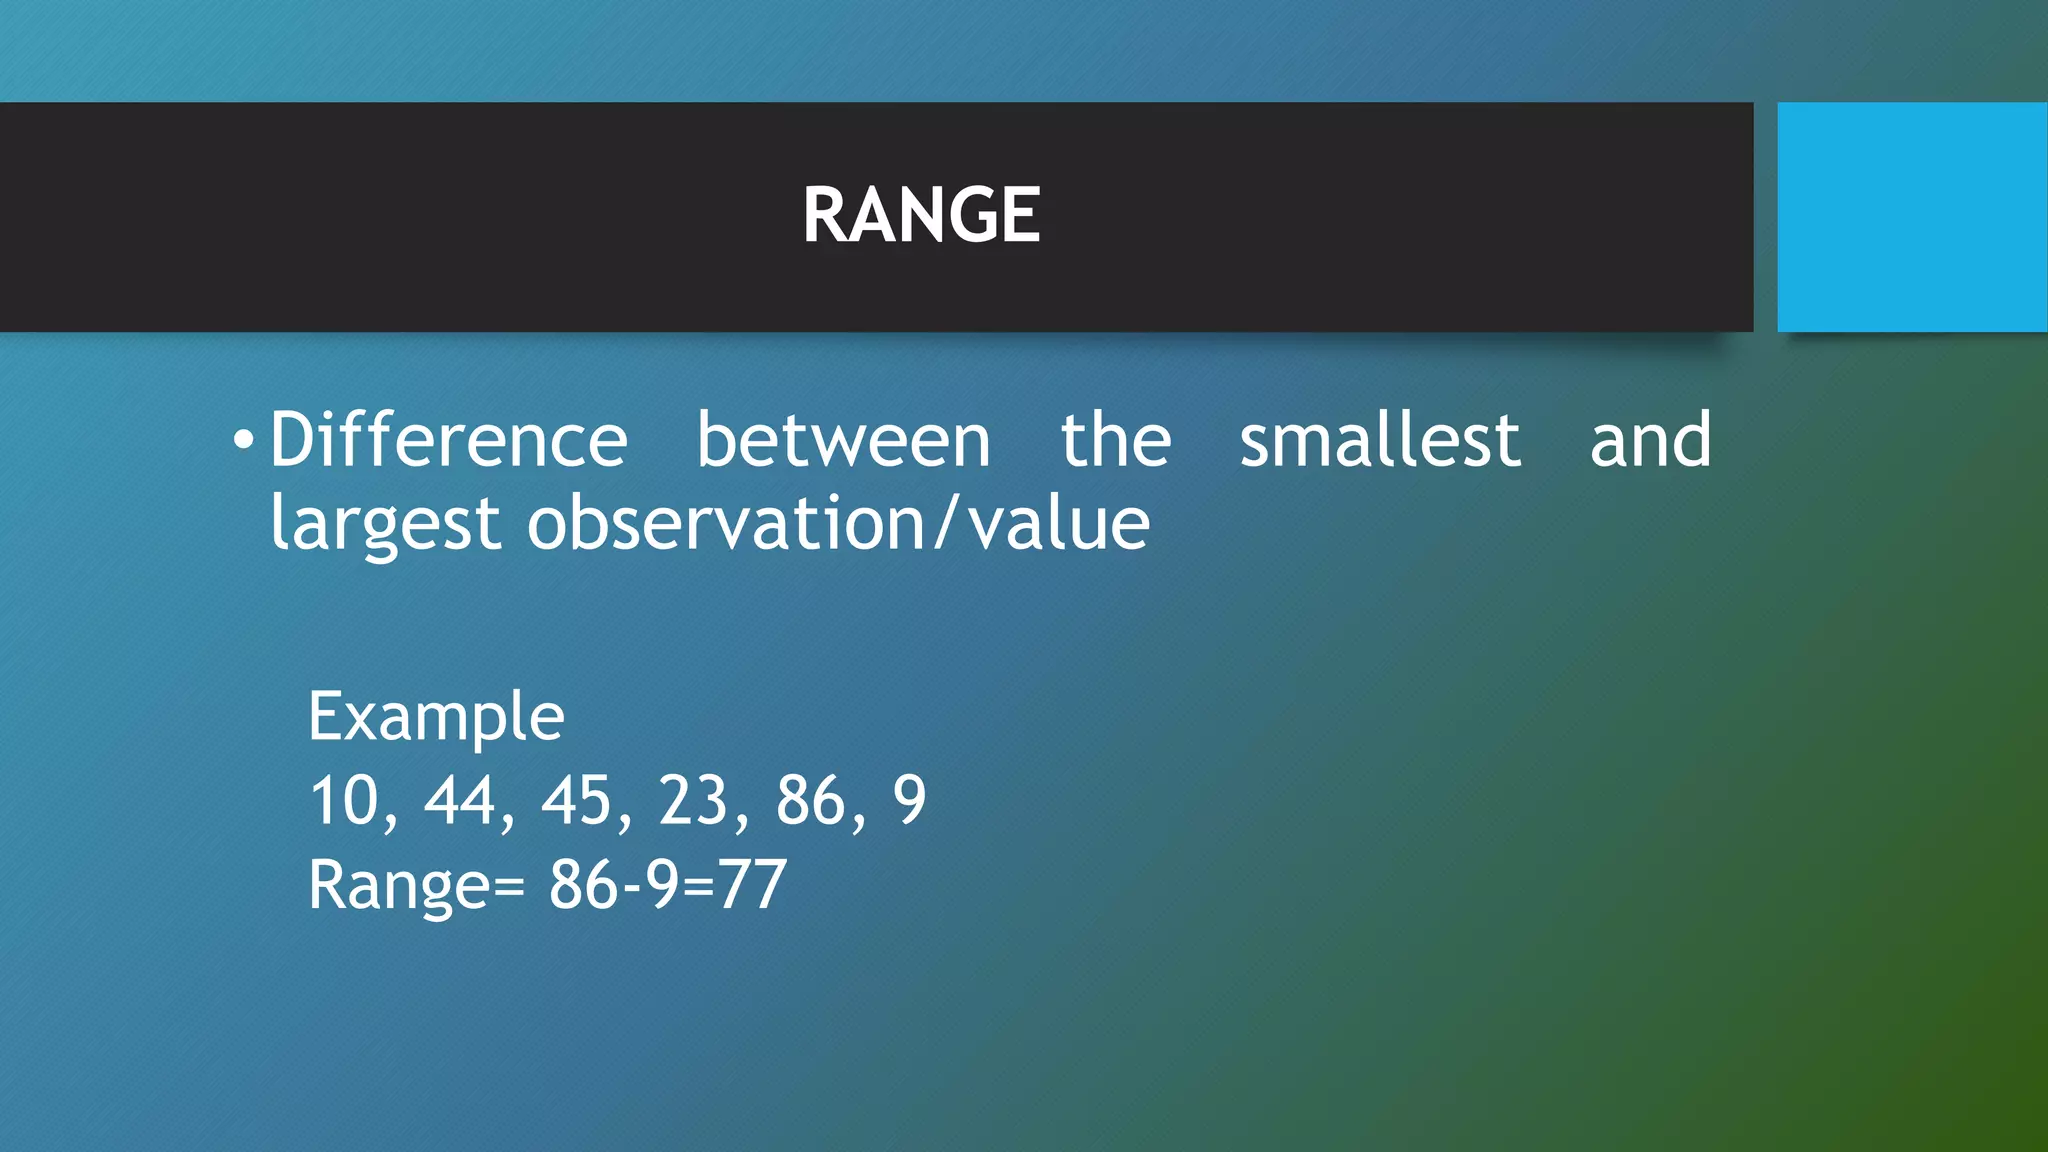
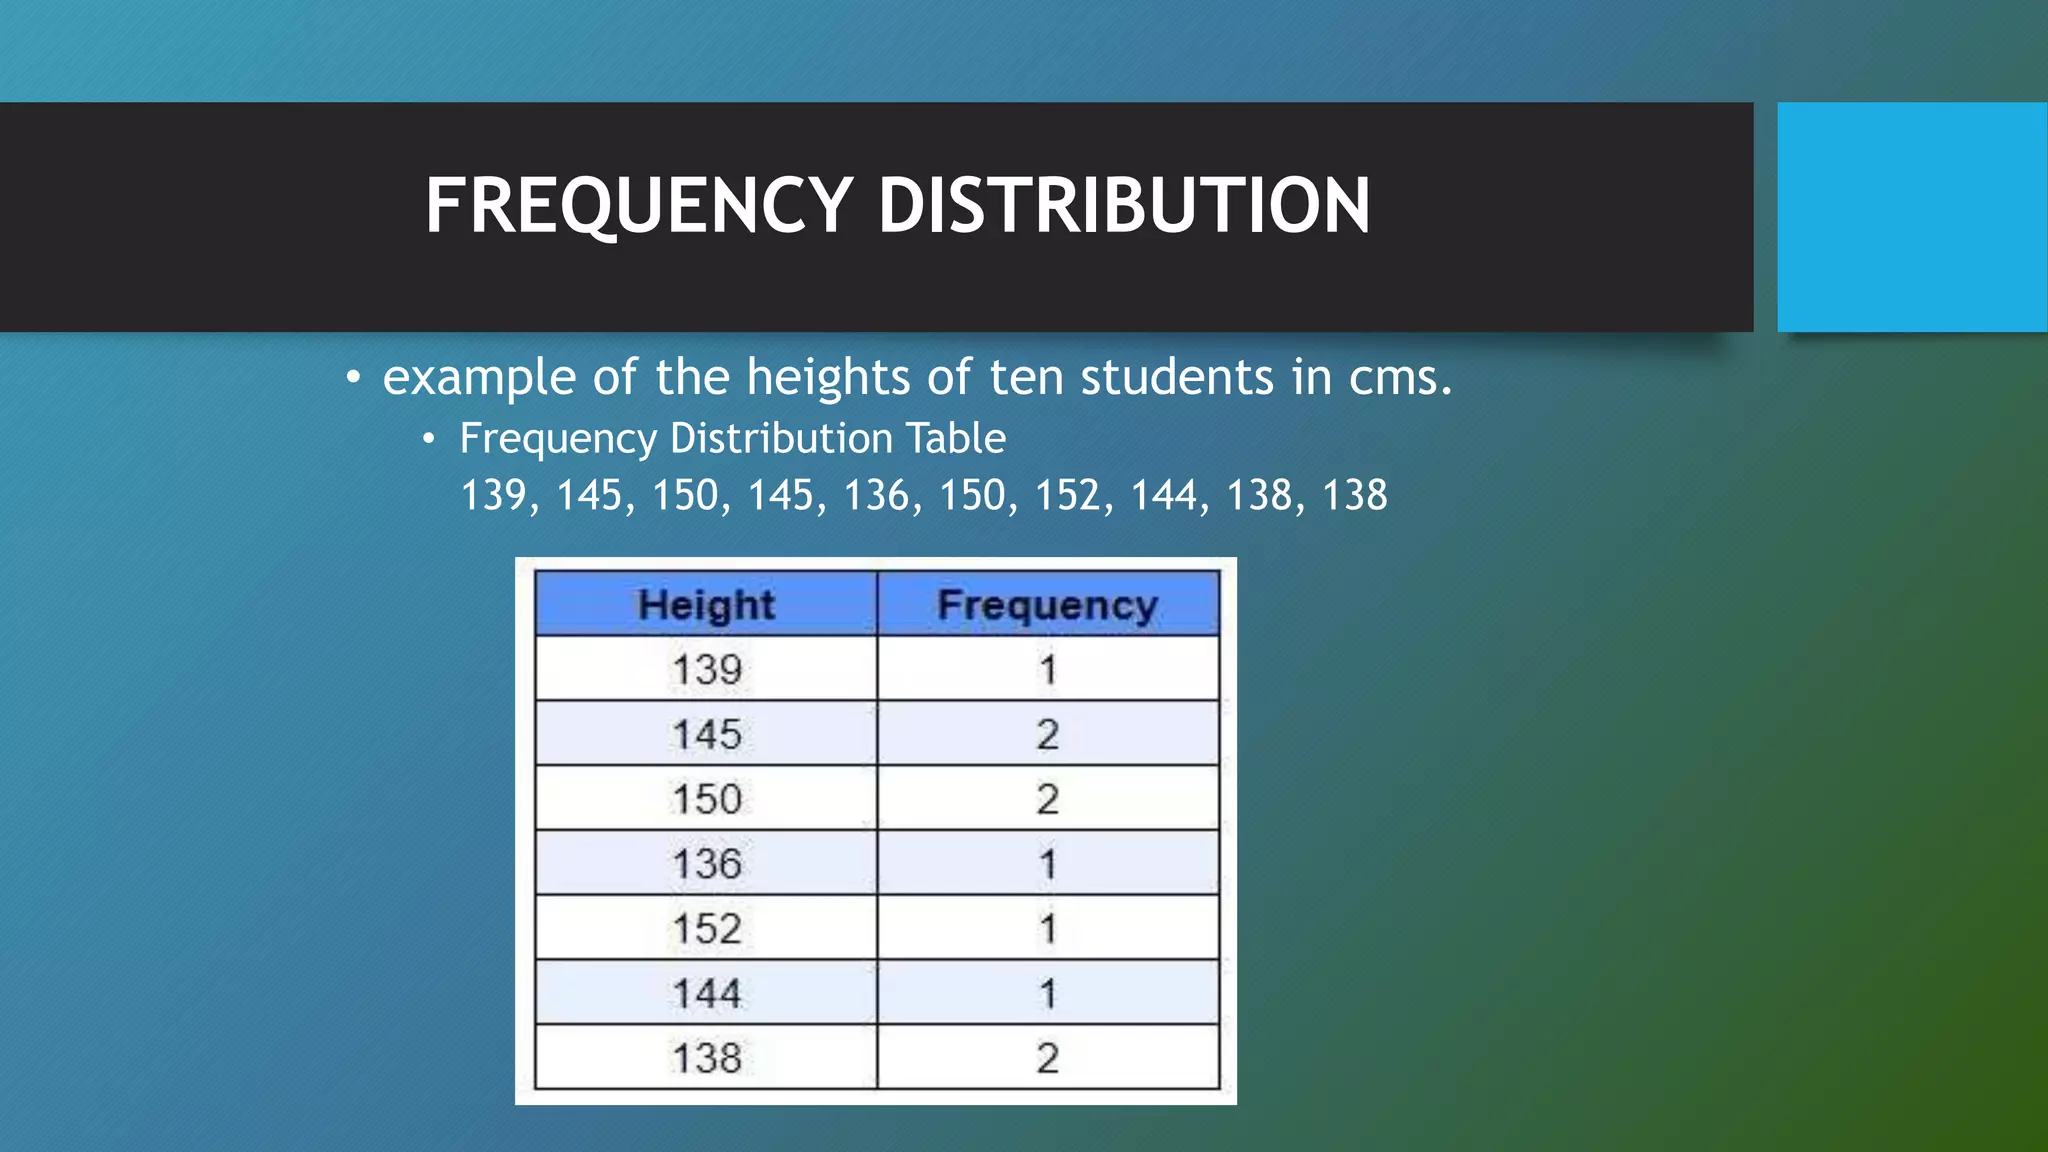
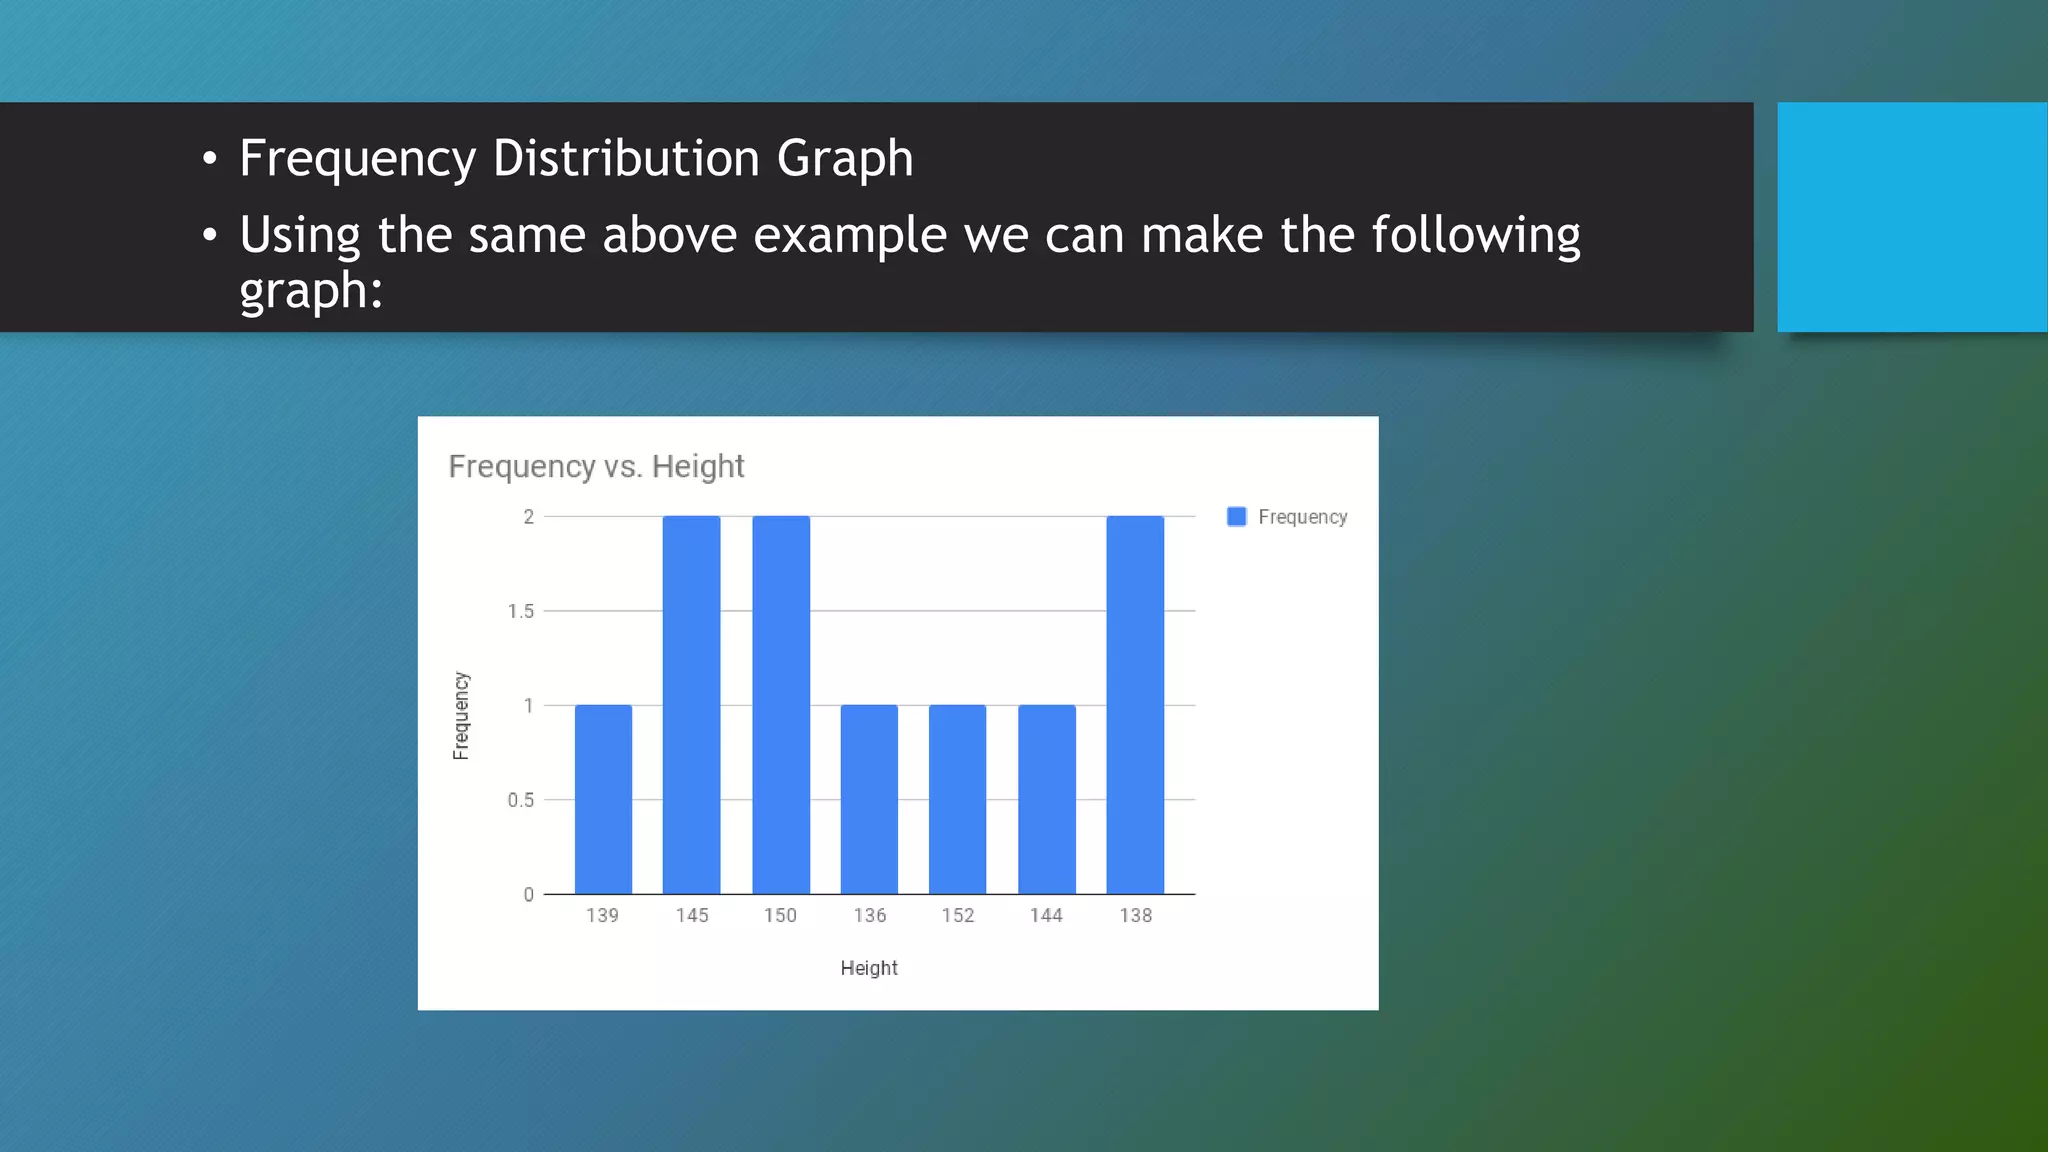
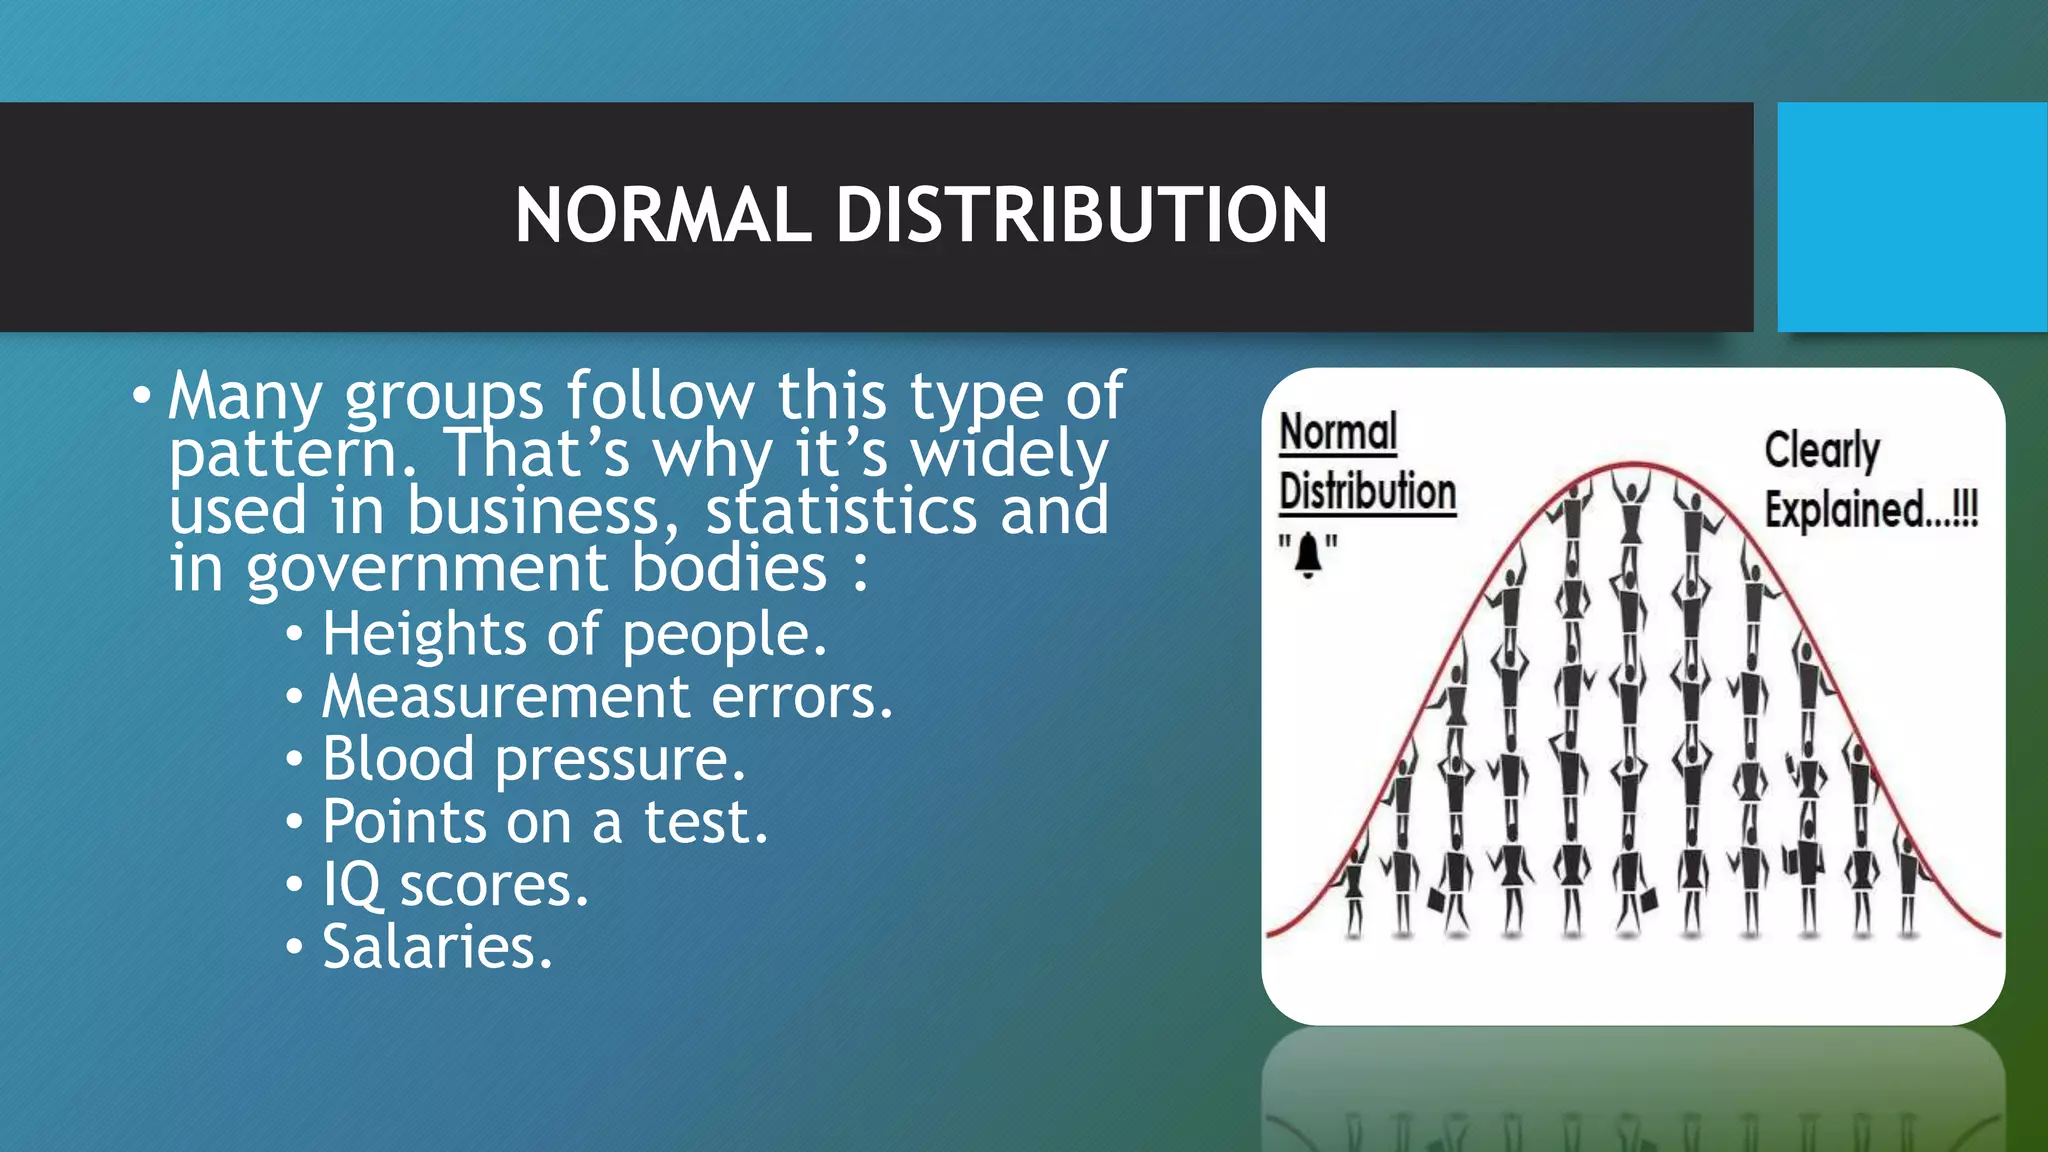
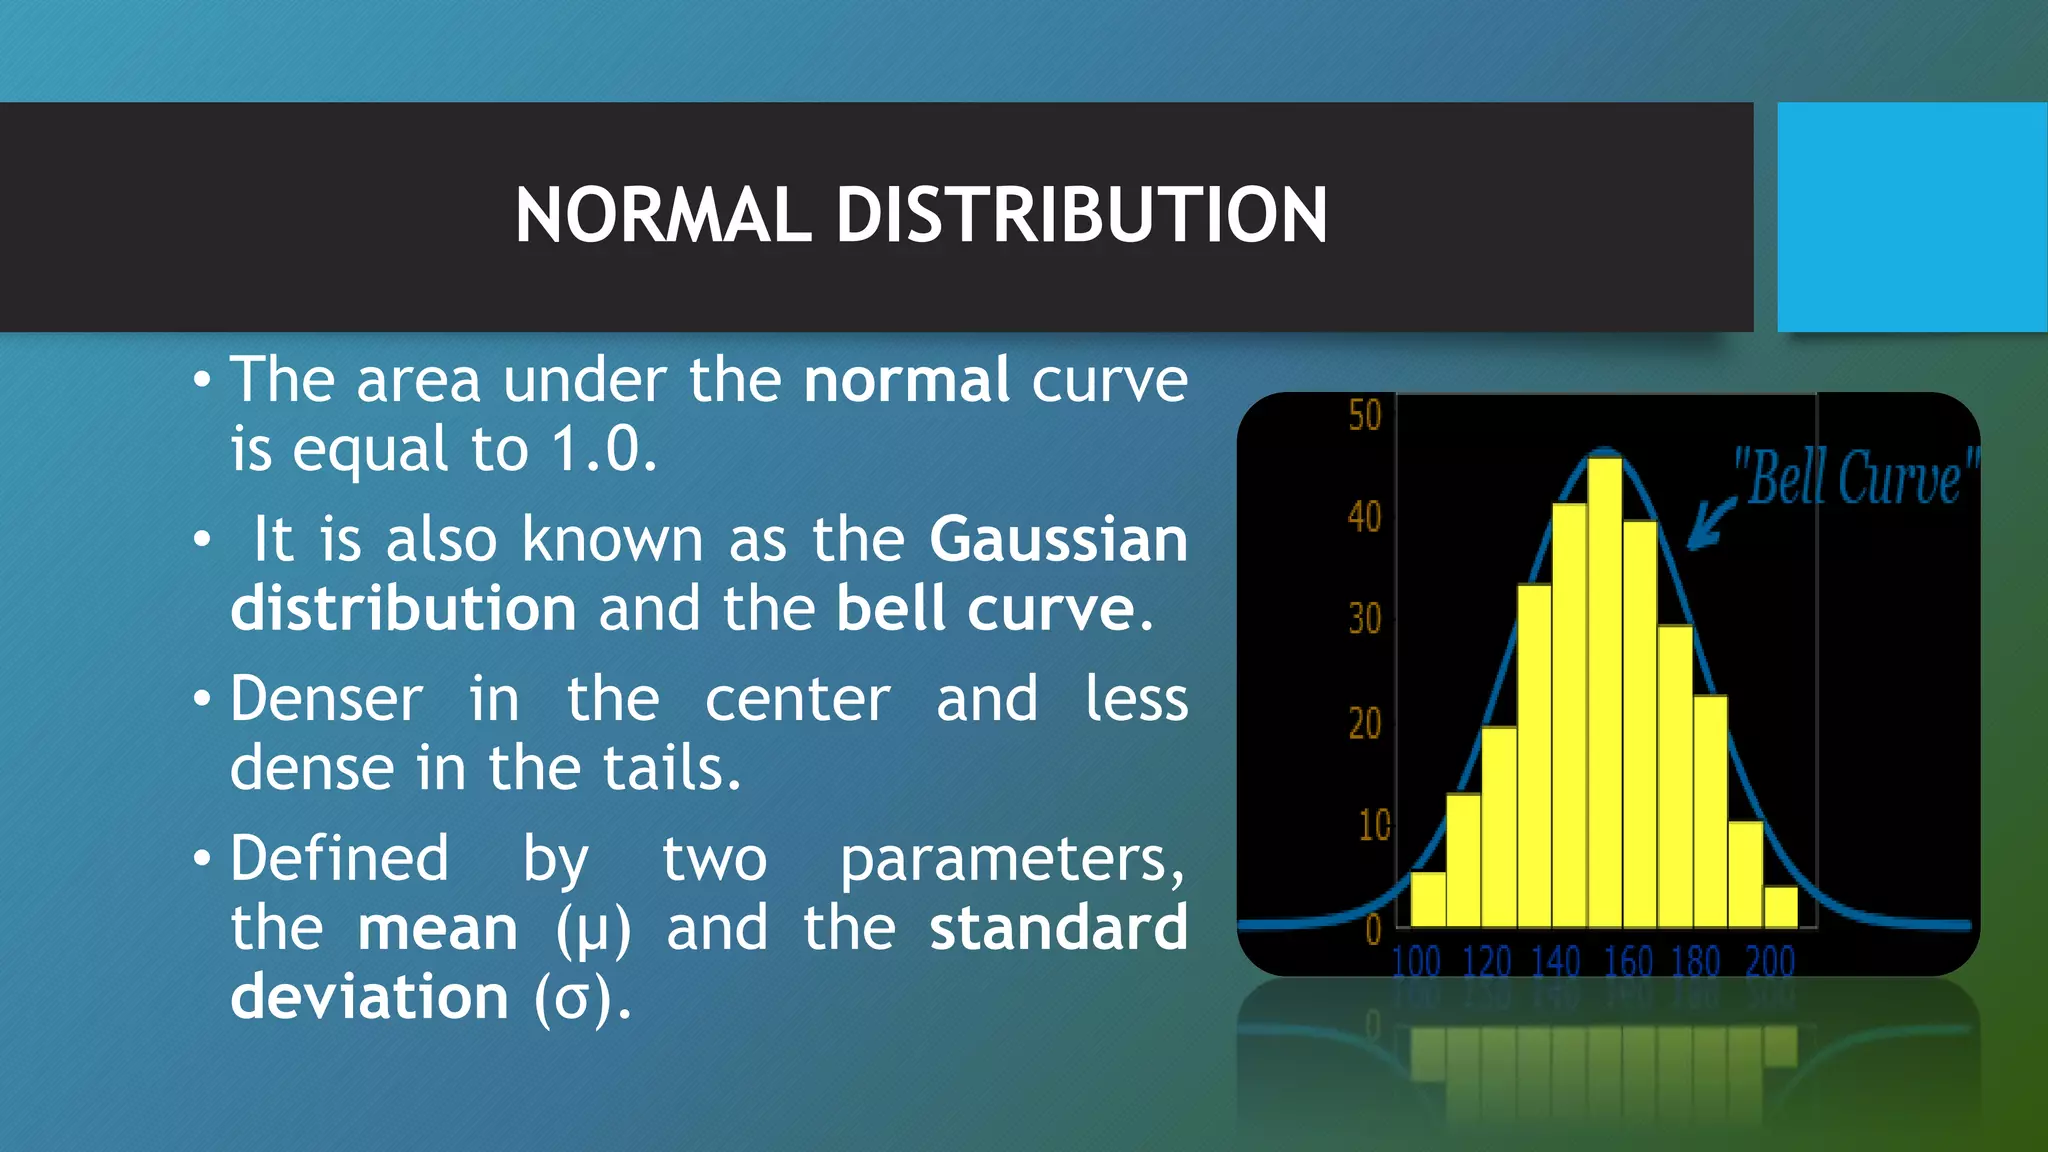
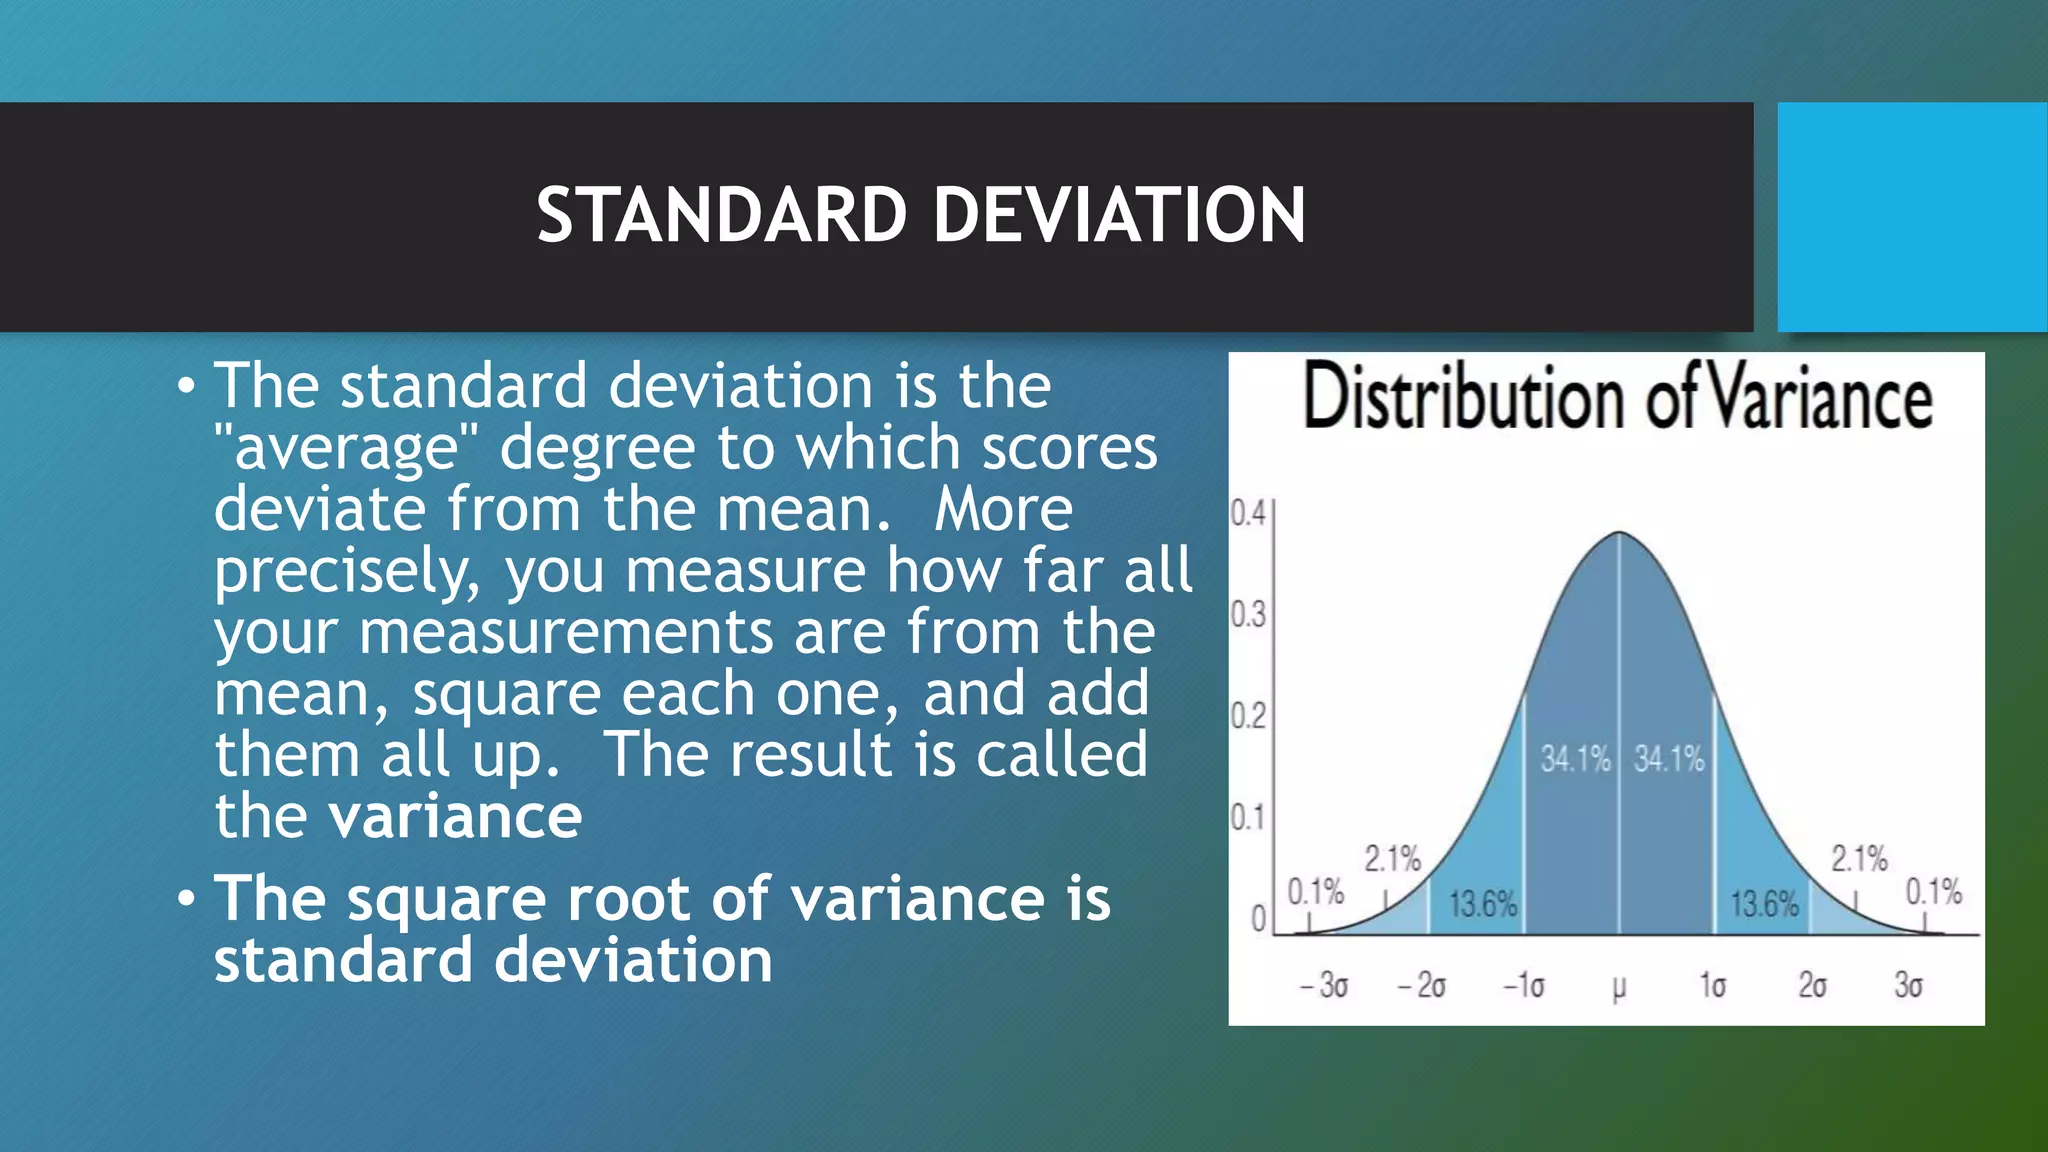
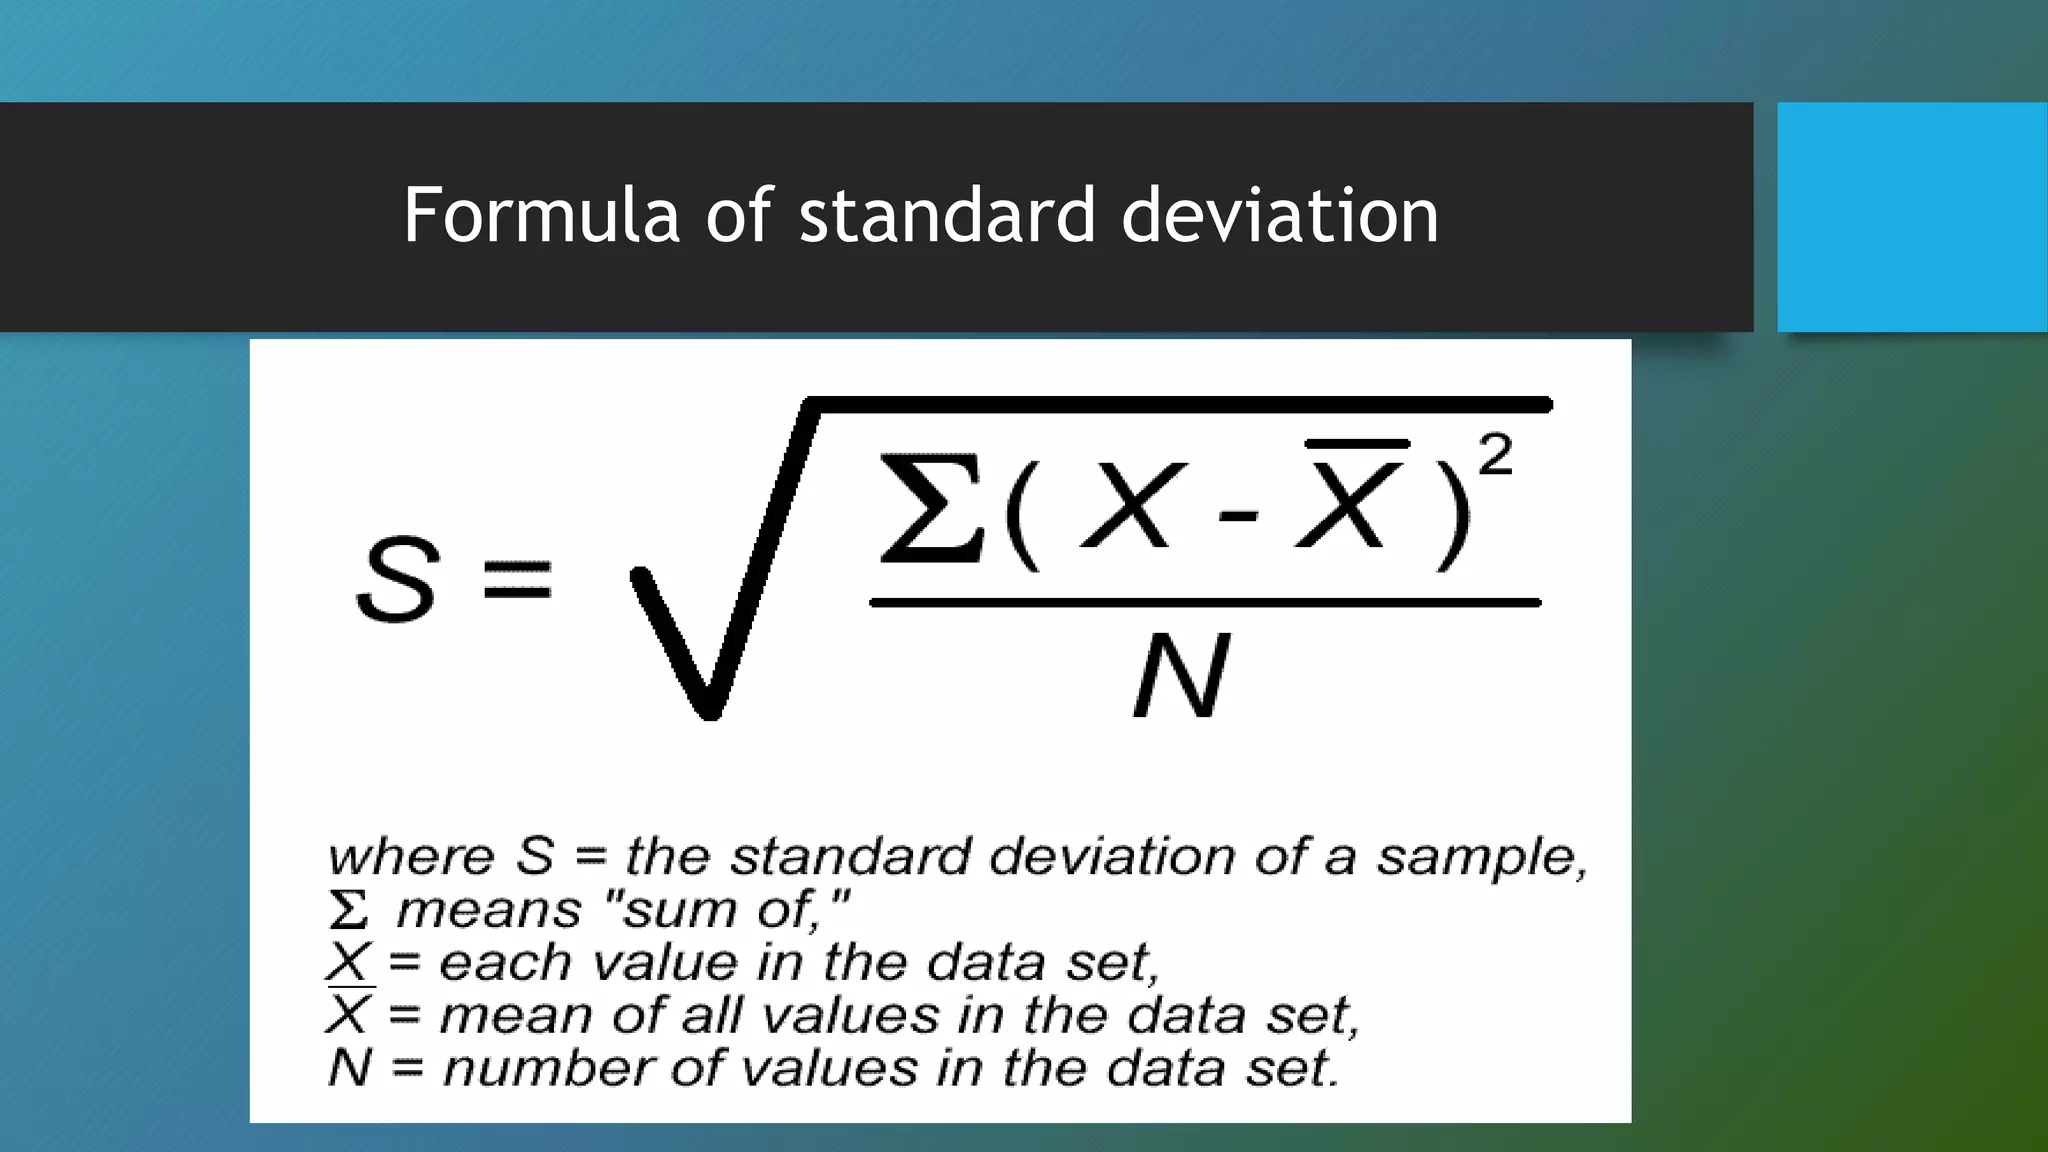
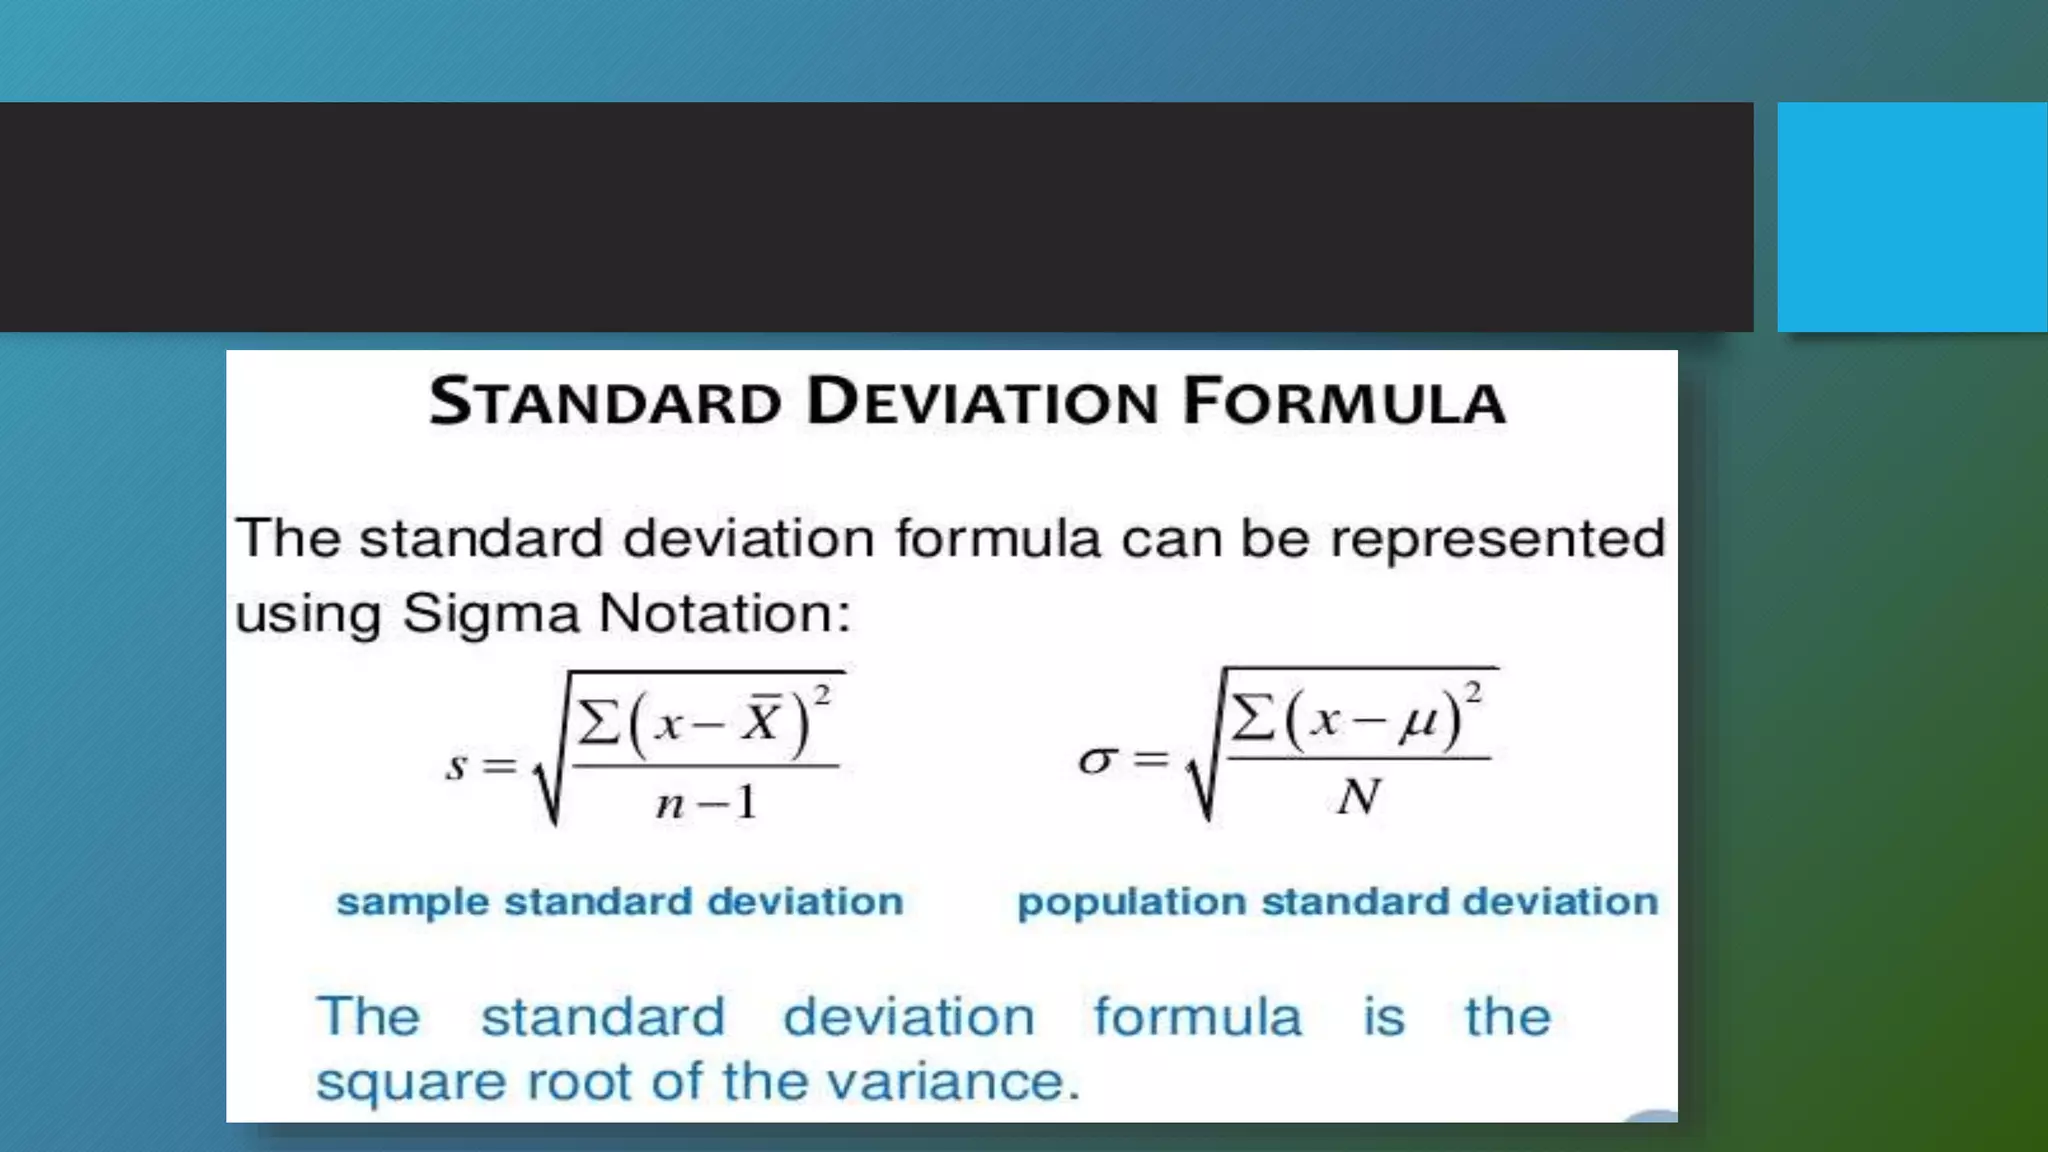
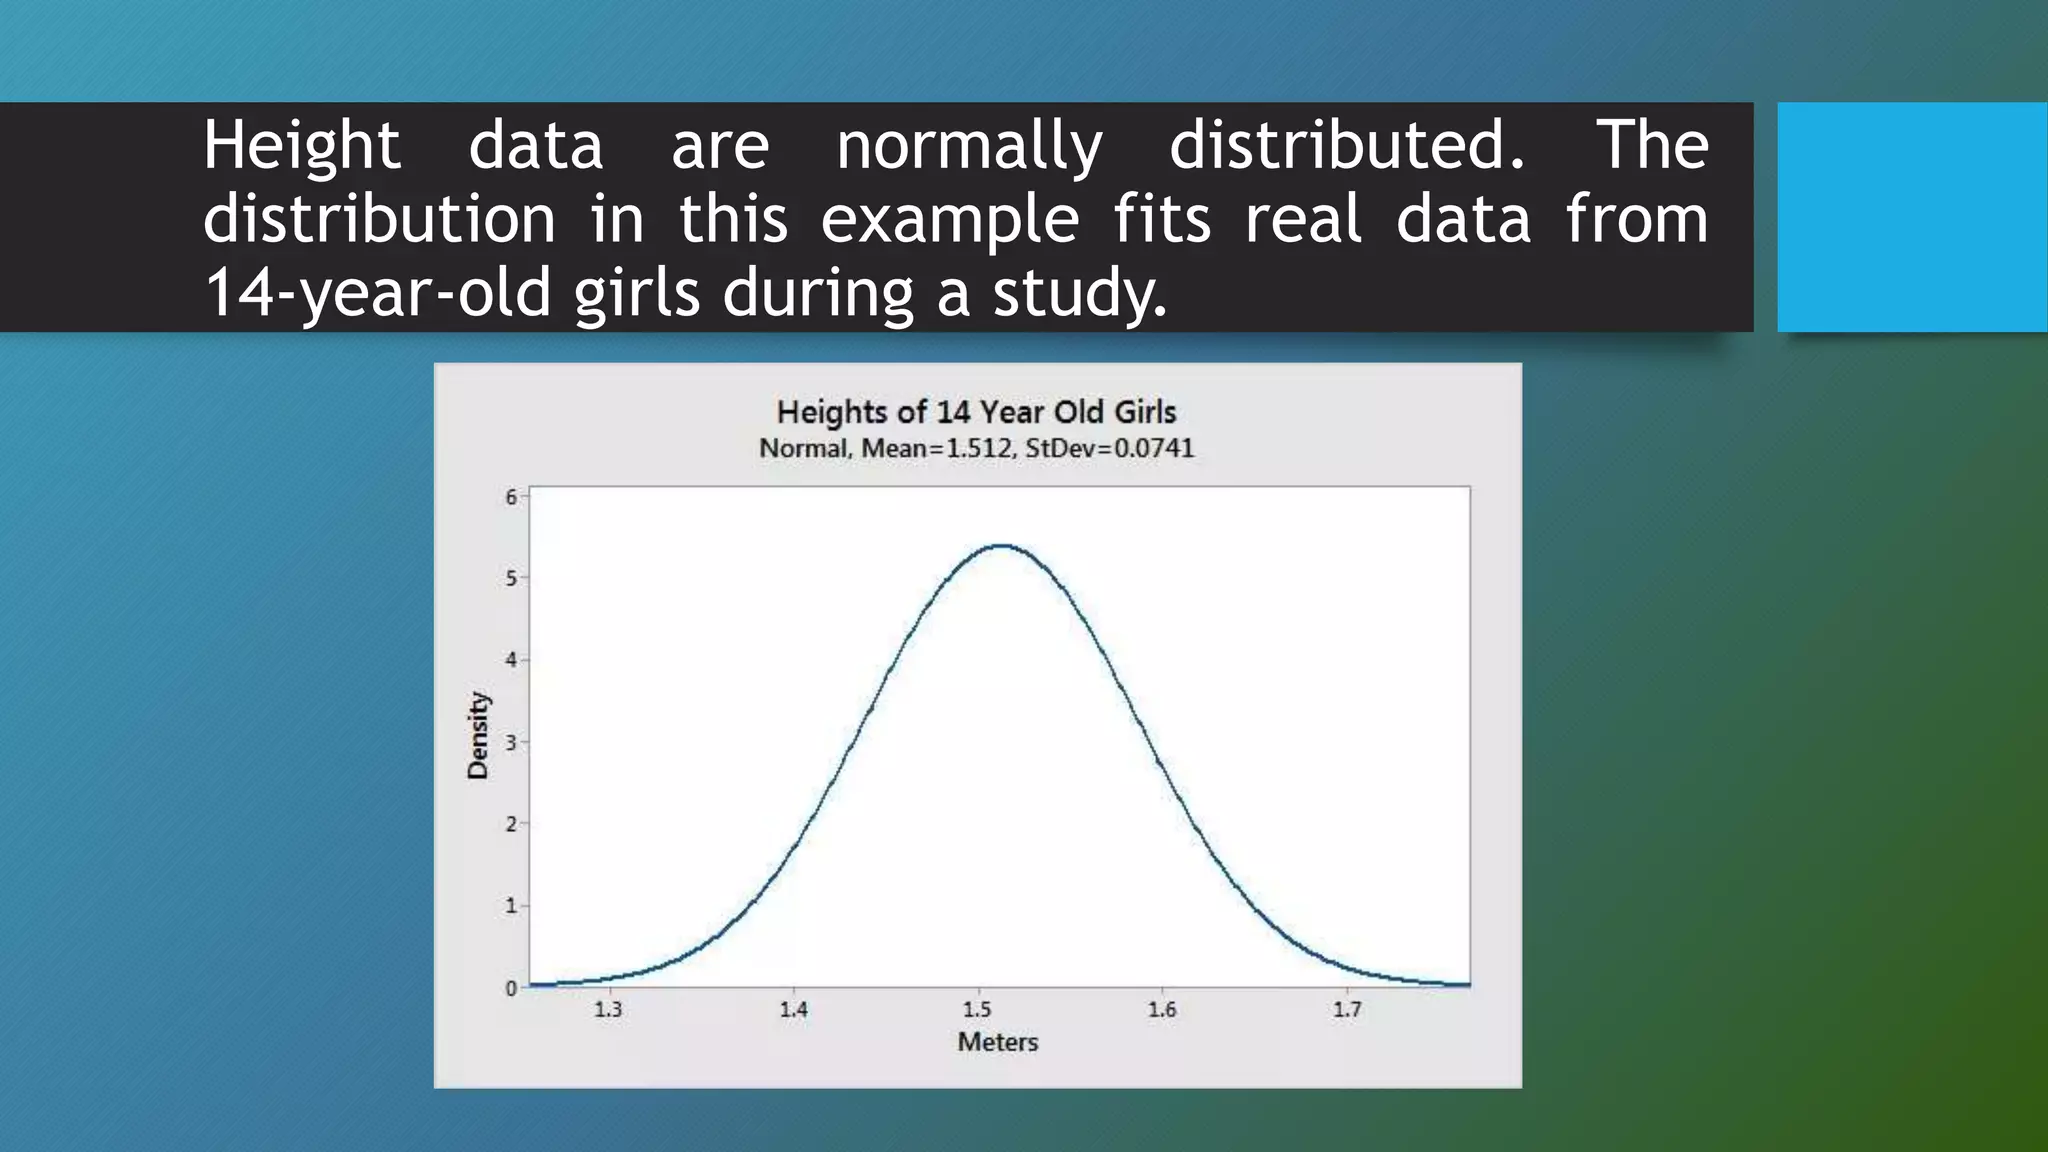
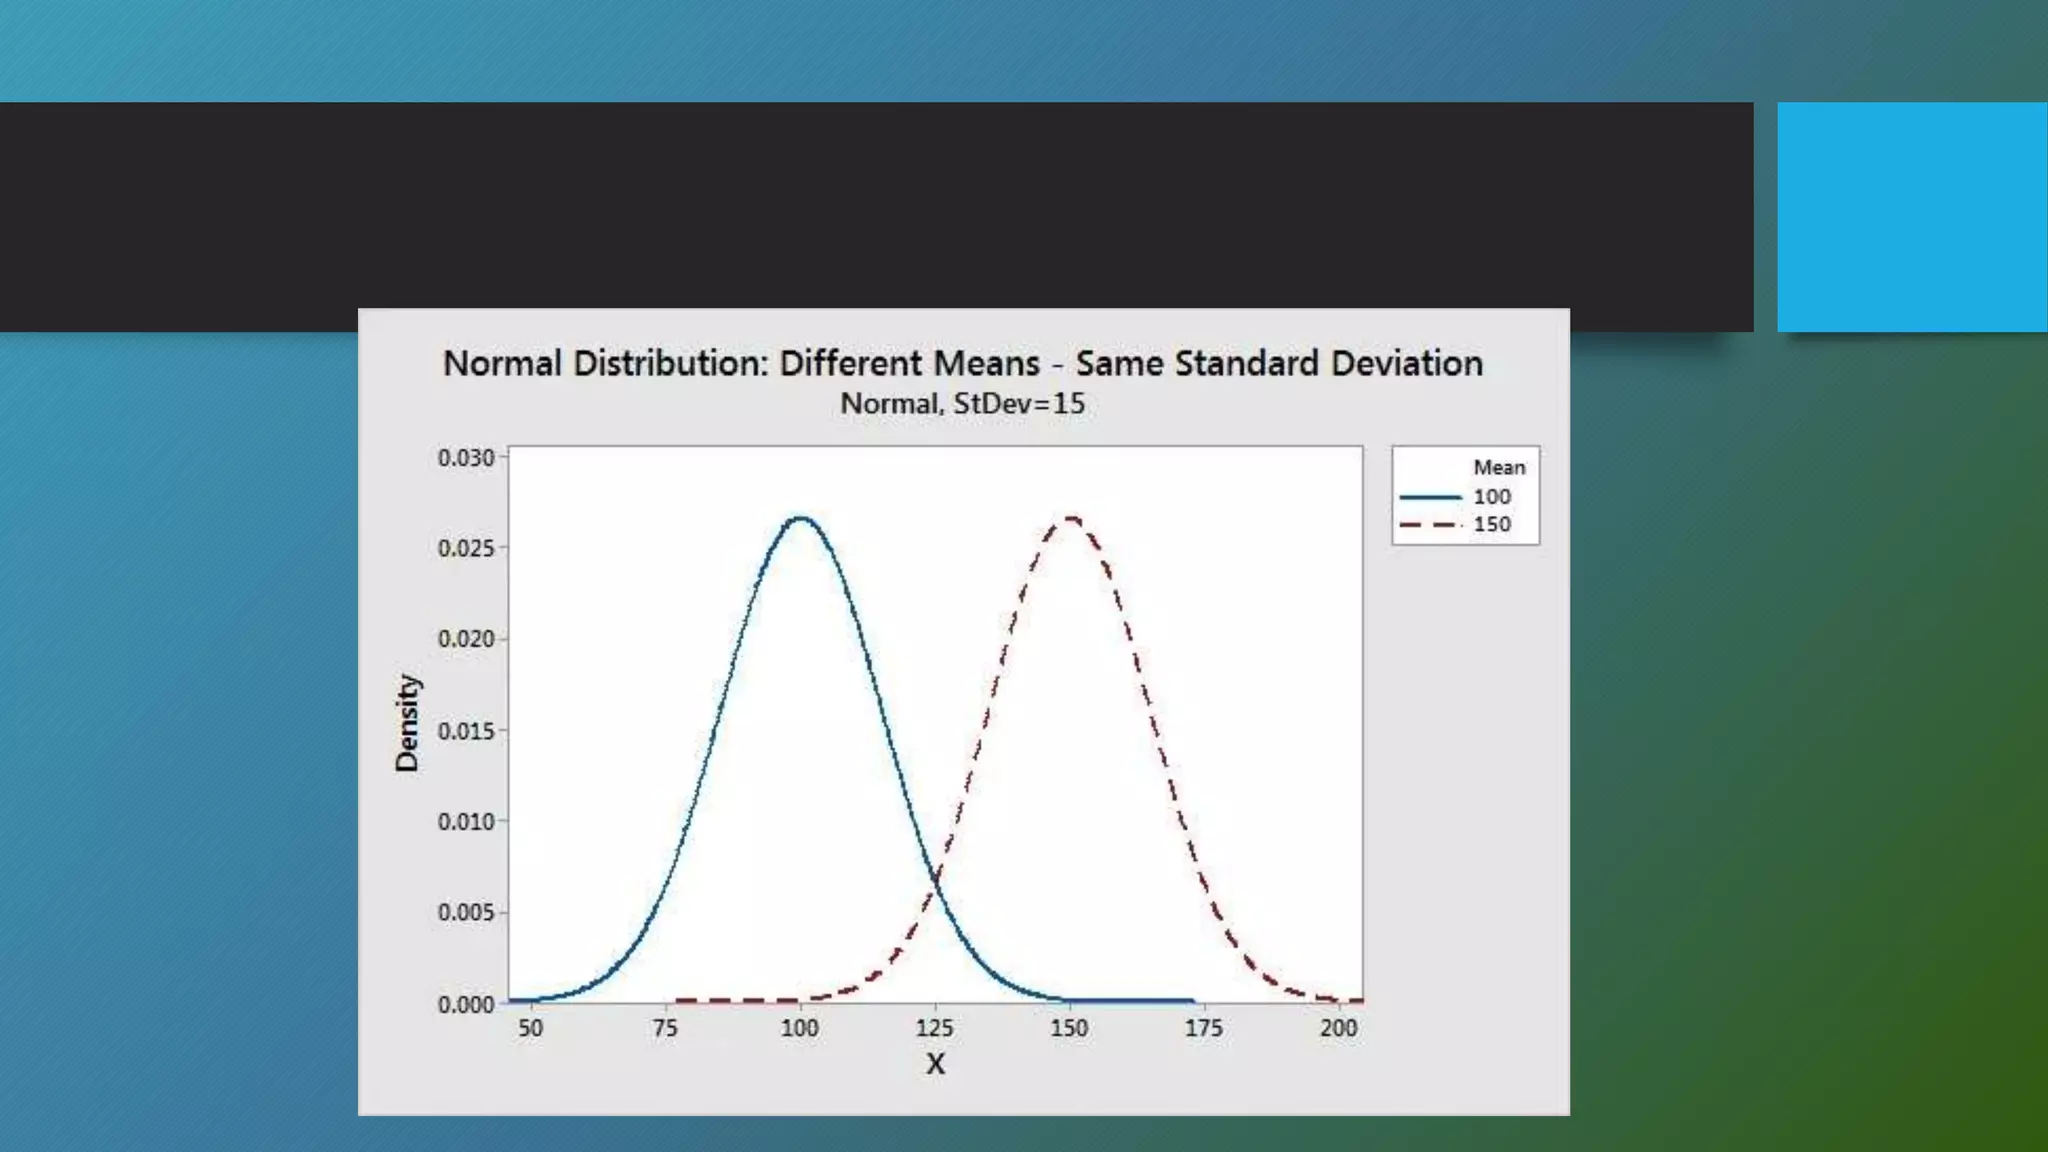
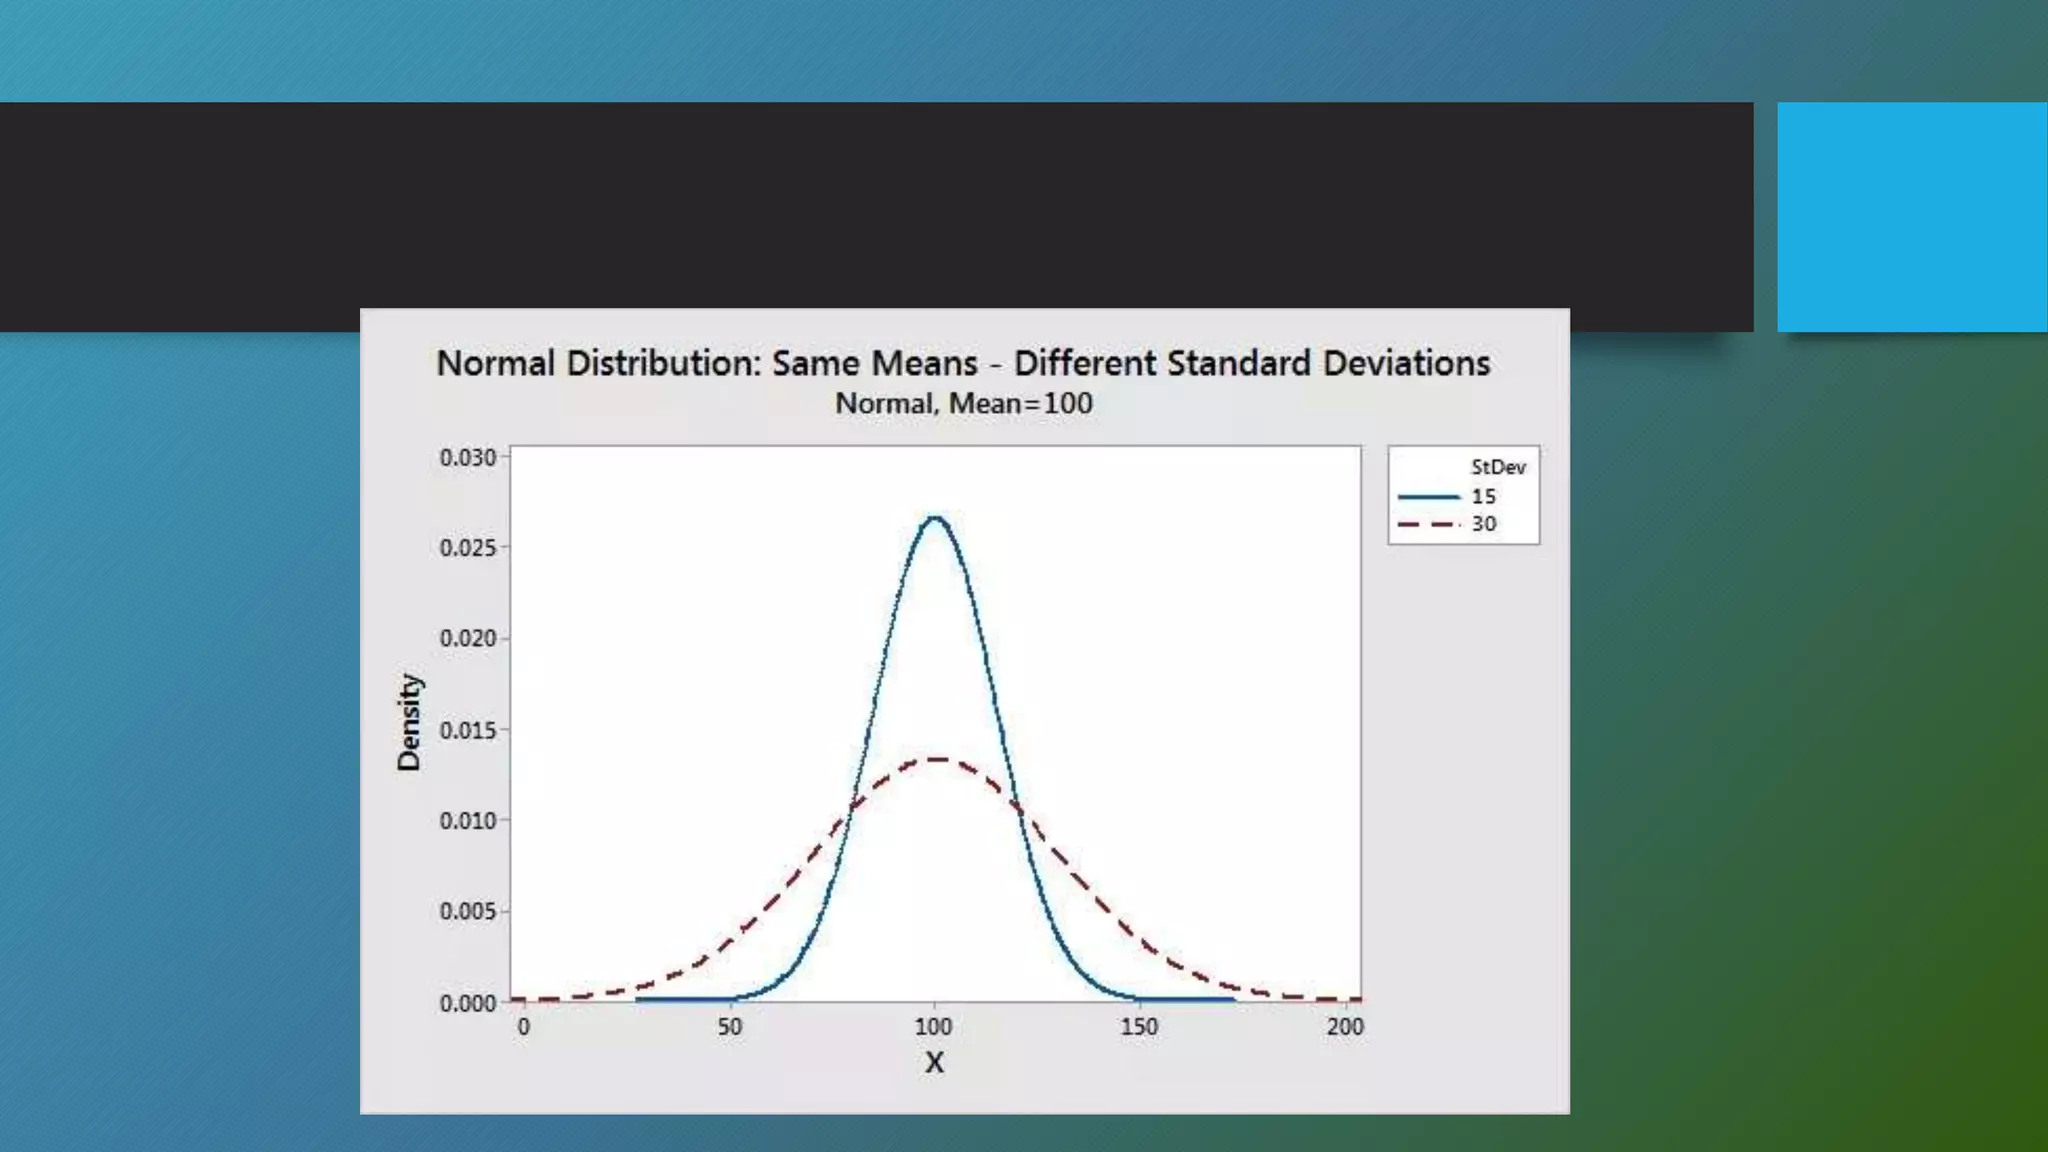
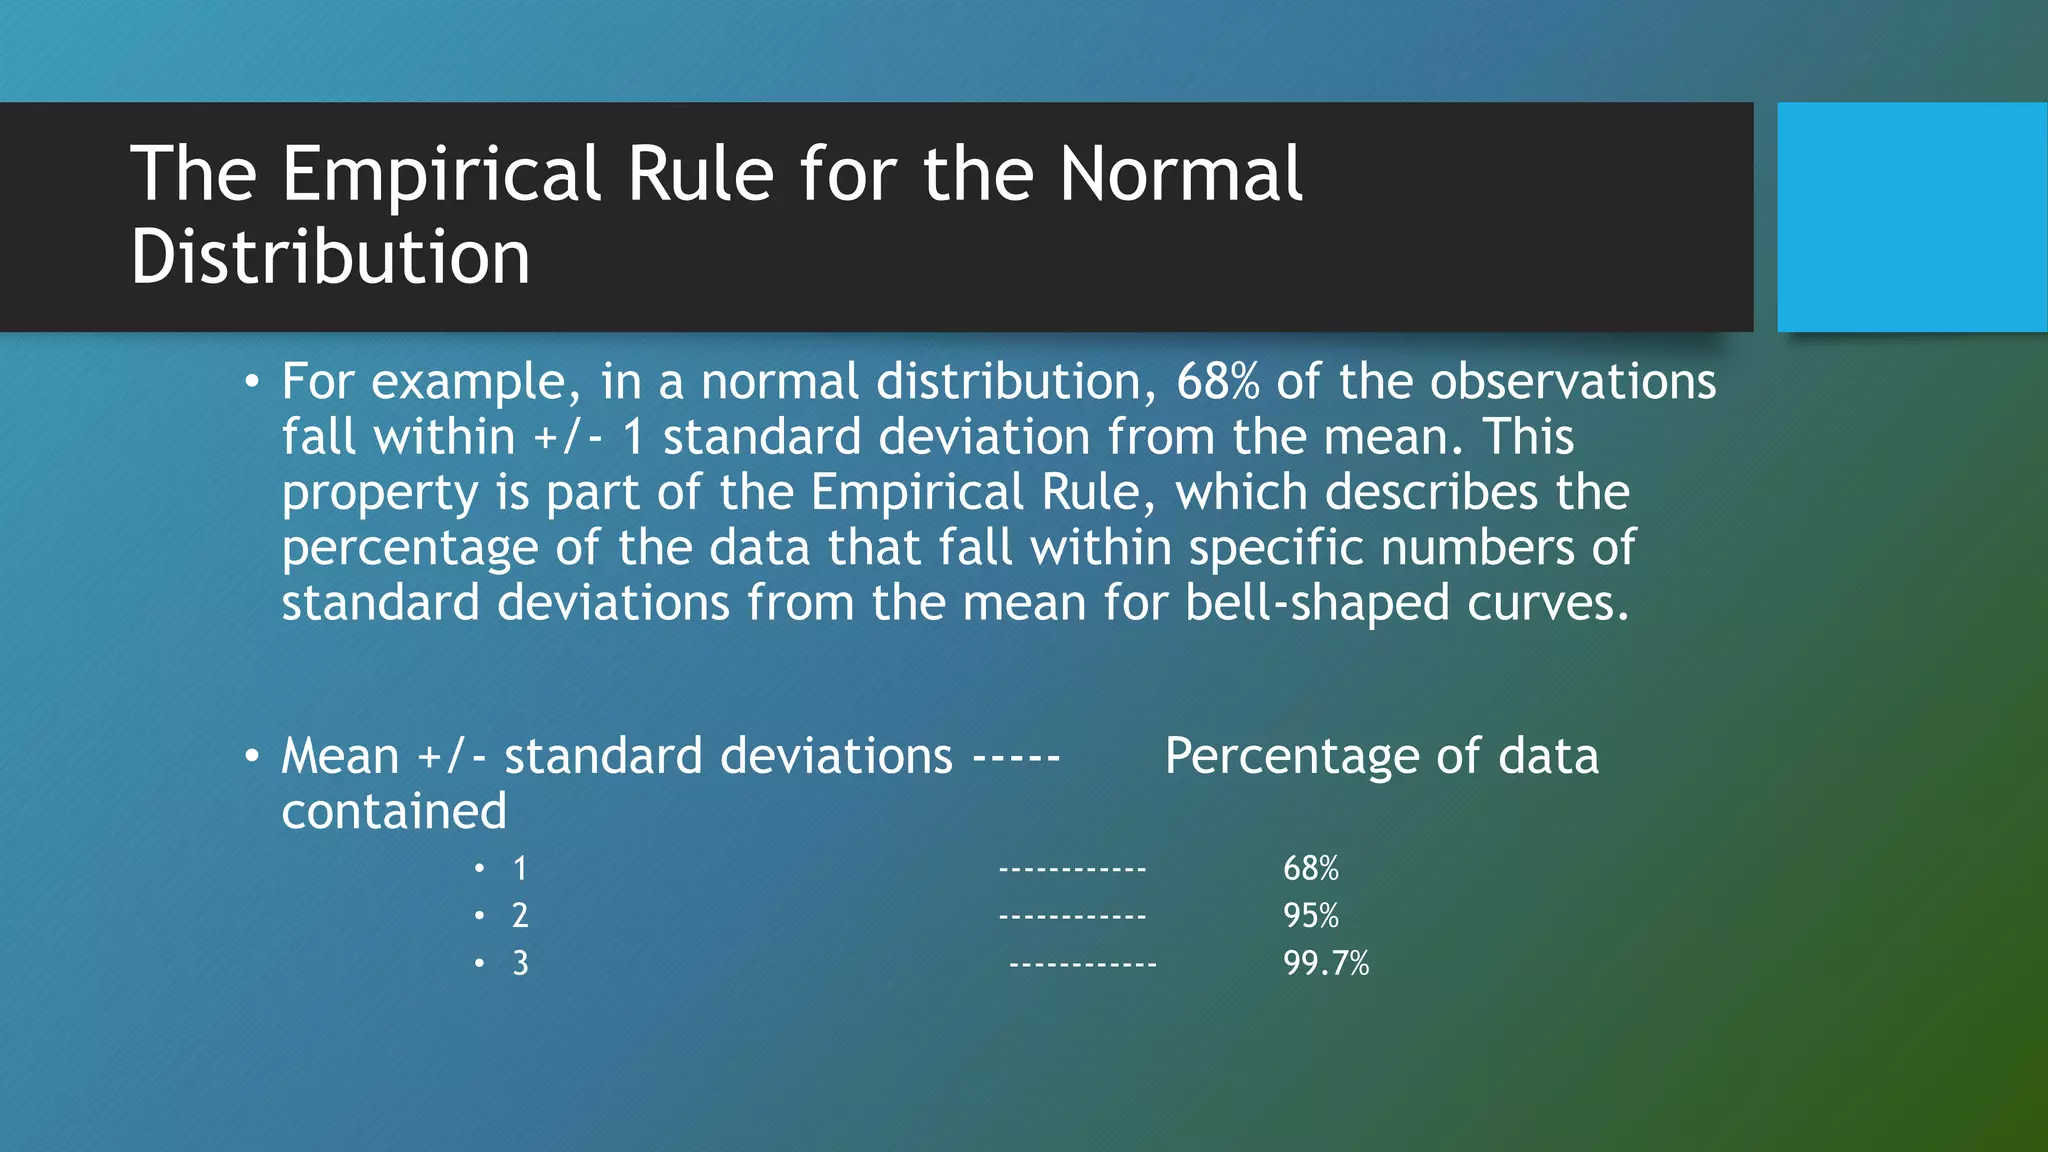
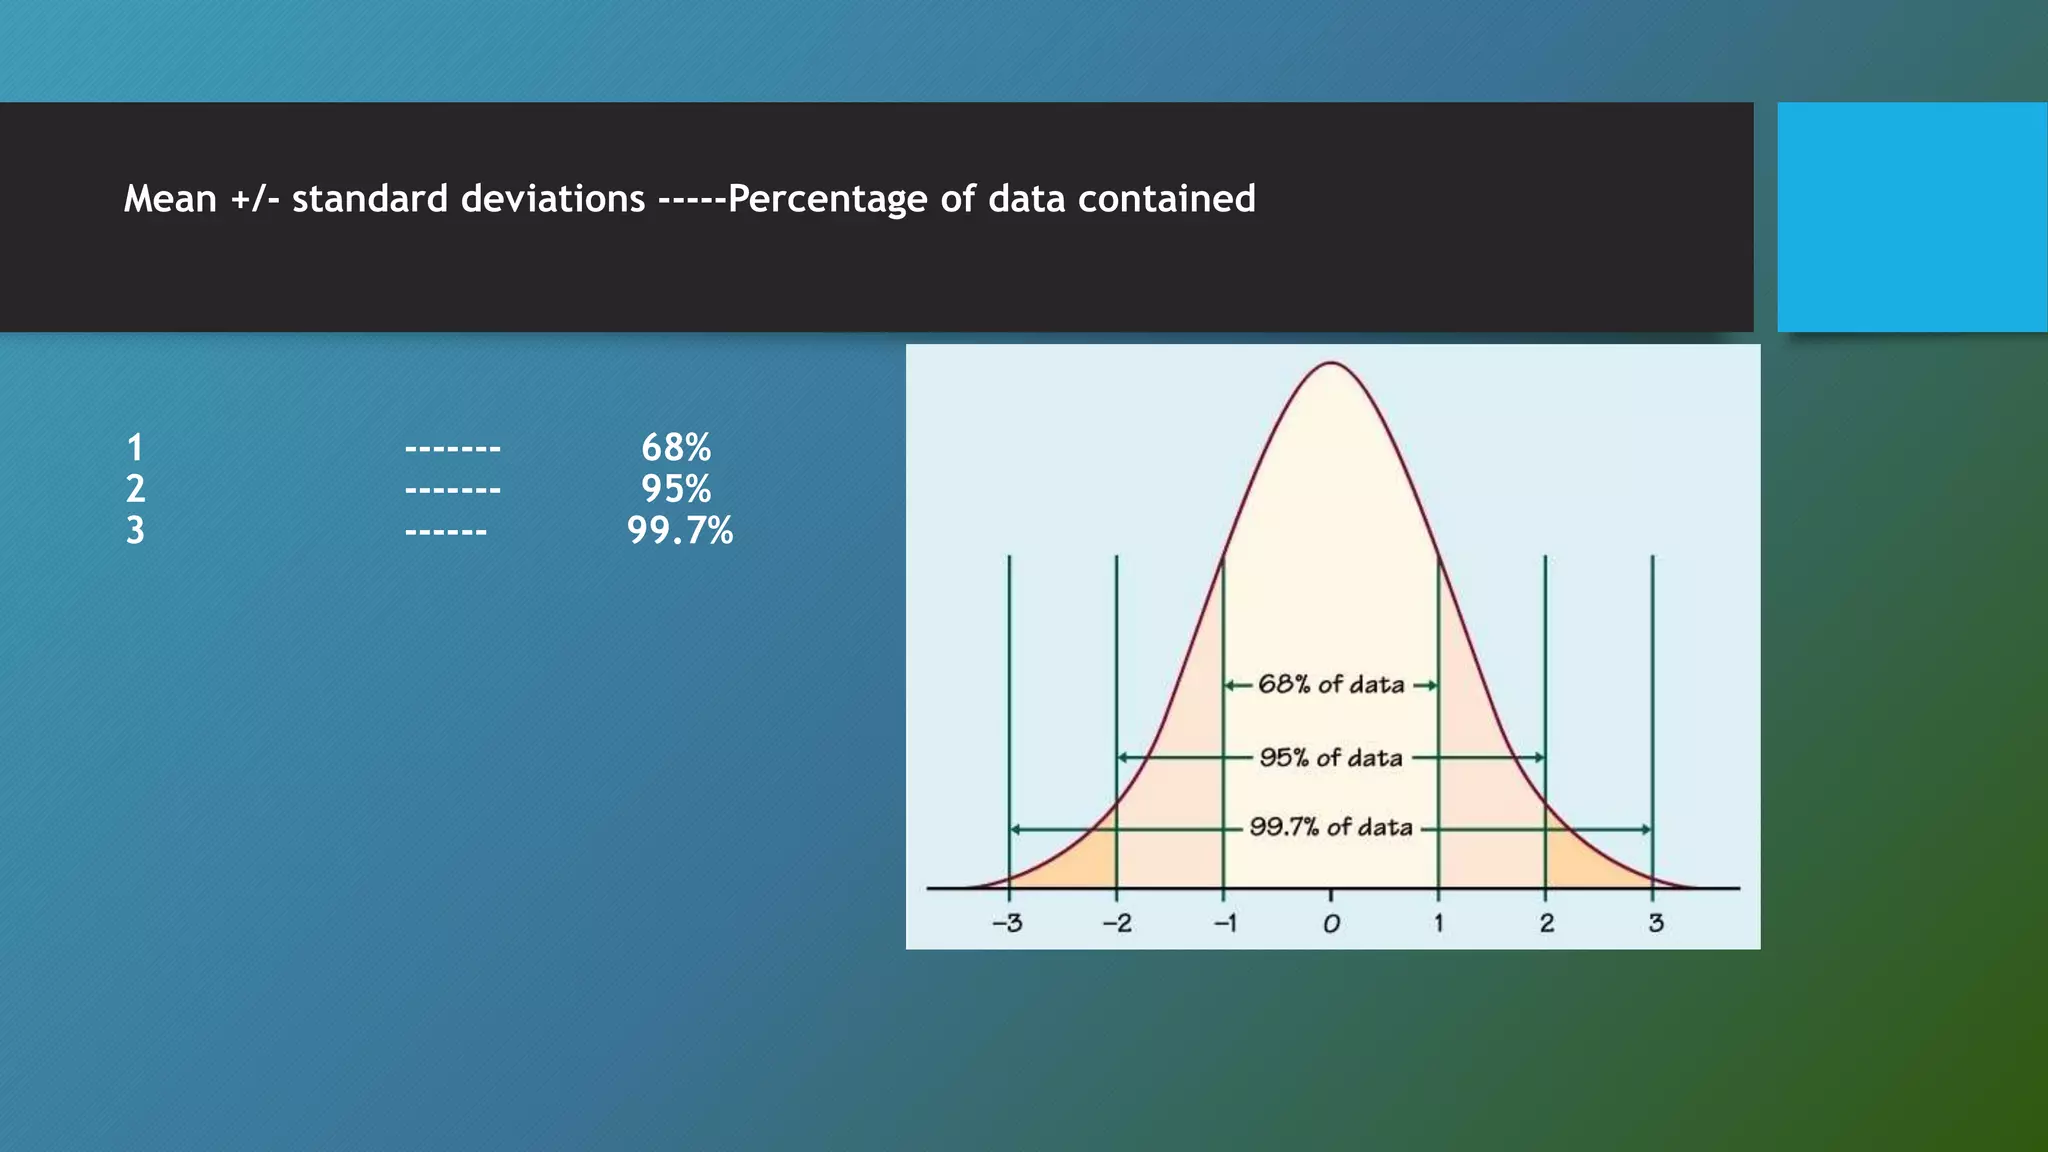
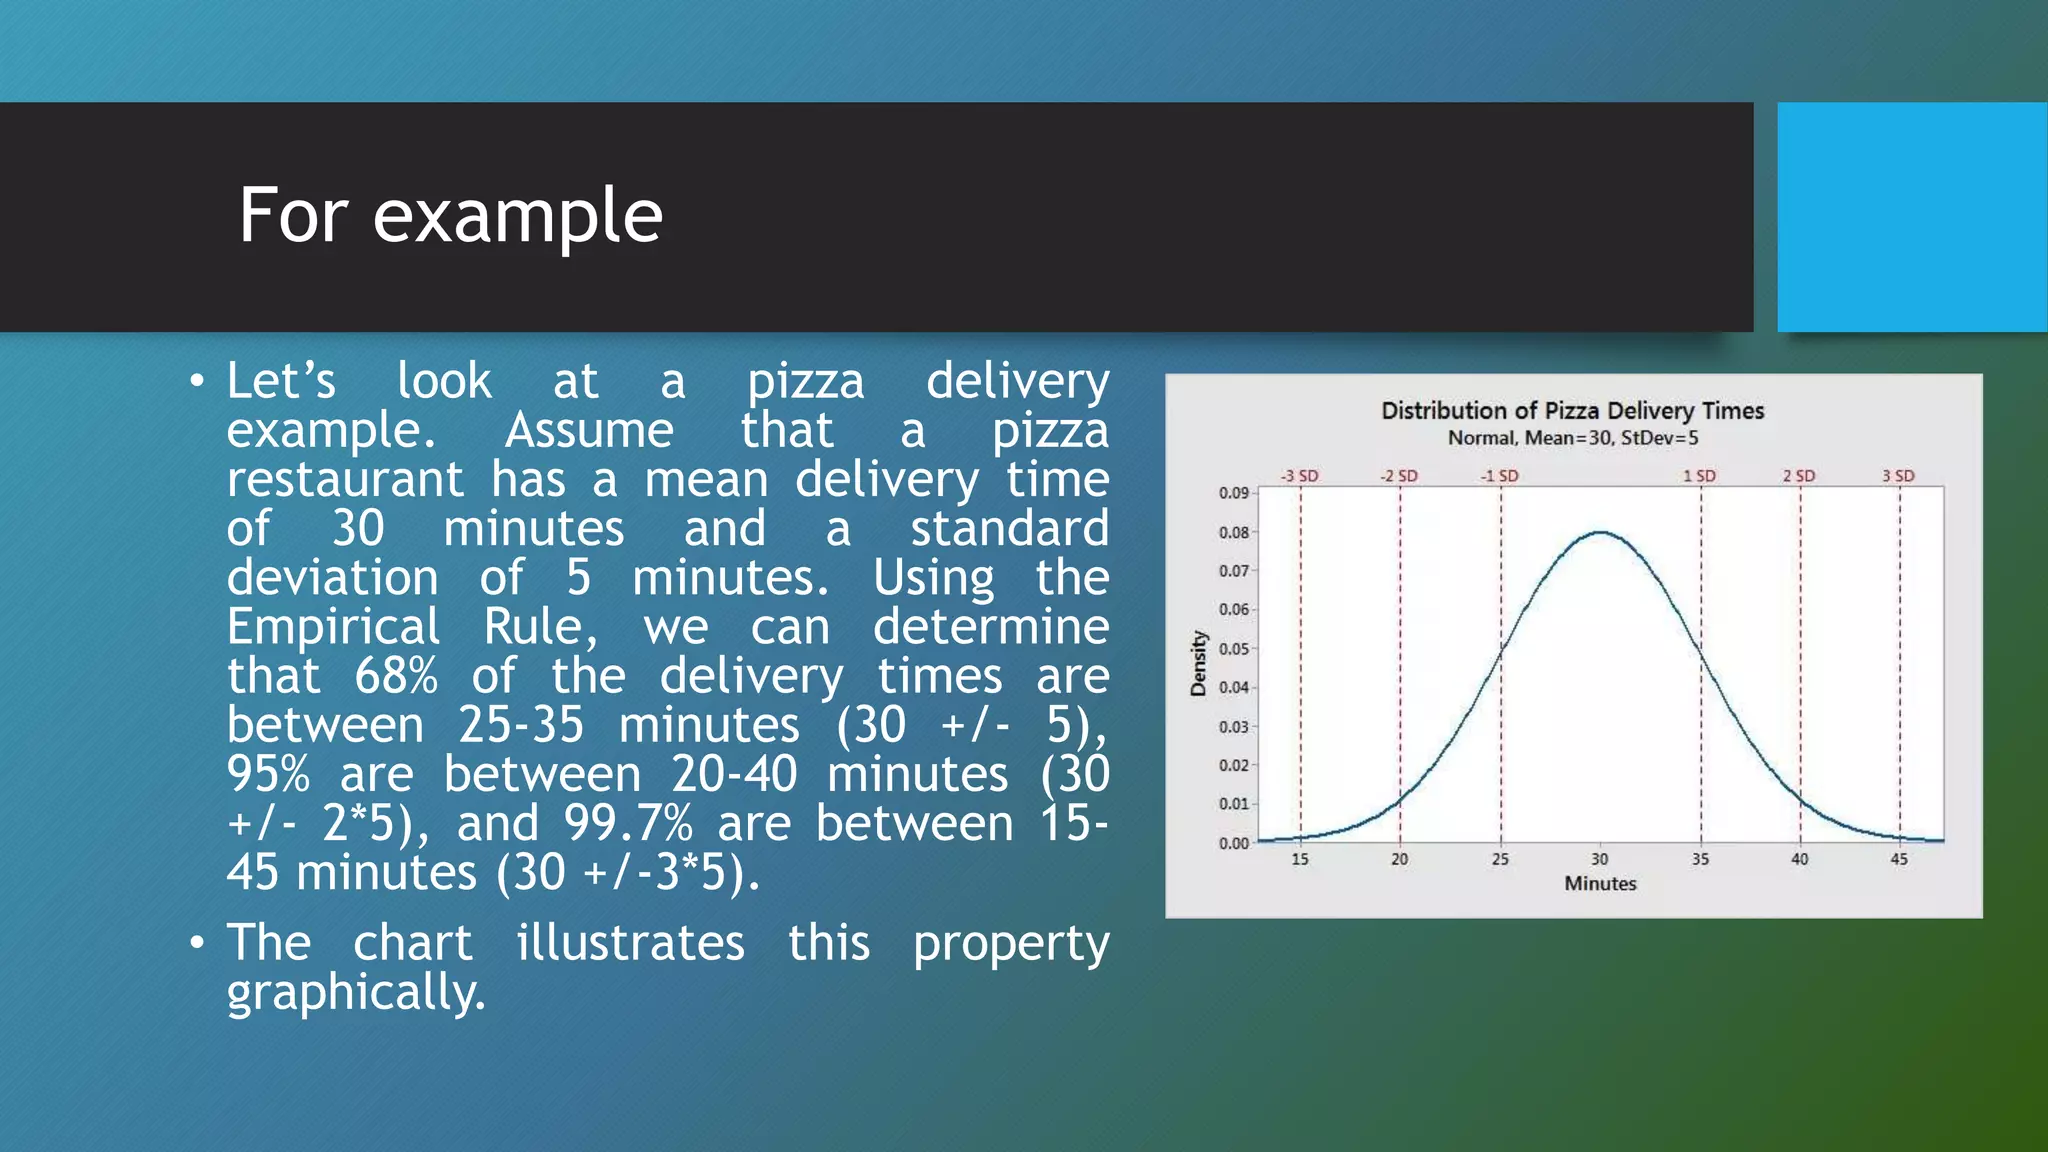
Descriptive
Statistics -2
Dr Qurat-Ul-Ain
Learning Objectives
MEASURE OF DISPERSION 1- RANG
2-FREQUENCY DISTRIBUTION
2- NORMAL DISTRIBUTION
STANDARD DEVIATION
RANGE
•Difference between the smallest and
largest observation/value
Example
10, 44, 45, 23, 86, 9
Range= 86-9=77
FREQUENCY DISTRIBUTION
•Frequency distribution in statistics
provides the information of the number
of occurrences (frequency) of distinct
values distributed within a given period
of time or interval, in a list, table, or
graphical representation.
FREQUENCY DISTRIBUTION
• example of the heights of ten students in cms.
• Frequency Distribution Table
139, 145, 150, 145, 136, 150, 152, 144, 138, 138
• Frequency Distribution Graph
• Using the same above example we can make the following
graph:
Types of Frequency Distribution
1. Grouped frequency distribution.
2. Ungrouped frequency distribution.
3. Cumulative frequency distribution.
4. Relative frequency distribution.
5. Relative cumulative frequency
distribution.
NORMAL DISTRIBUTION
•The normal distribution is the most
widely known and used of
all distributions. Because the normal
distribution approximates many
natural phenomena so well, it has
developed into a standard of
reference for many probability
problems.
NORMAL DISTRIBUTION
• Many groups follow this type of
pattern. That’s why it’s widely
used in business, statistics and
in government bodies :
• Heights of people.
• Measurement errors.
• Blood pressure.
• Points on a test.
• IQ scores.
• Salaries.
NORMAL DISTRIBUTION
• The area under the normal curve
is equal to 1.0.
• It is also known as the Gaussian
distribution and the bell curve.
• Denser in the center and less
dense in the tails.
• Defined by two parameters,
the mean (μ) and the standard
deviation (σ).
STANDARD DEVIATION
• The standard deviation is the
"average" degree to which scores
deviate from the mean. More
precisely, you measure how far all
your measurements are from the
mean, square each one, and add
them all up. The result is called
the variance
• The square root of variance is
standard deviation
Formula of standard deviation
Height data are normally distributed. The
distribution in this example fits real data from
14-year-old girls during a study.
The Empirical Rule for the Normal
Distribution
• For example, in a normal distribution, 68% of the observations
fall within +/- 1 standard deviation from the mean. This
property is part of the Empirical Rule, which describes the
percentage of the data that fall within specific numbers of
standard deviations from the mean for bell-shaped curves.
• Mean +/- standard deviations ----- Percentage of data
contained
• 1 ------------ 68%
• 2 ------------ 95%
• 3 ------------ 99.7%
Mean +/- standard deviations -----Percentage of data contained
1 ------- 68%
2 ------- 95%
3 ------ 99.7%
For example
• Let’s look at a pizza delivery
example. Assume that a pizza
restaurant has a mean delivery time
of 30 minutes and a standard
deviation of 5 minutes. Using the
Empirical Rule, we can determine
that 68% of the delivery times are
between 25-35 minutes (30 +/- 5),
95% are between 20-40 minutes (30
+/- 2*5), and 99.7% are between 15-
45 minutes (30 +/-3*5).
• The chart illustrates this property
graphically.
Watch video during SDL slot
https://www.youtube.com/watch?v=mtbJbDwqWLE

Descriptive statistics -2

  • 1.
  • 2.
    Learning Objectives MEASURE OFDISPERSION 1- RANG 2-FREQUENCY DISTRIBUTION 2- NORMAL DISTRIBUTION STANDARD DEVIATION
  • 3.
    RANGE •Difference between thesmallest and largest observation/value Example 10, 44, 45, 23, 86, 9 Range= 86-9=77
  • 4.
    FREQUENCY DISTRIBUTION •Frequency distributionin statistics provides the information of the number of occurrences (frequency) of distinct values distributed within a given period of time or interval, in a list, table, or graphical representation.
  • 5.
    FREQUENCY DISTRIBUTION • exampleof the heights of ten students in cms. • Frequency Distribution Table 139, 145, 150, 145, 136, 150, 152, 144, 138, 138
  • 6.
    • Frequency DistributionGraph • Using the same above example we can make the following graph:
  • 7.
    Types of FrequencyDistribution 1. Grouped frequency distribution. 2. Ungrouped frequency distribution. 3. Cumulative frequency distribution. 4. Relative frequency distribution. 5. Relative cumulative frequency distribution.
  • 8.
    NORMAL DISTRIBUTION •The normaldistribution is the most widely known and used of all distributions. Because the normal distribution approximates many natural phenomena so well, it has developed into a standard of reference for many probability problems.
  • 9.
    NORMAL DISTRIBUTION • Manygroups follow this type of pattern. That’s why it’s widely used in business, statistics and in government bodies : • Heights of people. • Measurement errors. • Blood pressure. • Points on a test. • IQ scores. • Salaries.
  • 10.
    NORMAL DISTRIBUTION • Thearea under the normal curve is equal to 1.0. • It is also known as the Gaussian distribution and the bell curve. • Denser in the center and less dense in the tails. • Defined by two parameters, the mean (μ) and the standard deviation (σ).
  • 11.
    STANDARD DEVIATION • Thestandard deviation is the "average" degree to which scores deviate from the mean. More precisely, you measure how far all your measurements are from the mean, square each one, and add them all up. The result is called the variance • The square root of variance is standard deviation
  • 12.
  • 14.
    Height data arenormally distributed. The distribution in this example fits real data from 14-year-old girls during a study.
  • 17.
    The Empirical Rulefor the Normal Distribution • For example, in a normal distribution, 68% of the observations fall within +/- 1 standard deviation from the mean. This property is part of the Empirical Rule, which describes the percentage of the data that fall within specific numbers of standard deviations from the mean for bell-shaped curves. • Mean +/- standard deviations ----- Percentage of data contained • 1 ------------ 68% • 2 ------------ 95% • 3 ------------ 99.7%
  • 18.
    Mean +/- standarddeviations -----Percentage of data contained 1 ------- 68% 2 ------- 95% 3 ------ 99.7%
  • 19.
    For example • Let’slook at a pizza delivery example. Assume that a pizza restaurant has a mean delivery time of 30 minutes and a standard deviation of 5 minutes. Using the Empirical Rule, we can determine that 68% of the delivery times are between 25-35 minutes (30 +/- 5), 95% are between 20-40 minutes (30 +/- 2*5), and 99.7% are between 15- 45 minutes (30 +/-3*5). • The chart illustrates this property graphically.
  • 22.
    Watch video duringSDL slot https://www.youtube.com/watch?v=mtbJbDwqWLE