Downloaded 218 times


The document discusses different types of averages including mode, mean, and median. It provides definitions and examples of how to calculate each. The mode is the most common value, the mean is the average found by adding all values and dividing by the total count, and the median is the middle value when data is arranged in order. The document shows how to identify the mode, mean, and median in various data sets and discusses when each measure is most appropriate.
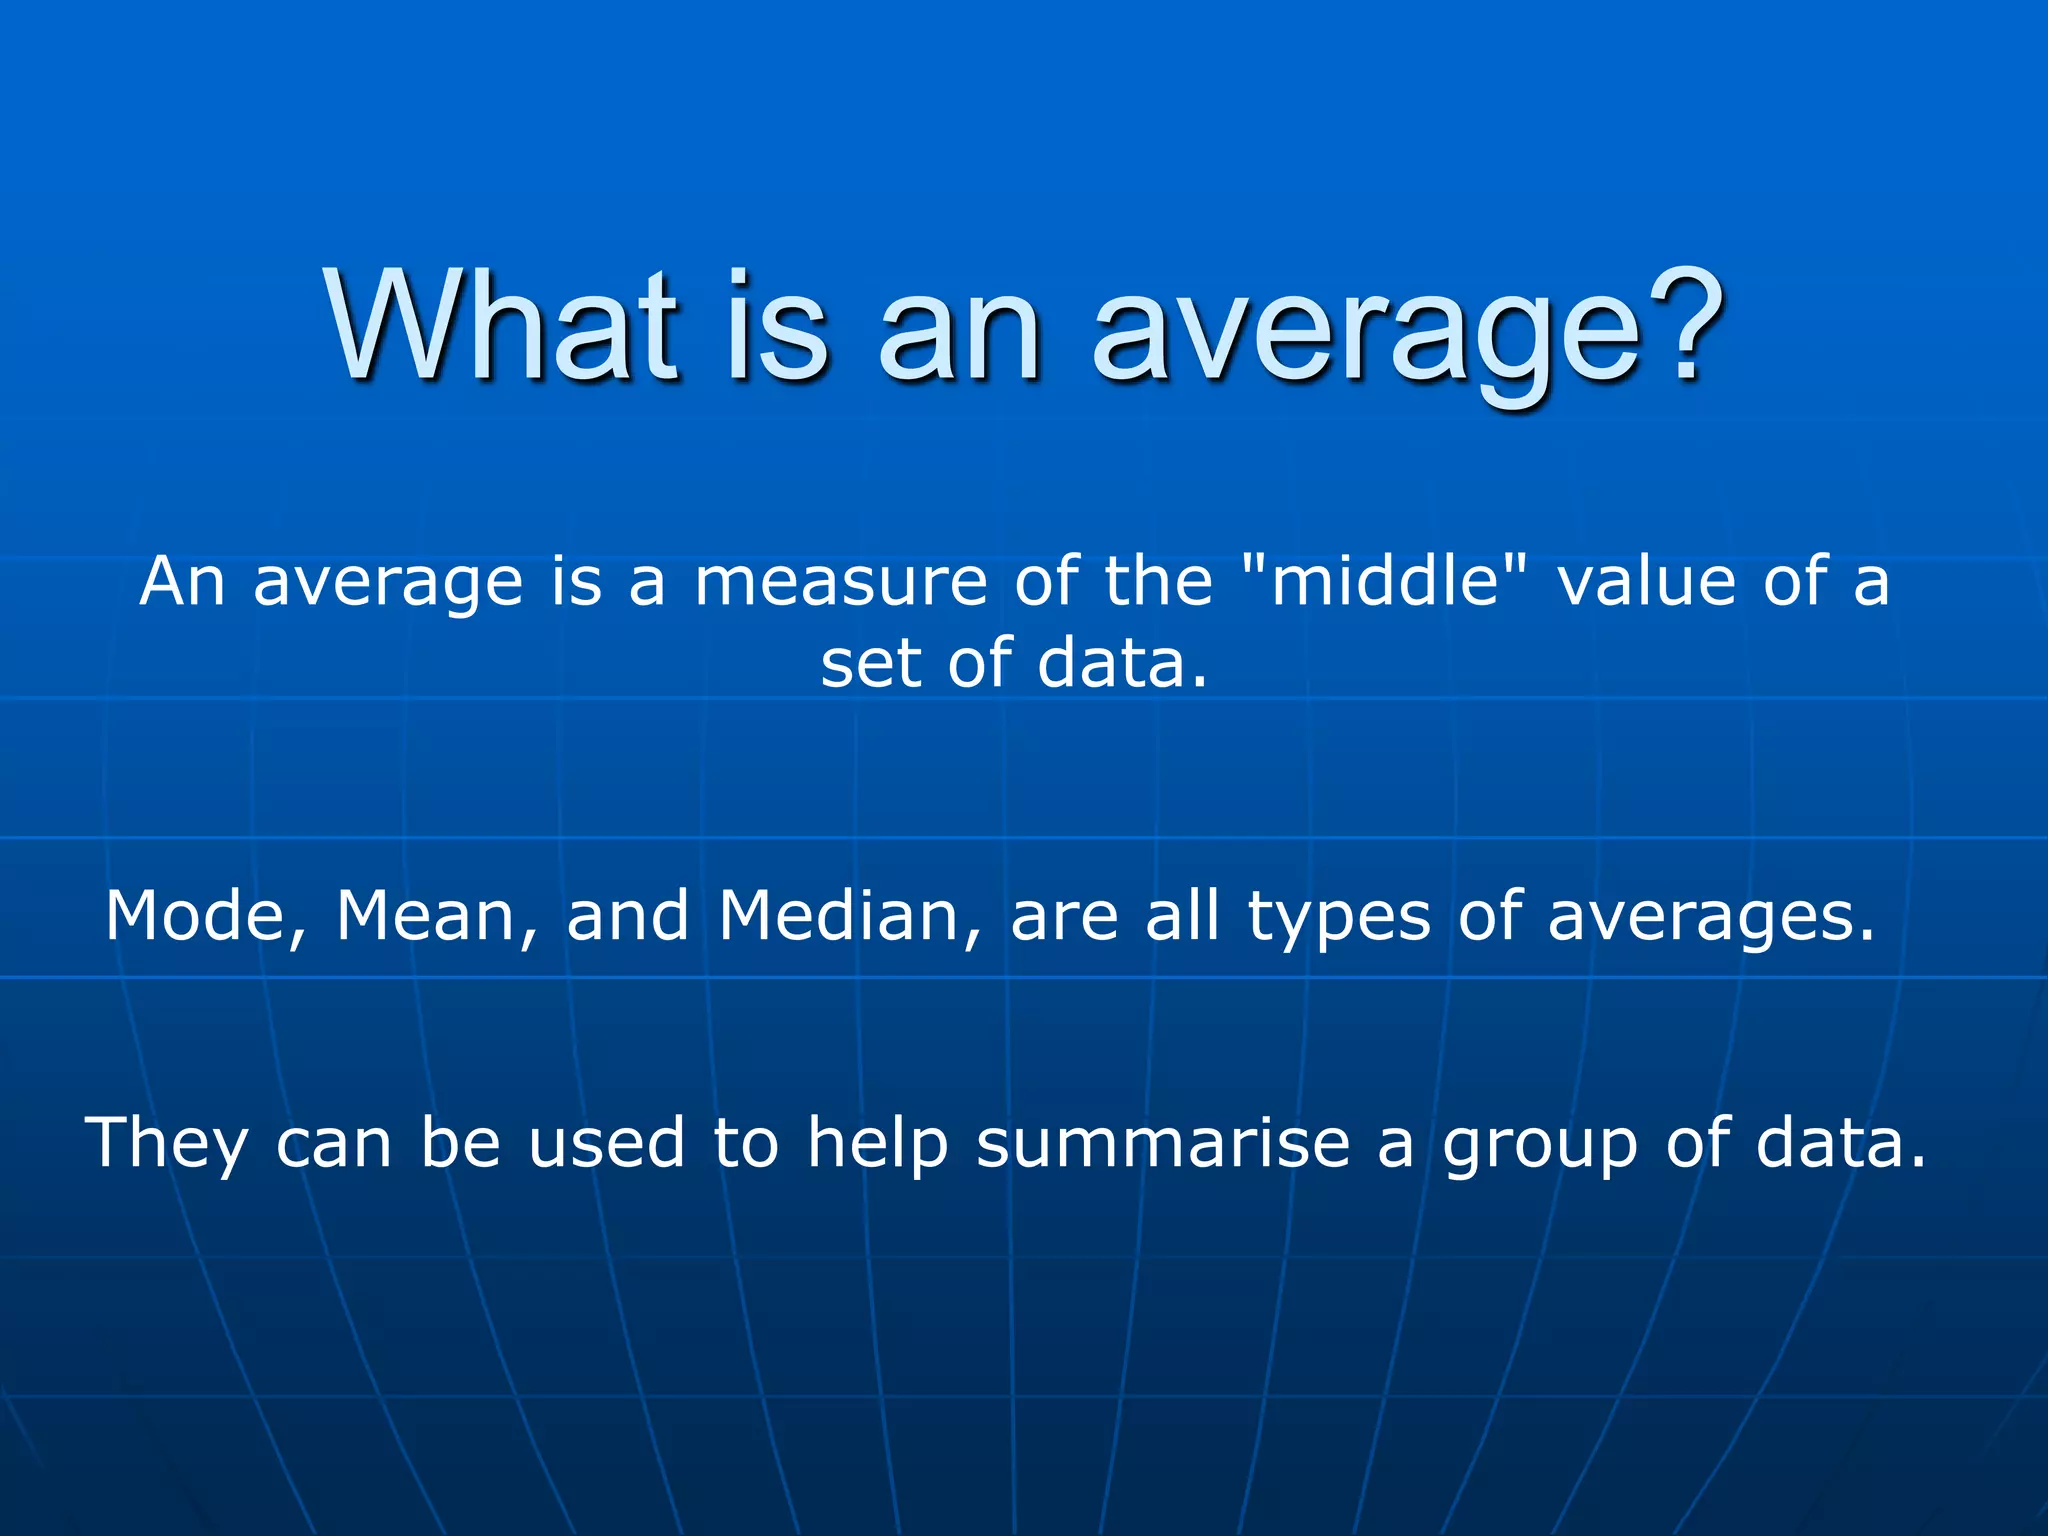
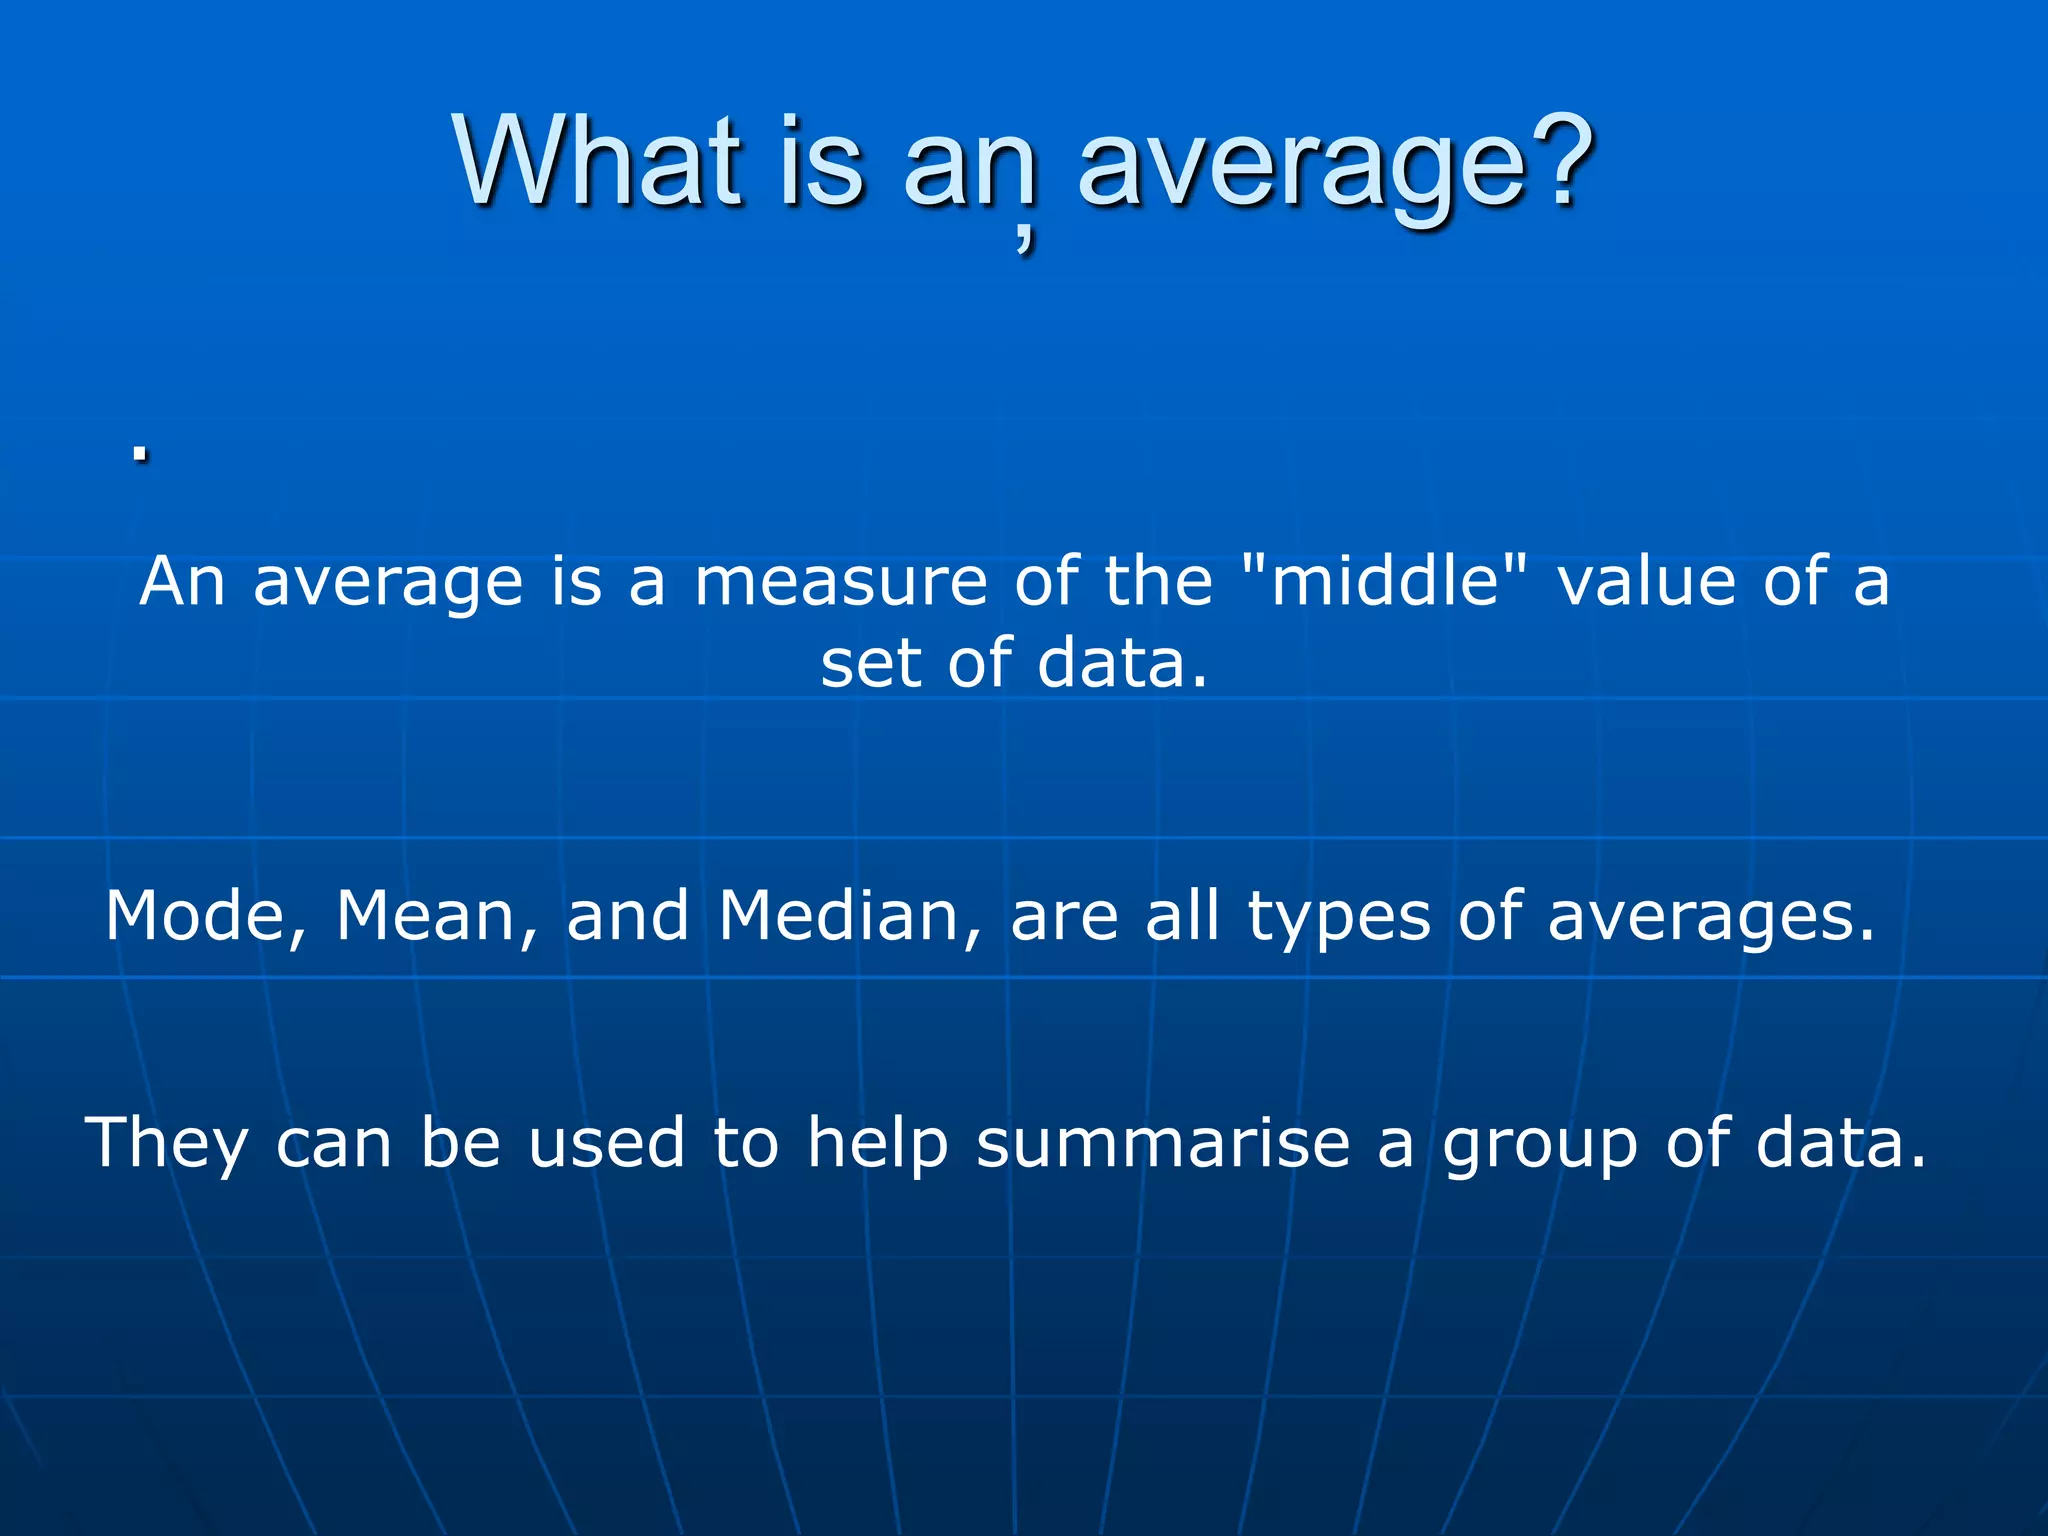
Introduction to statistics and data, defines average as Mode, Mean, and Median.
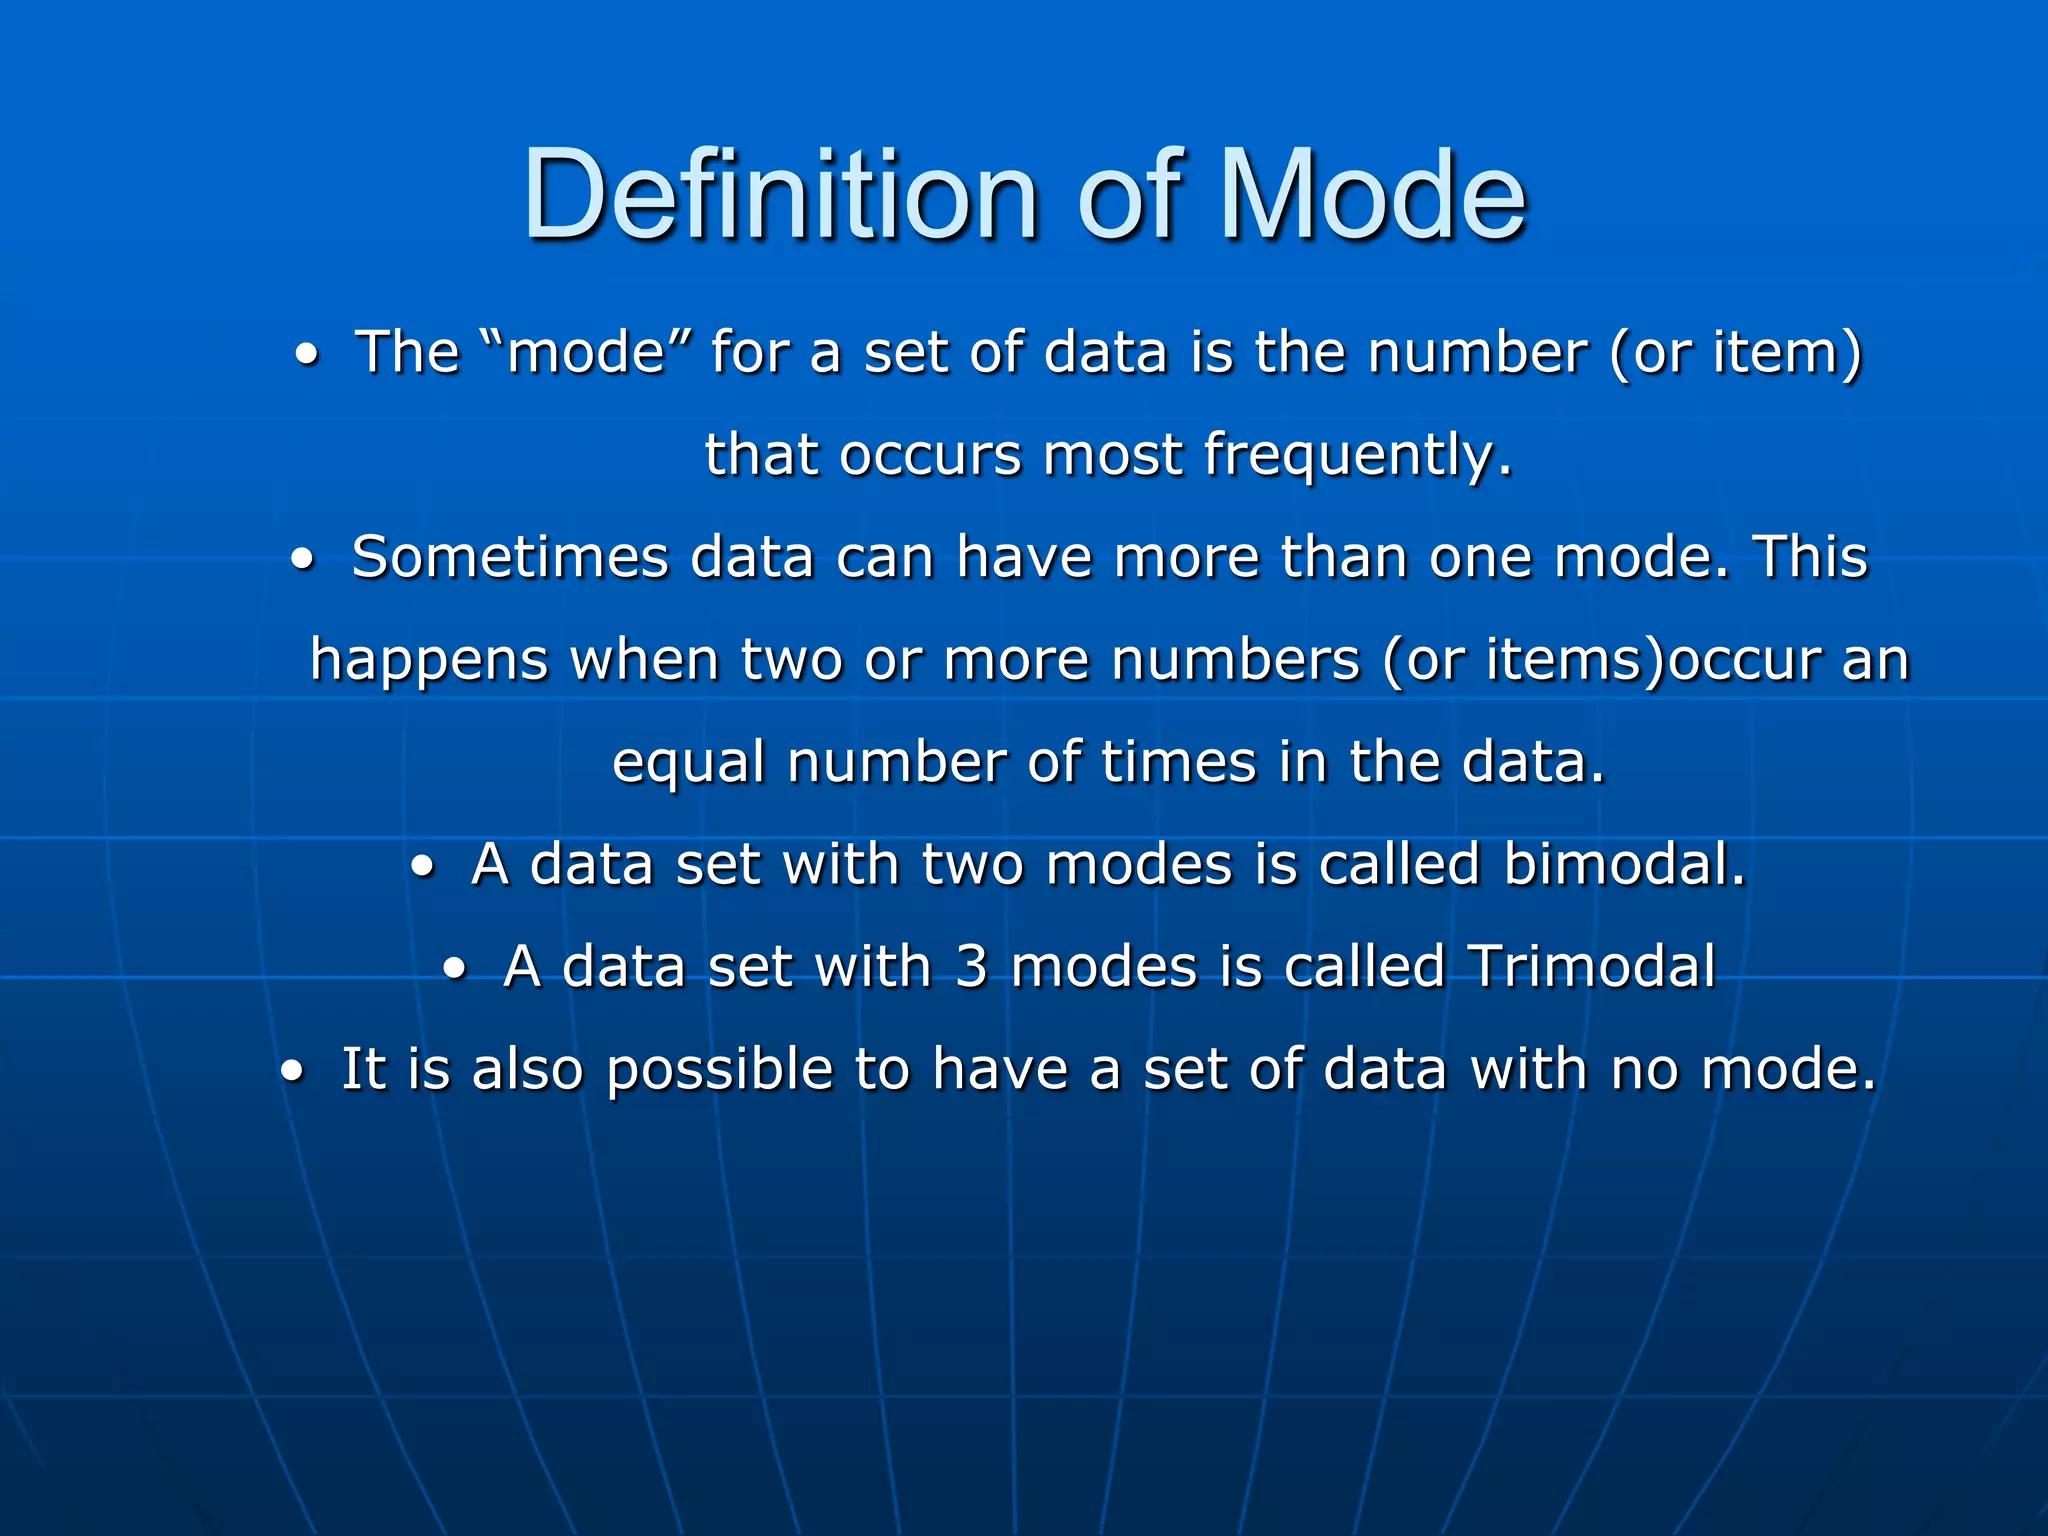
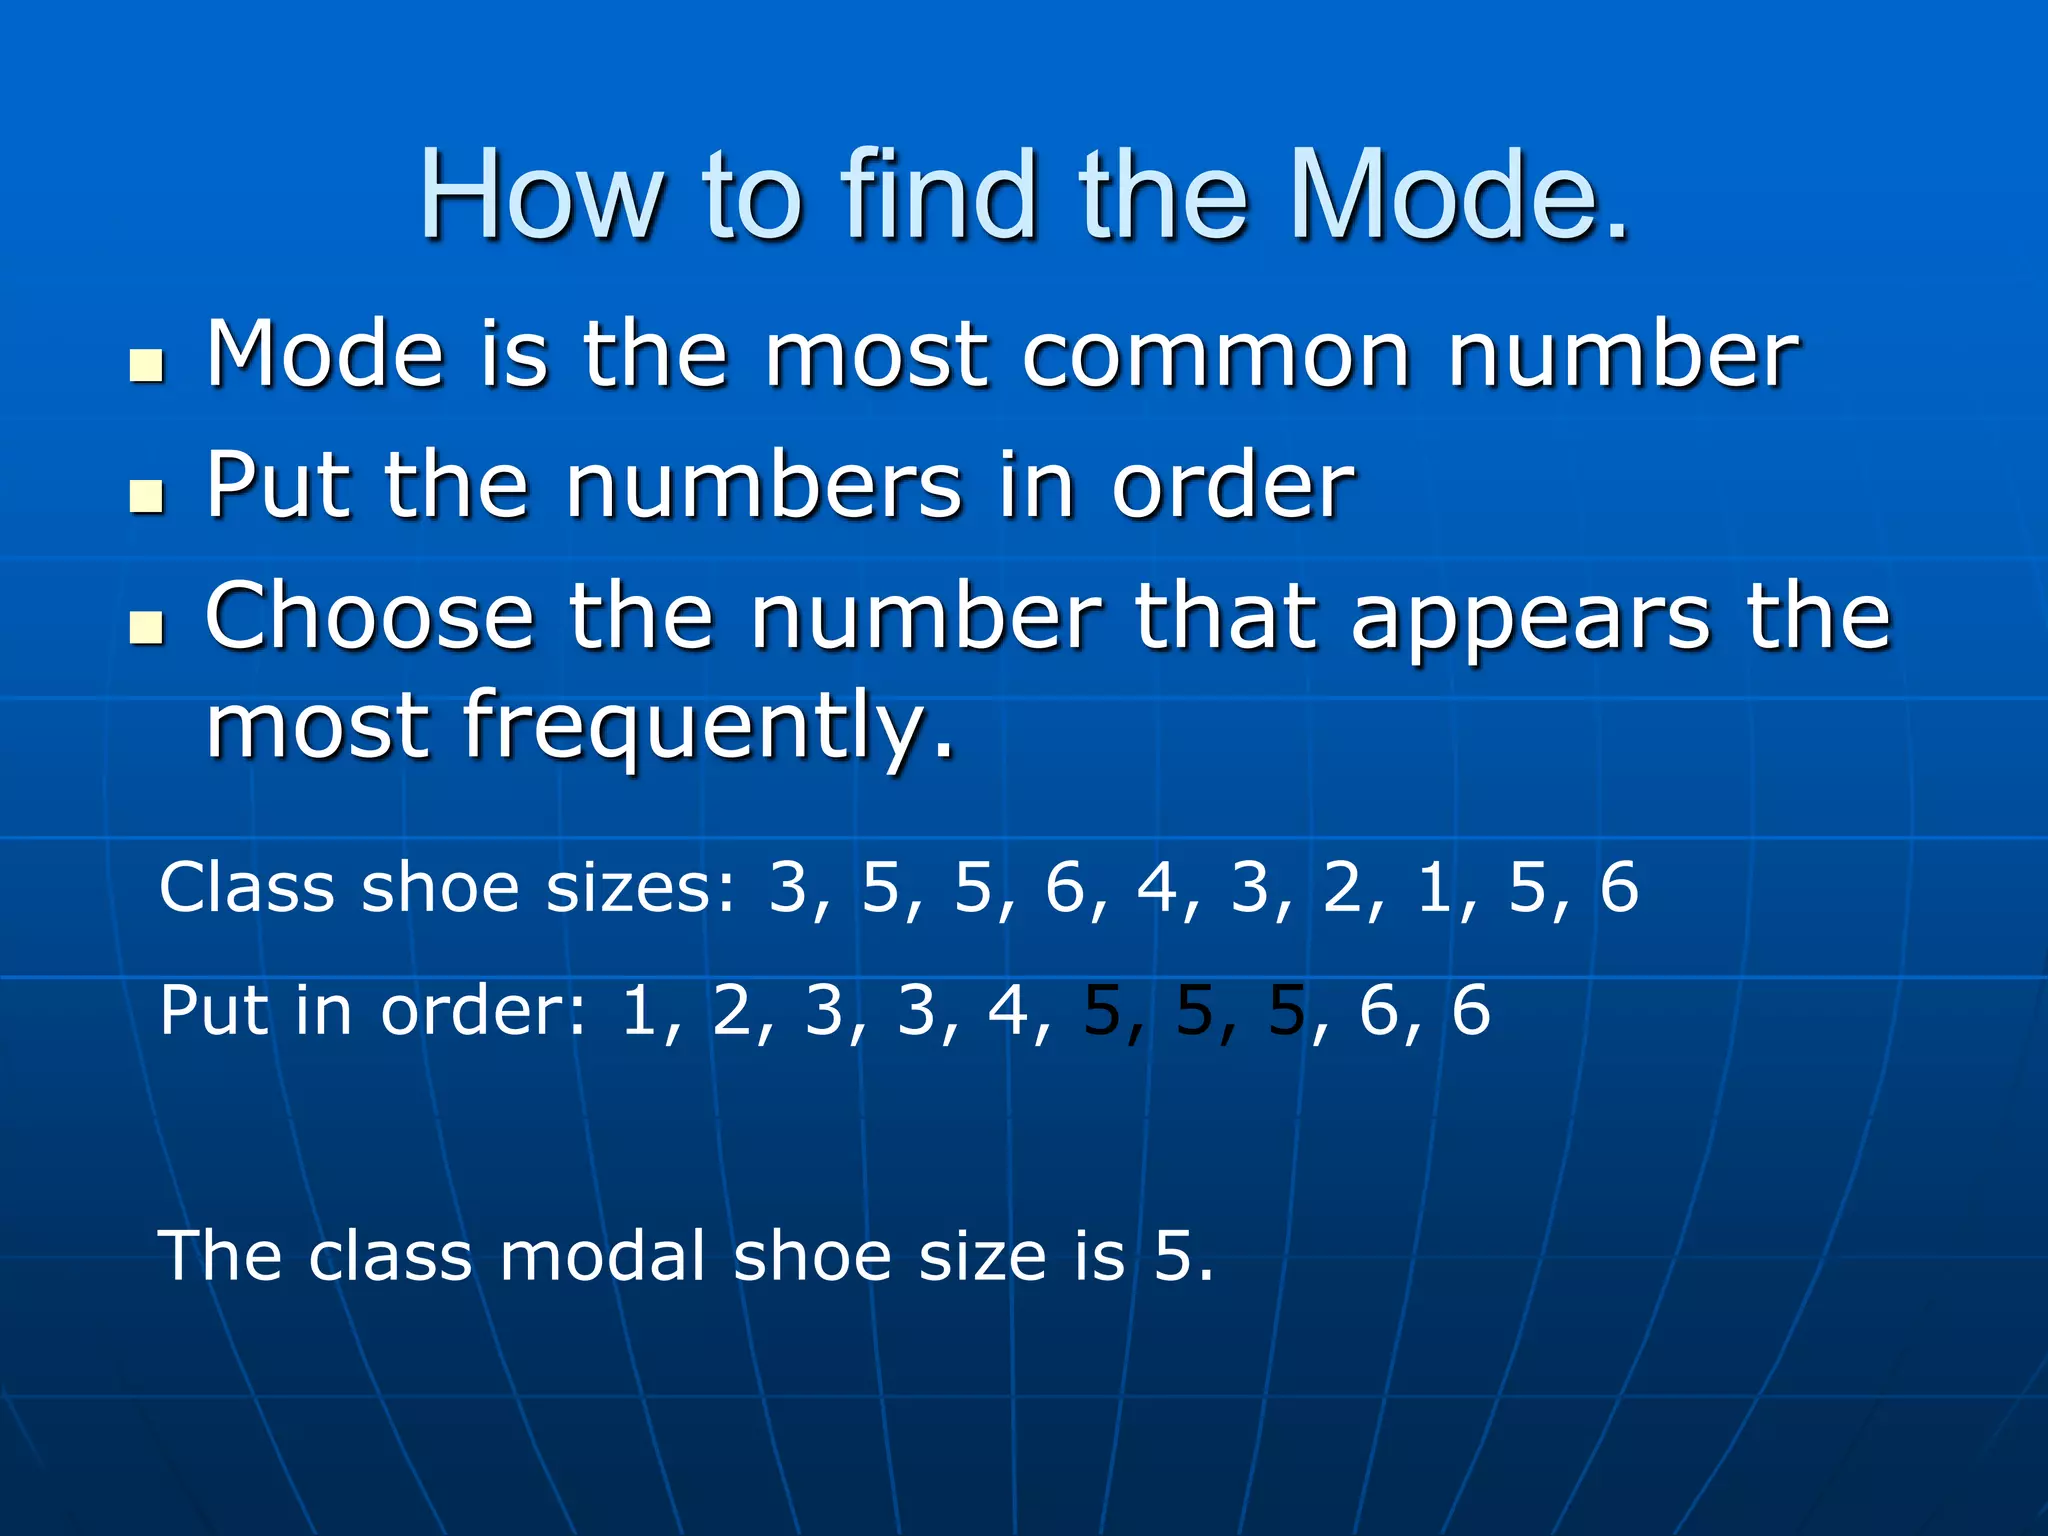
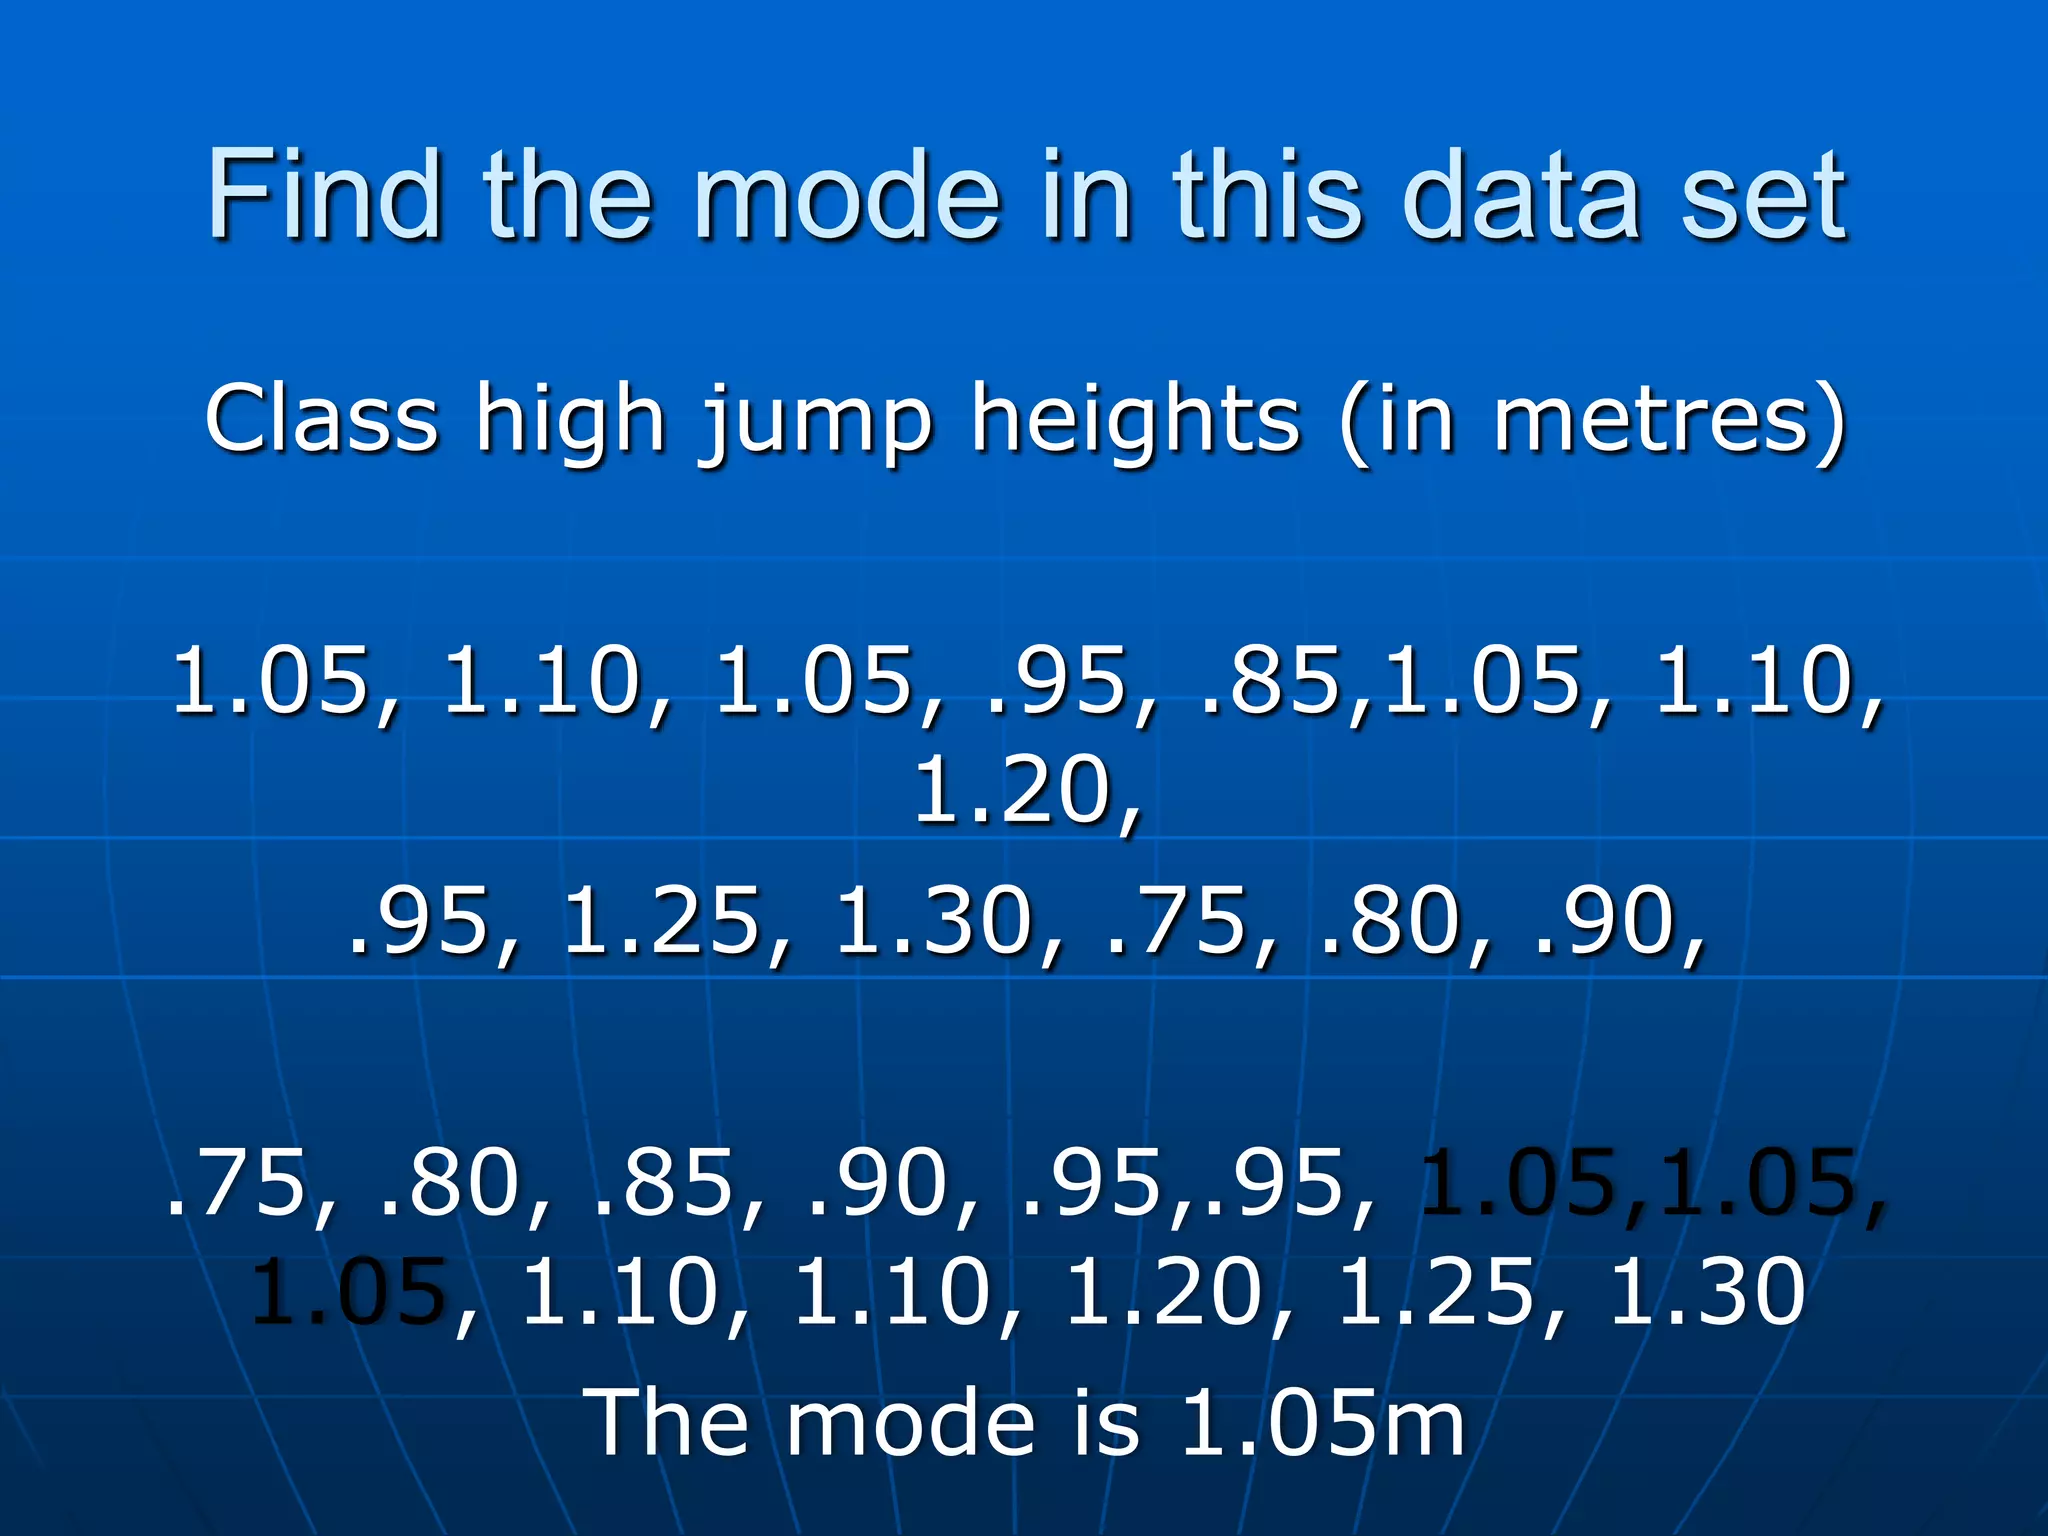
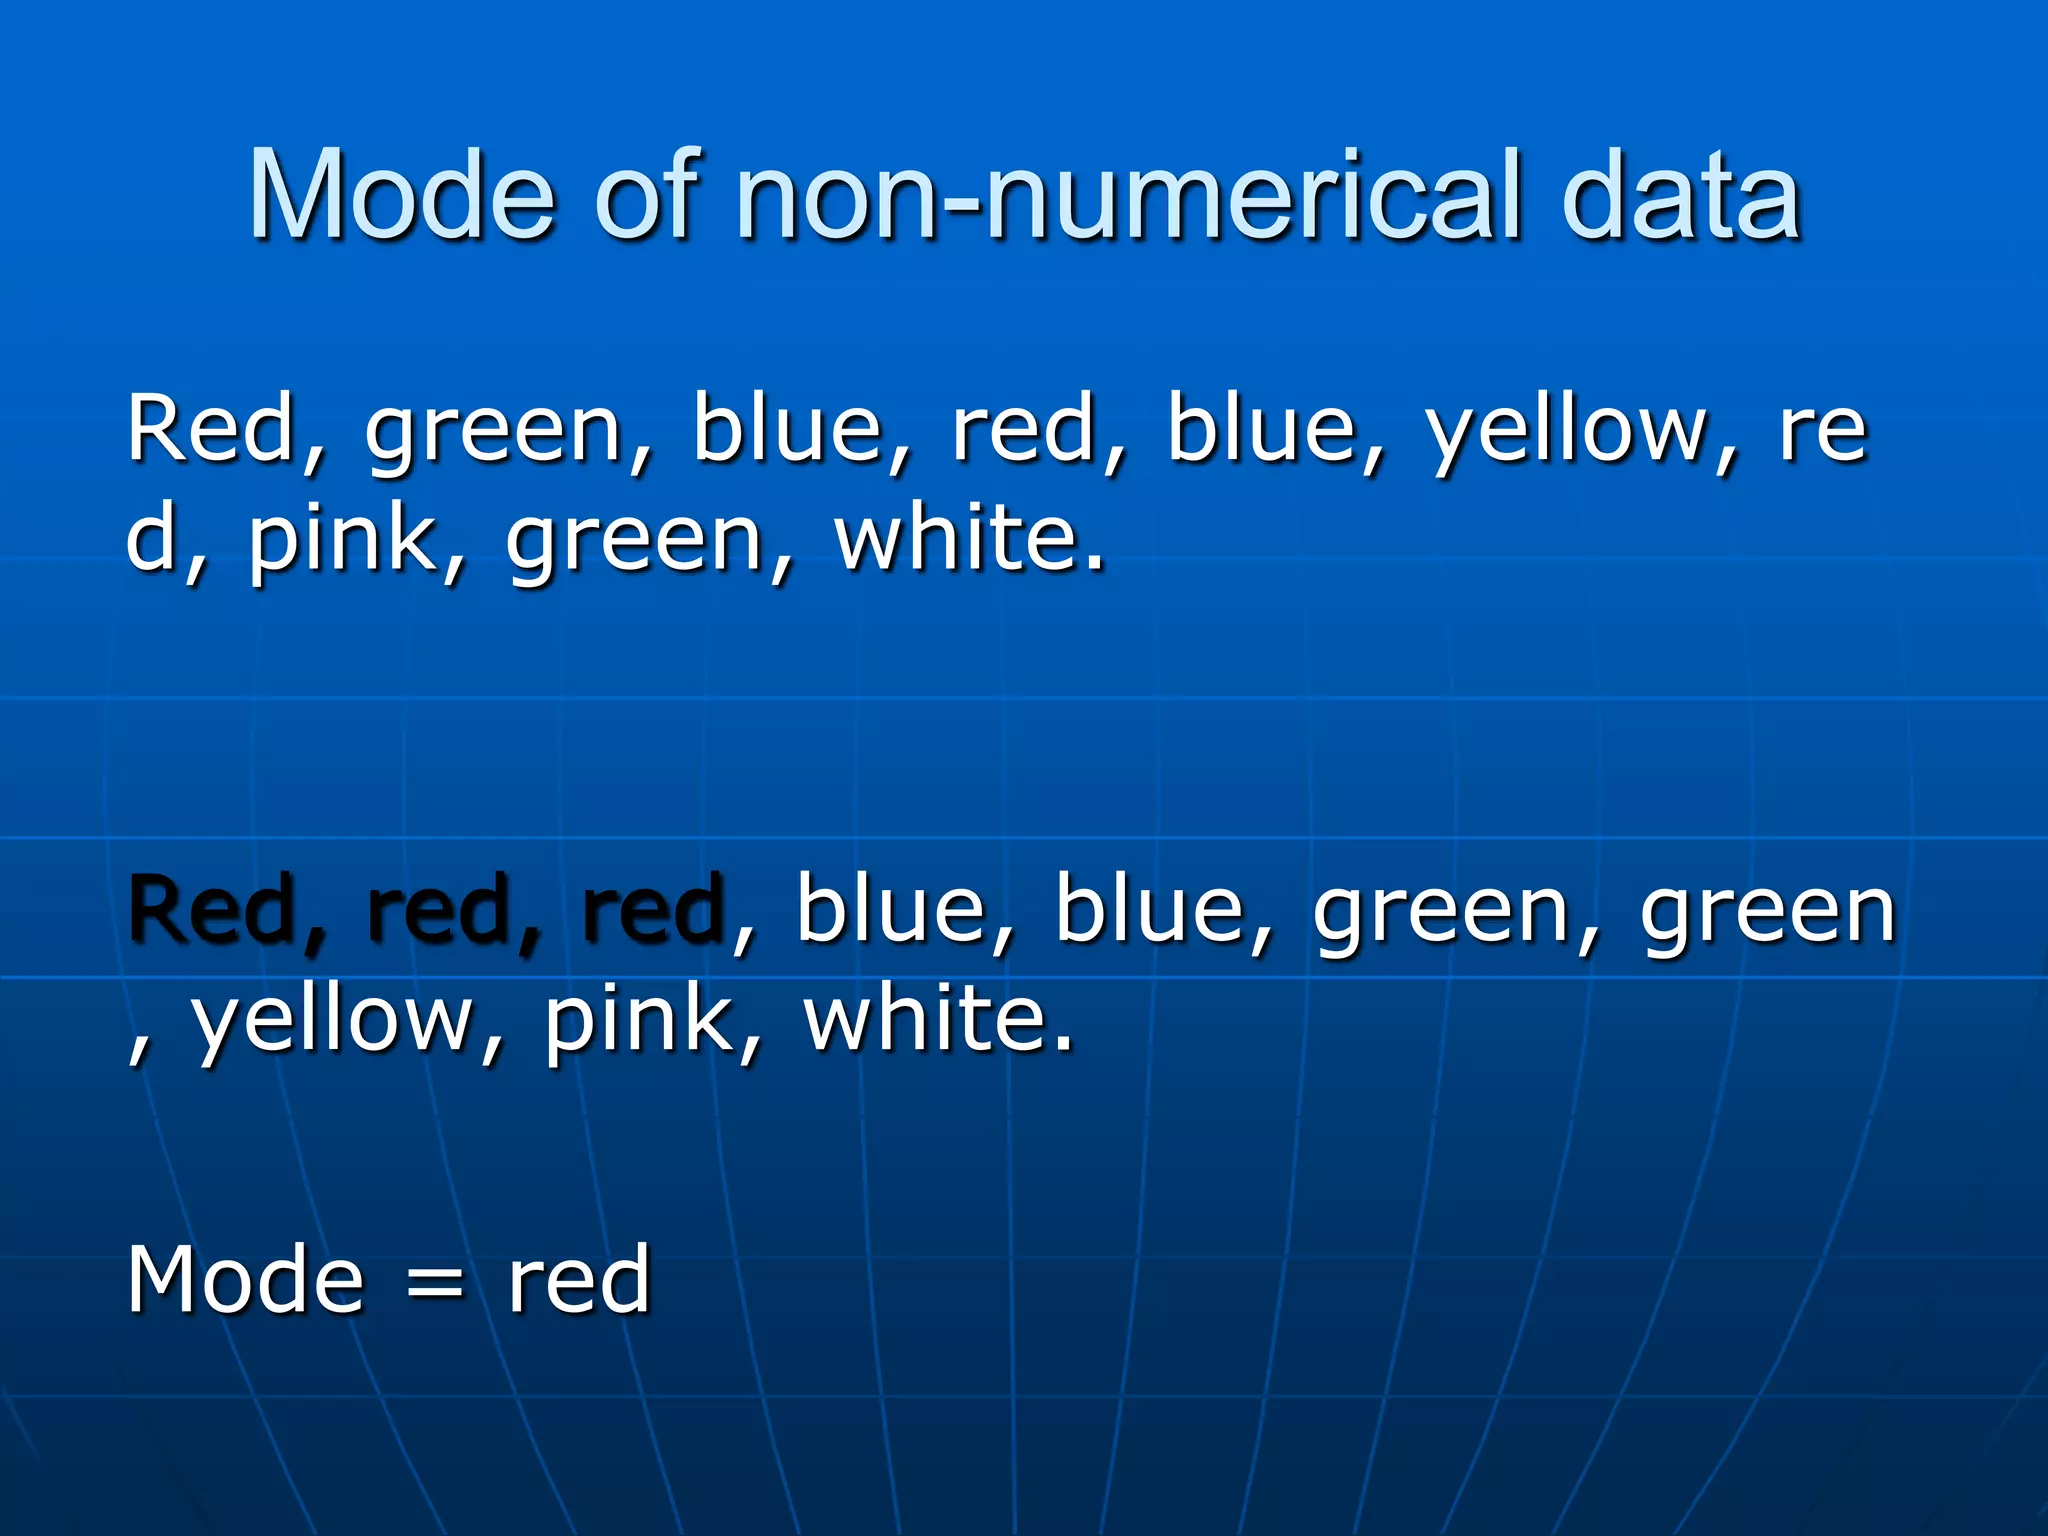
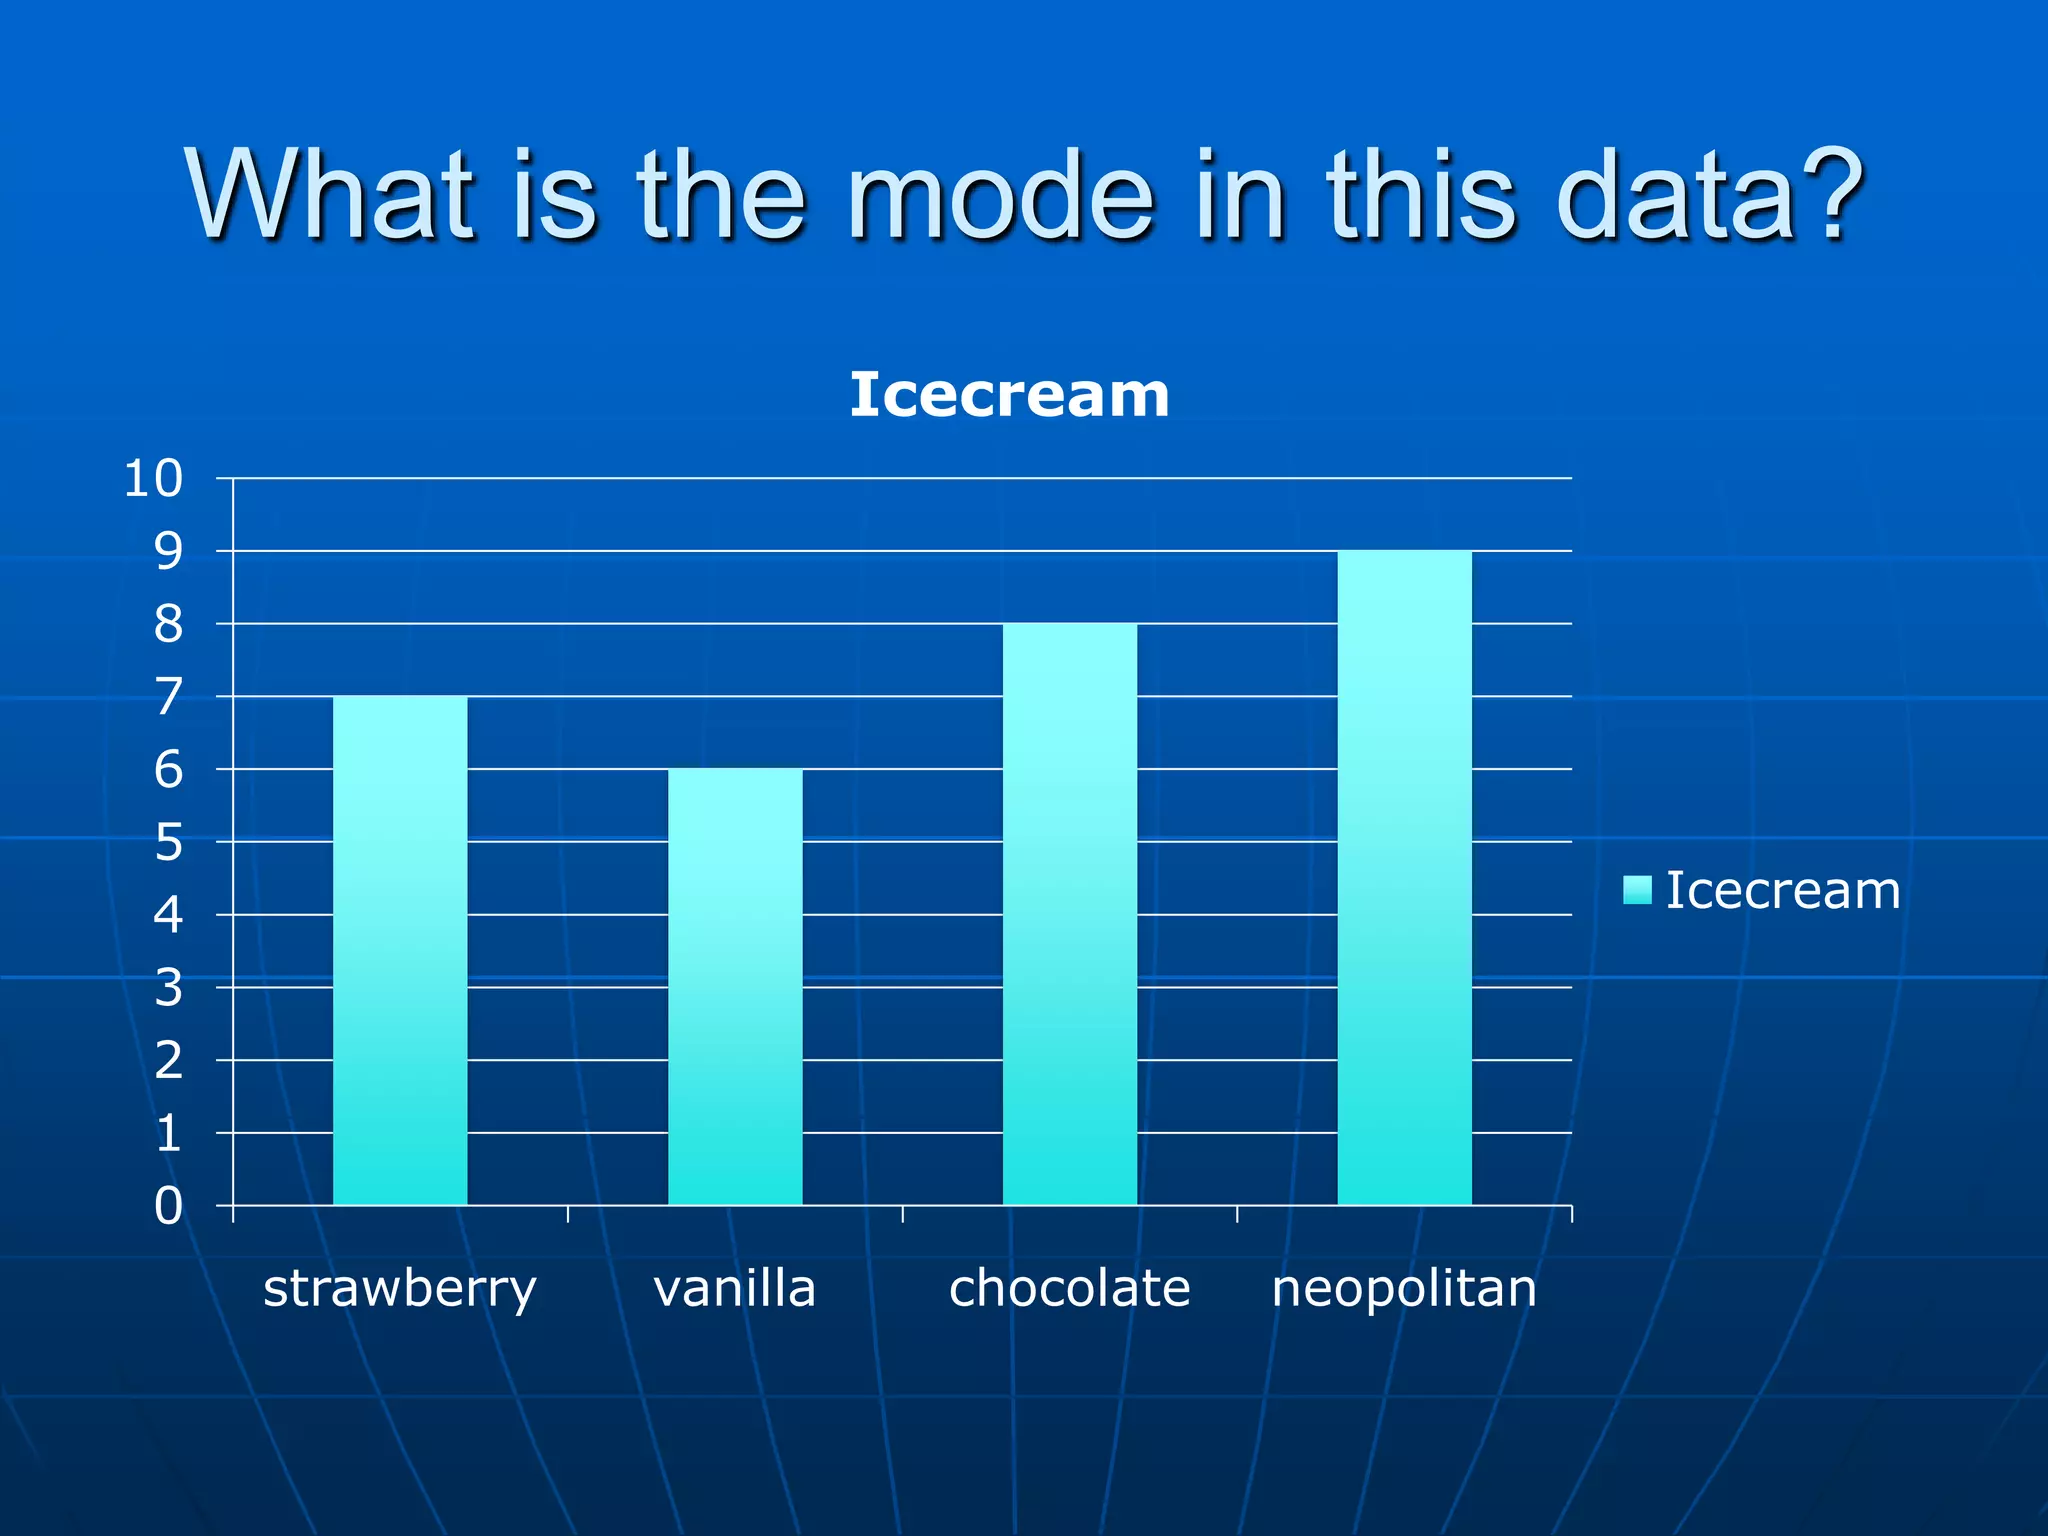
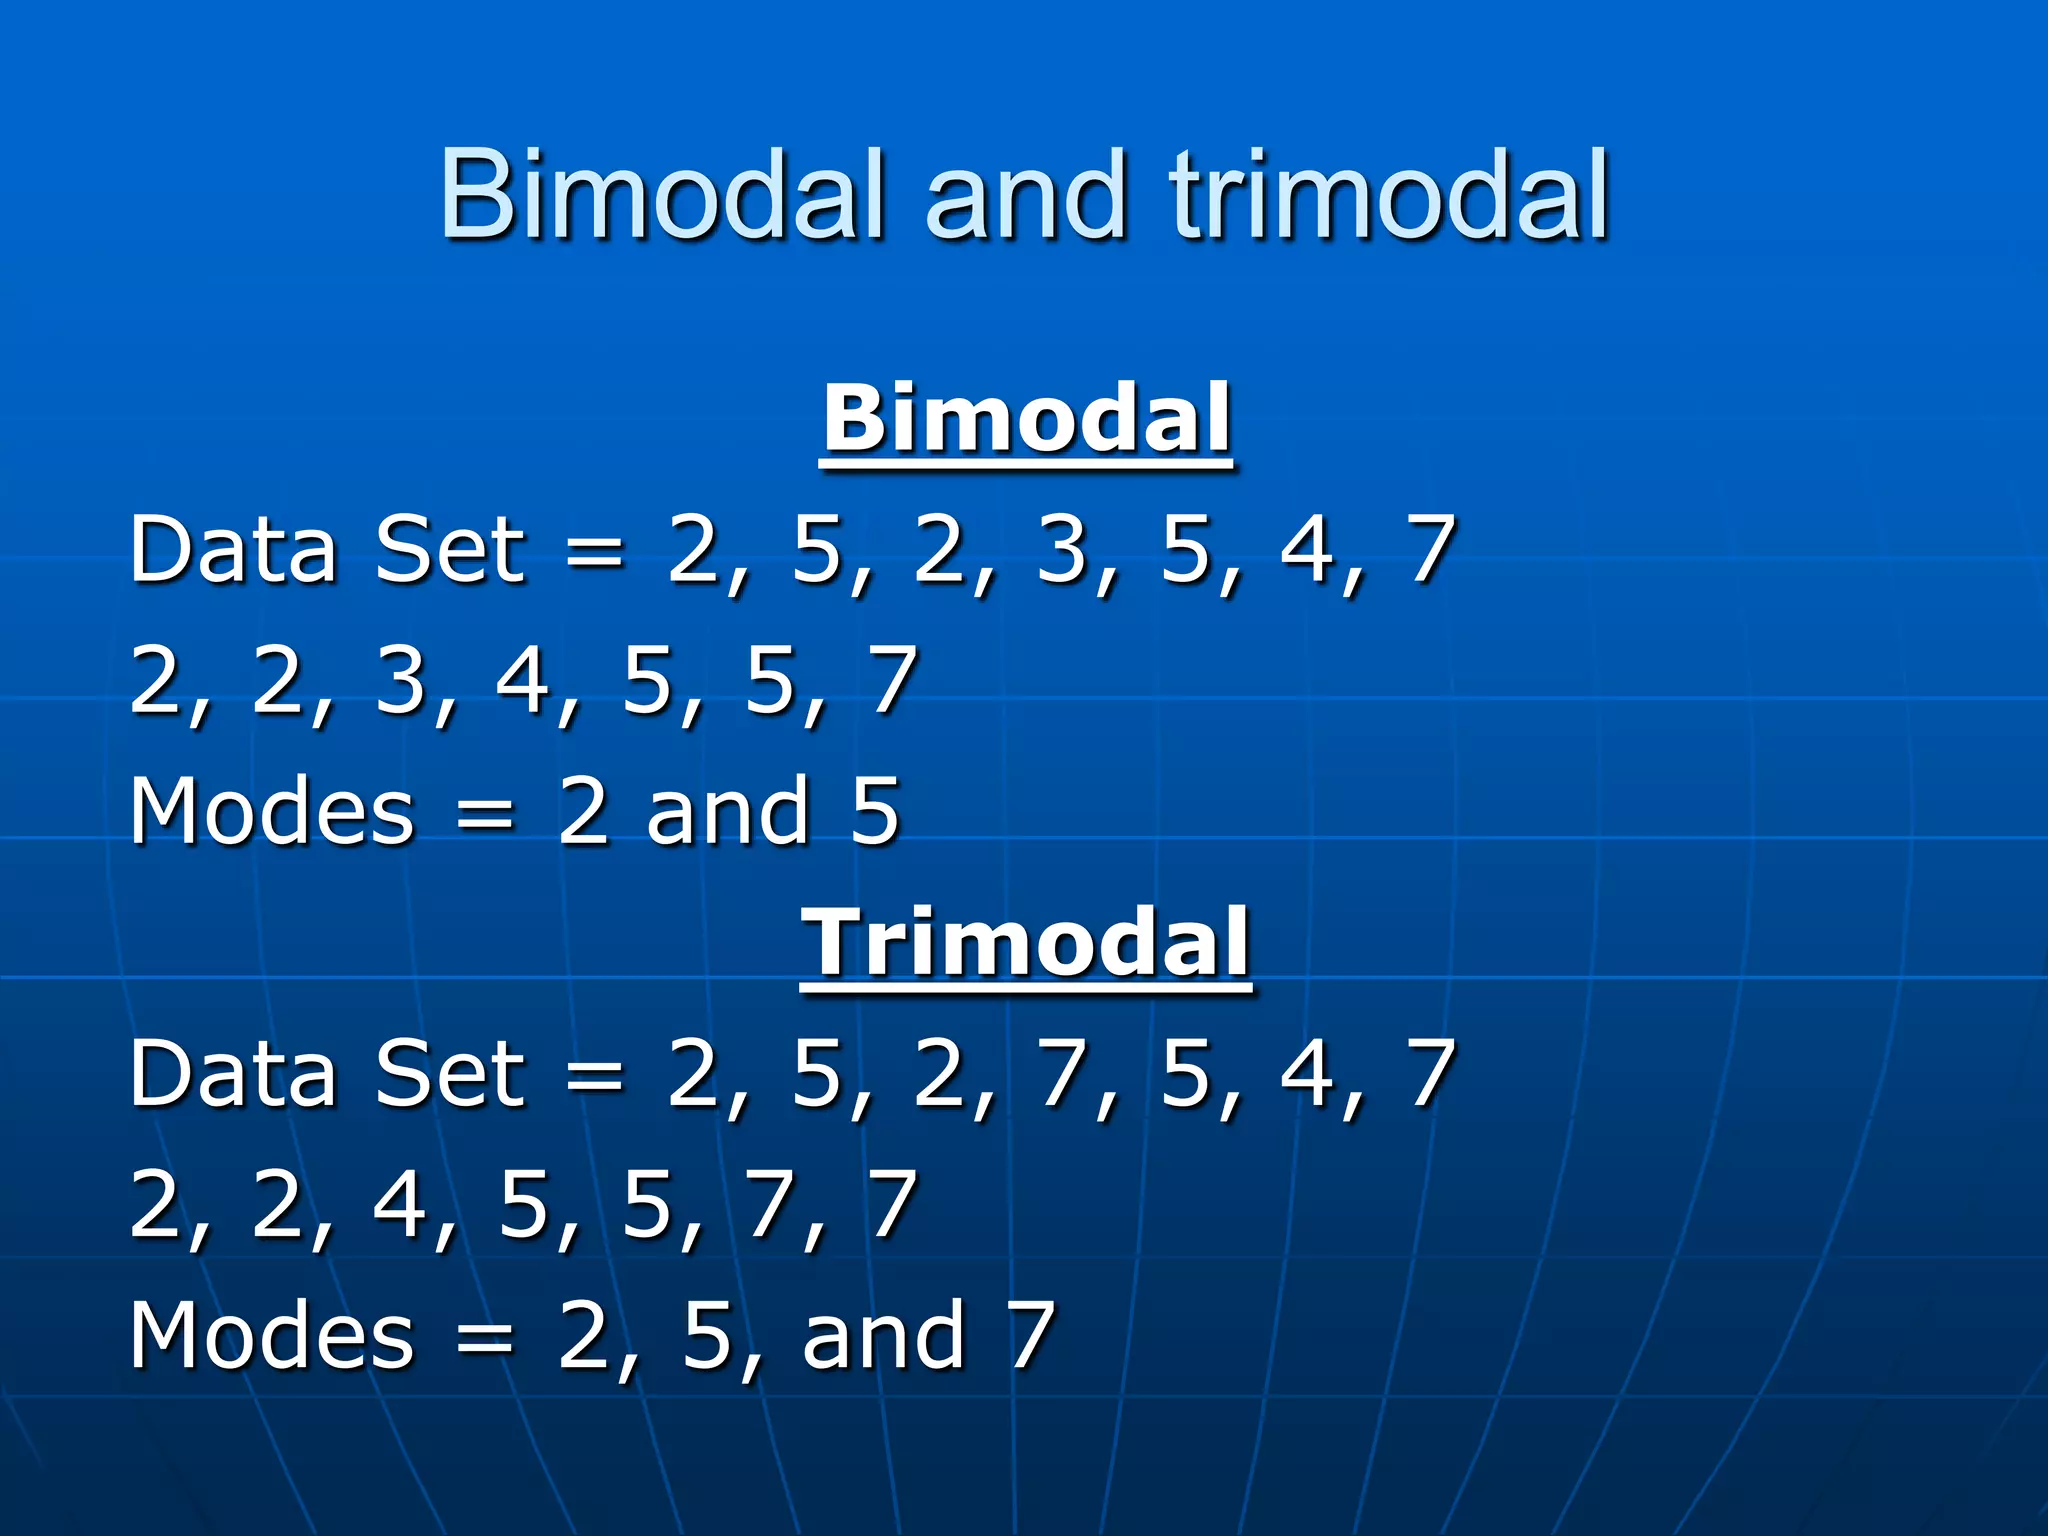
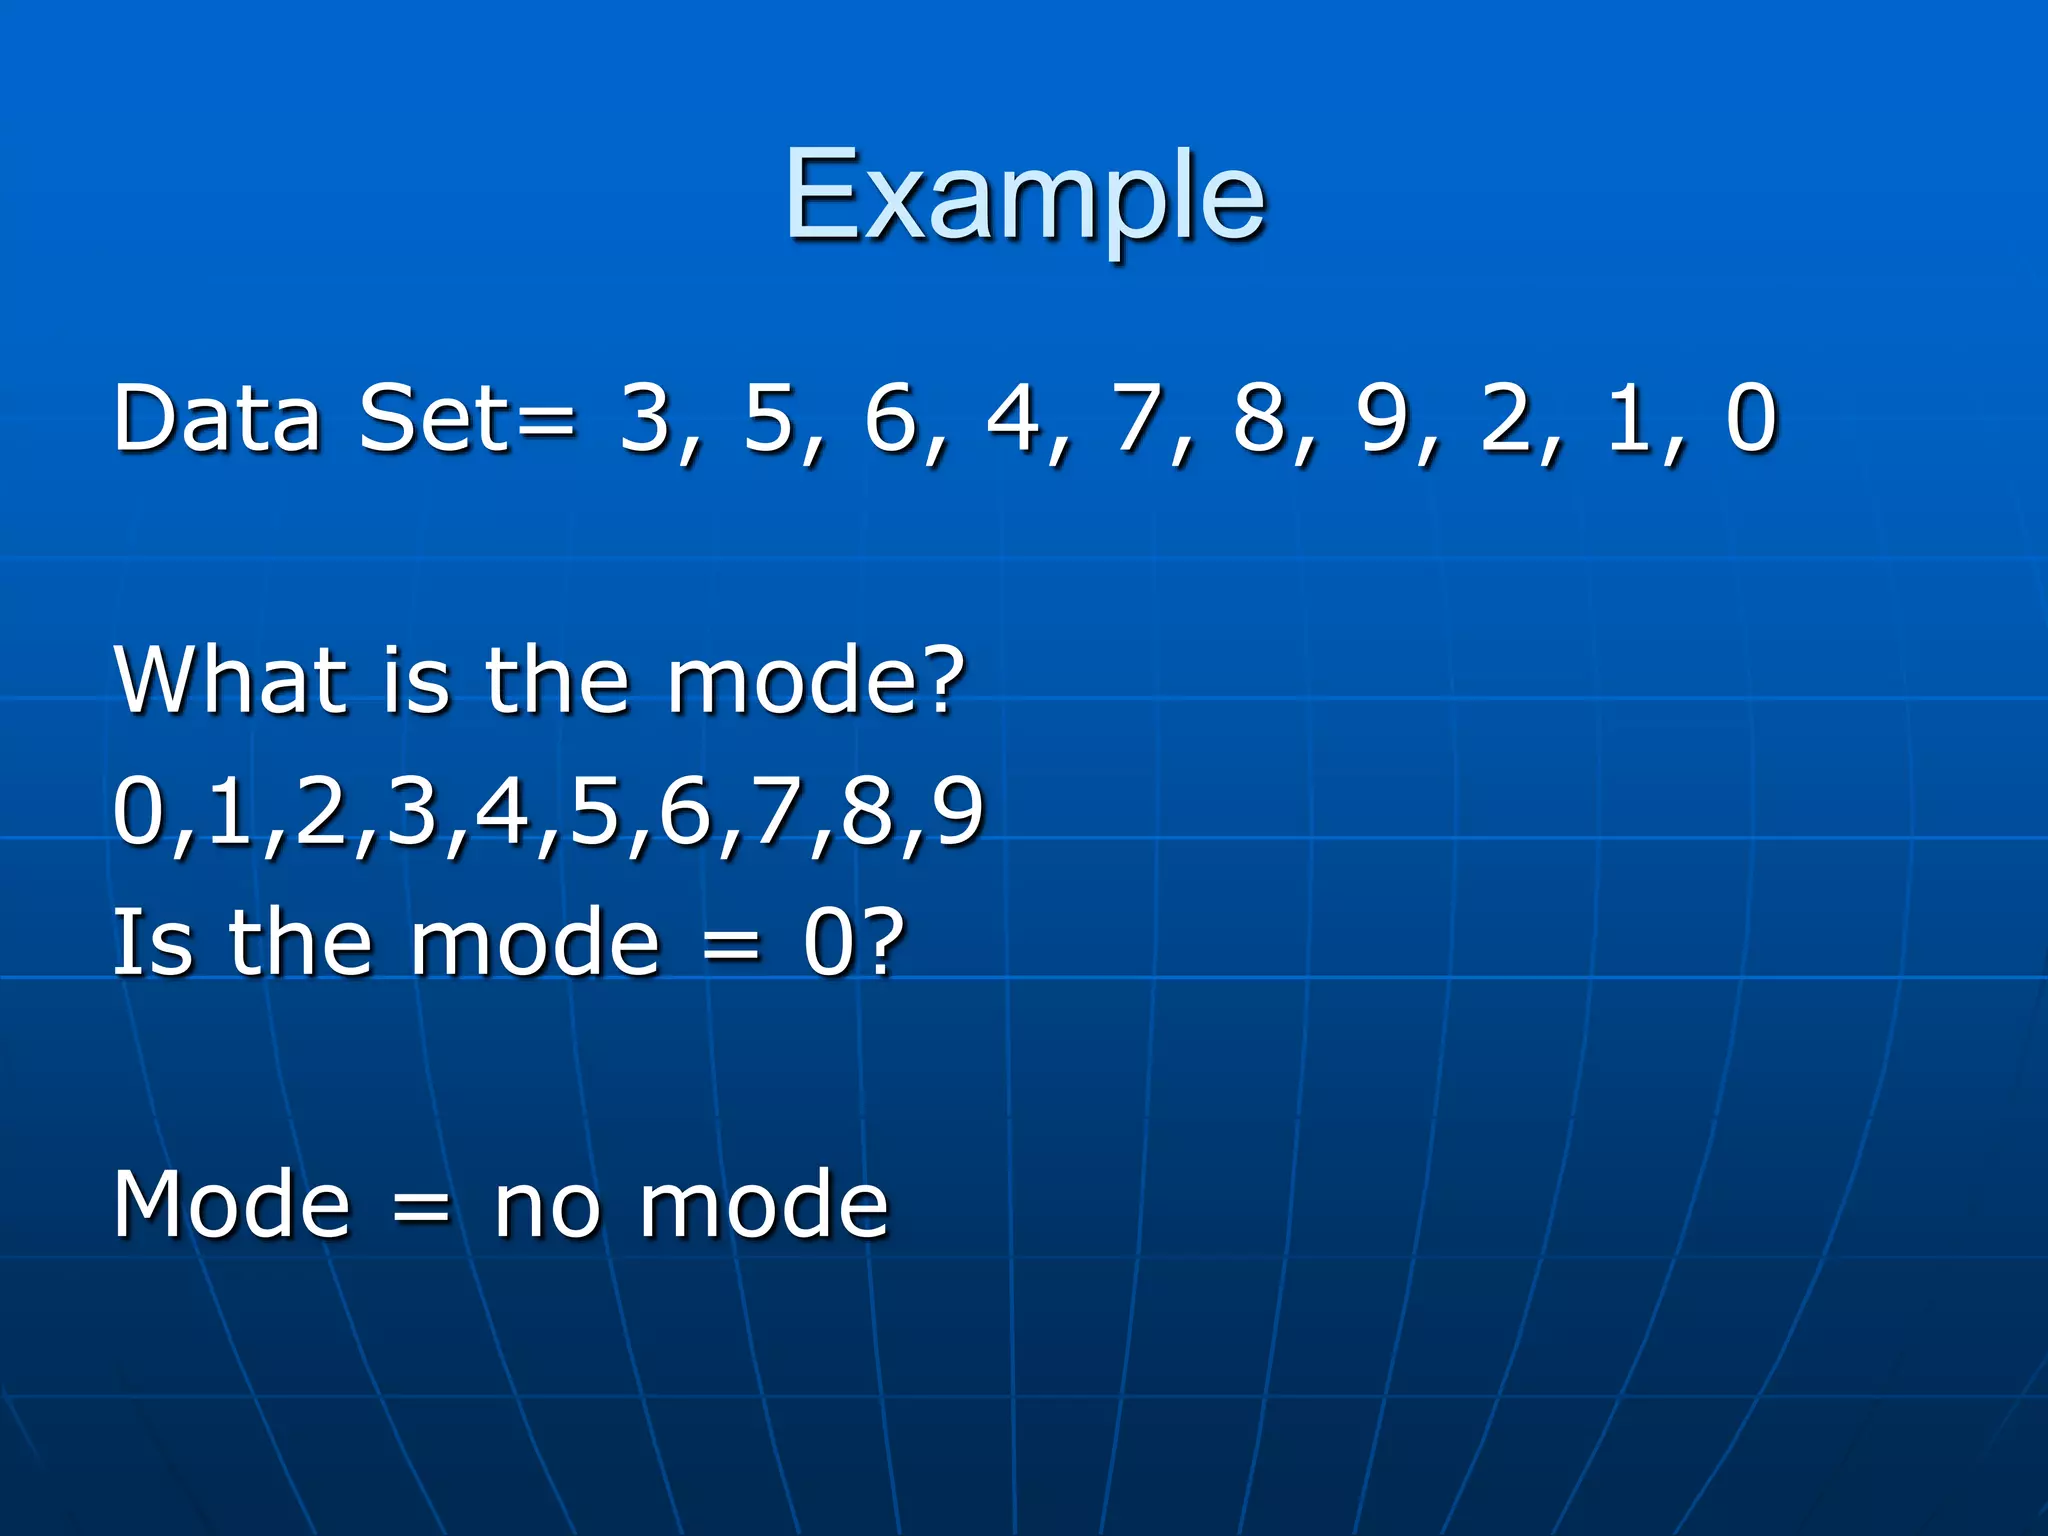
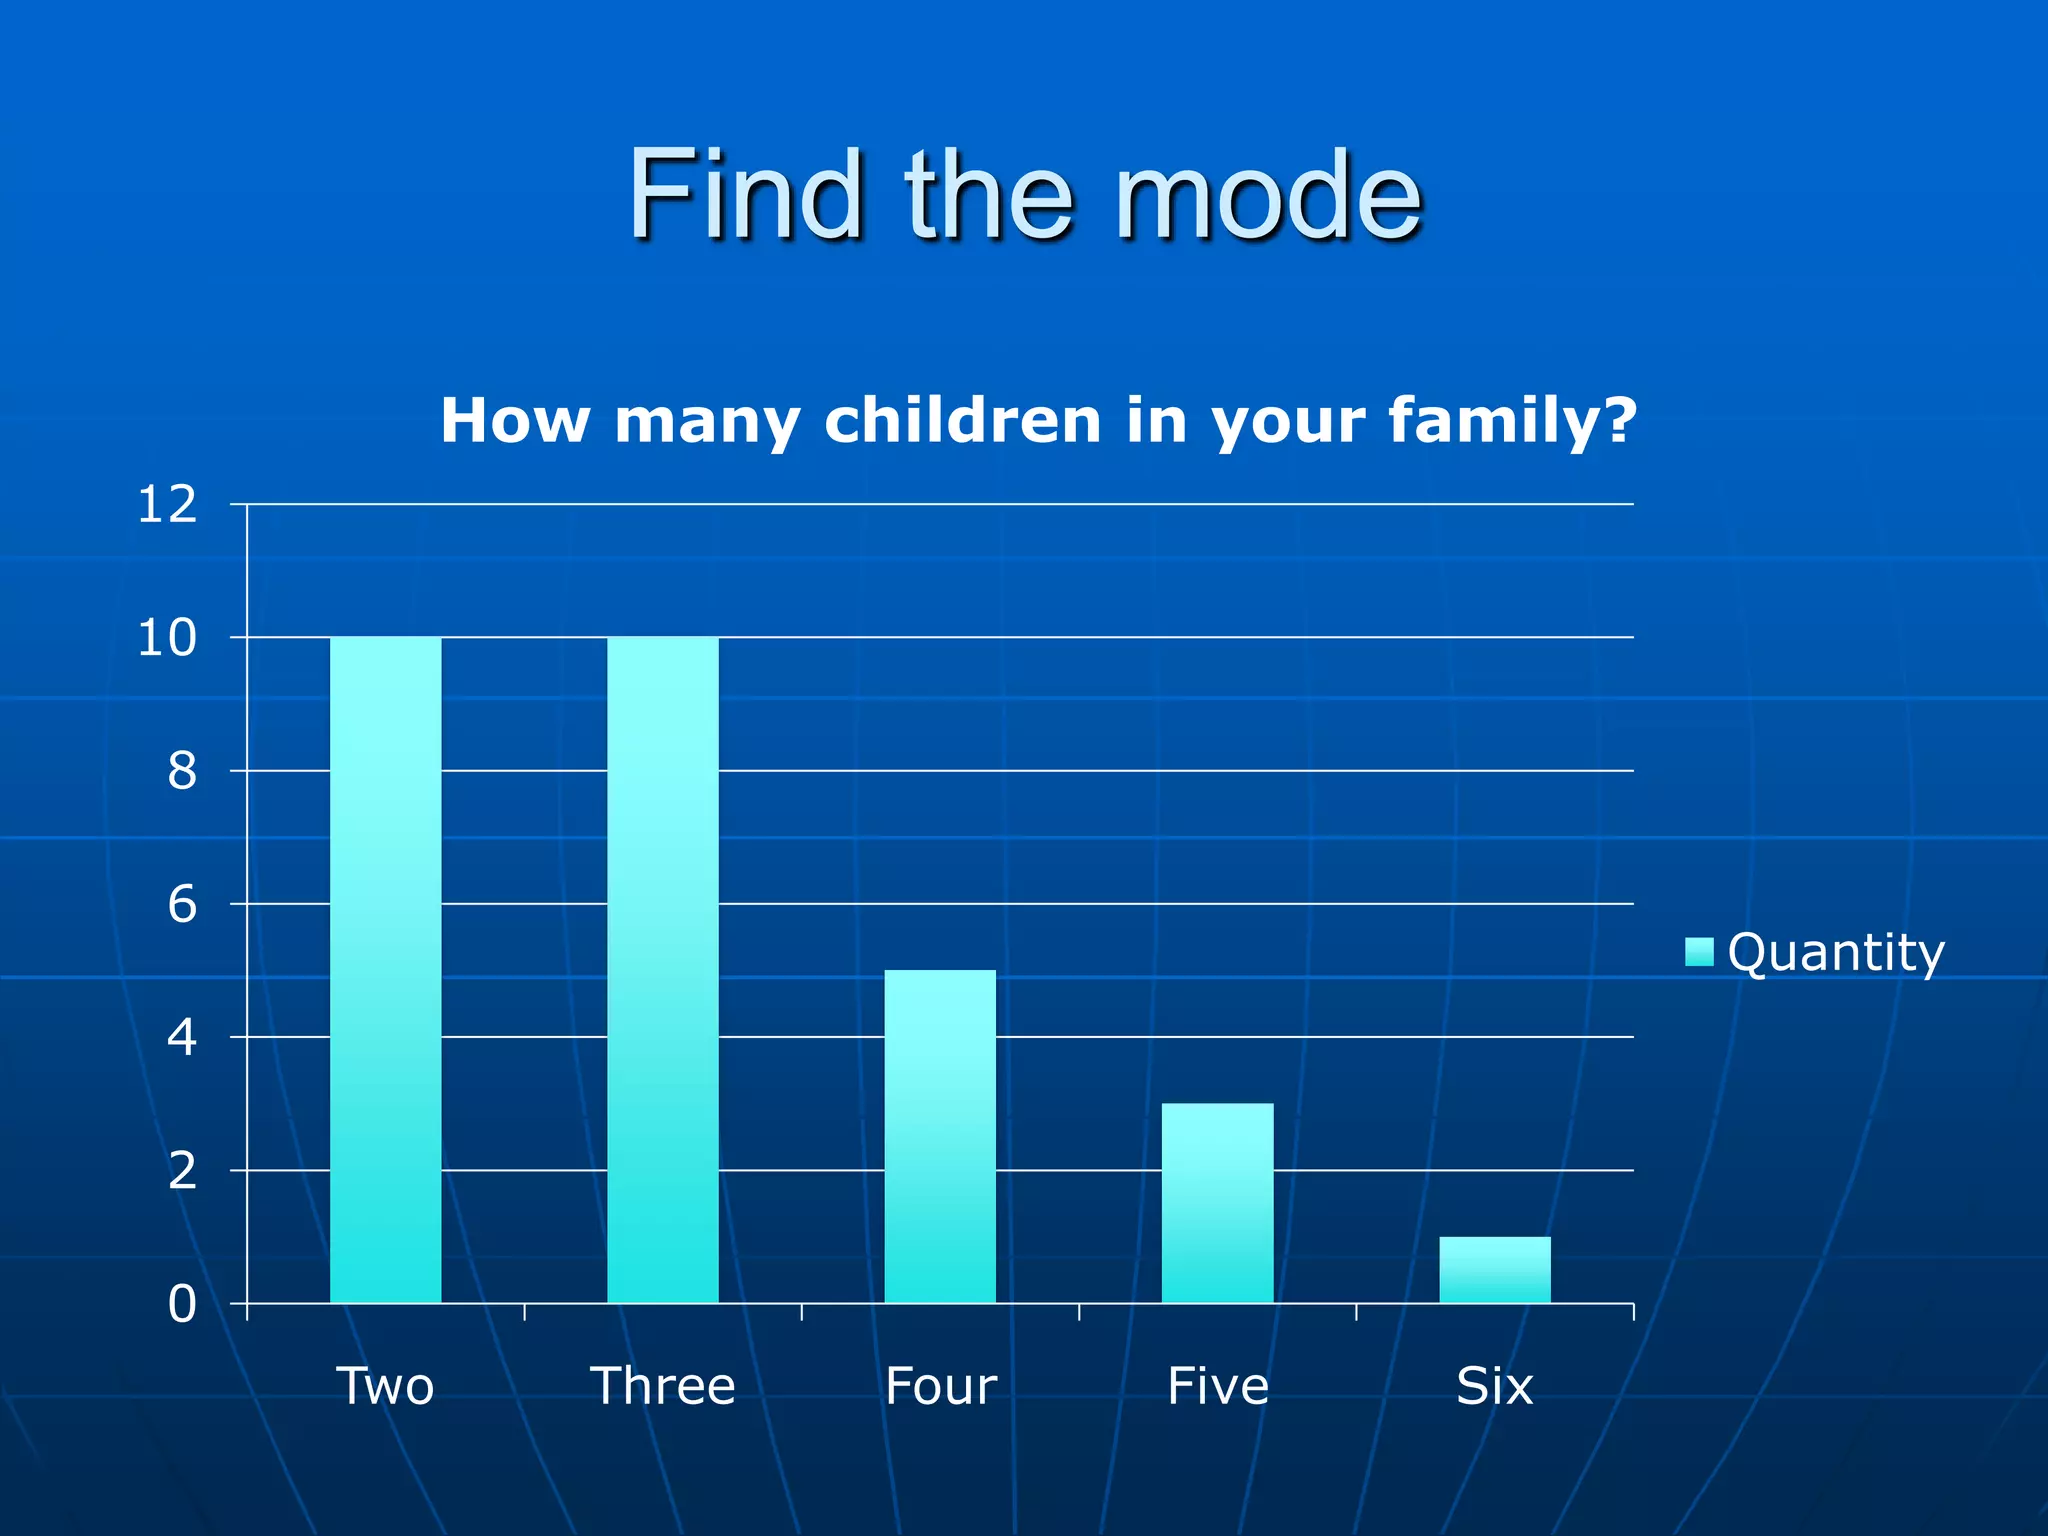
Focus on Mode: its definition, how to find it in numerical and non-numerical data, and examples including bimodal and trimodal data.
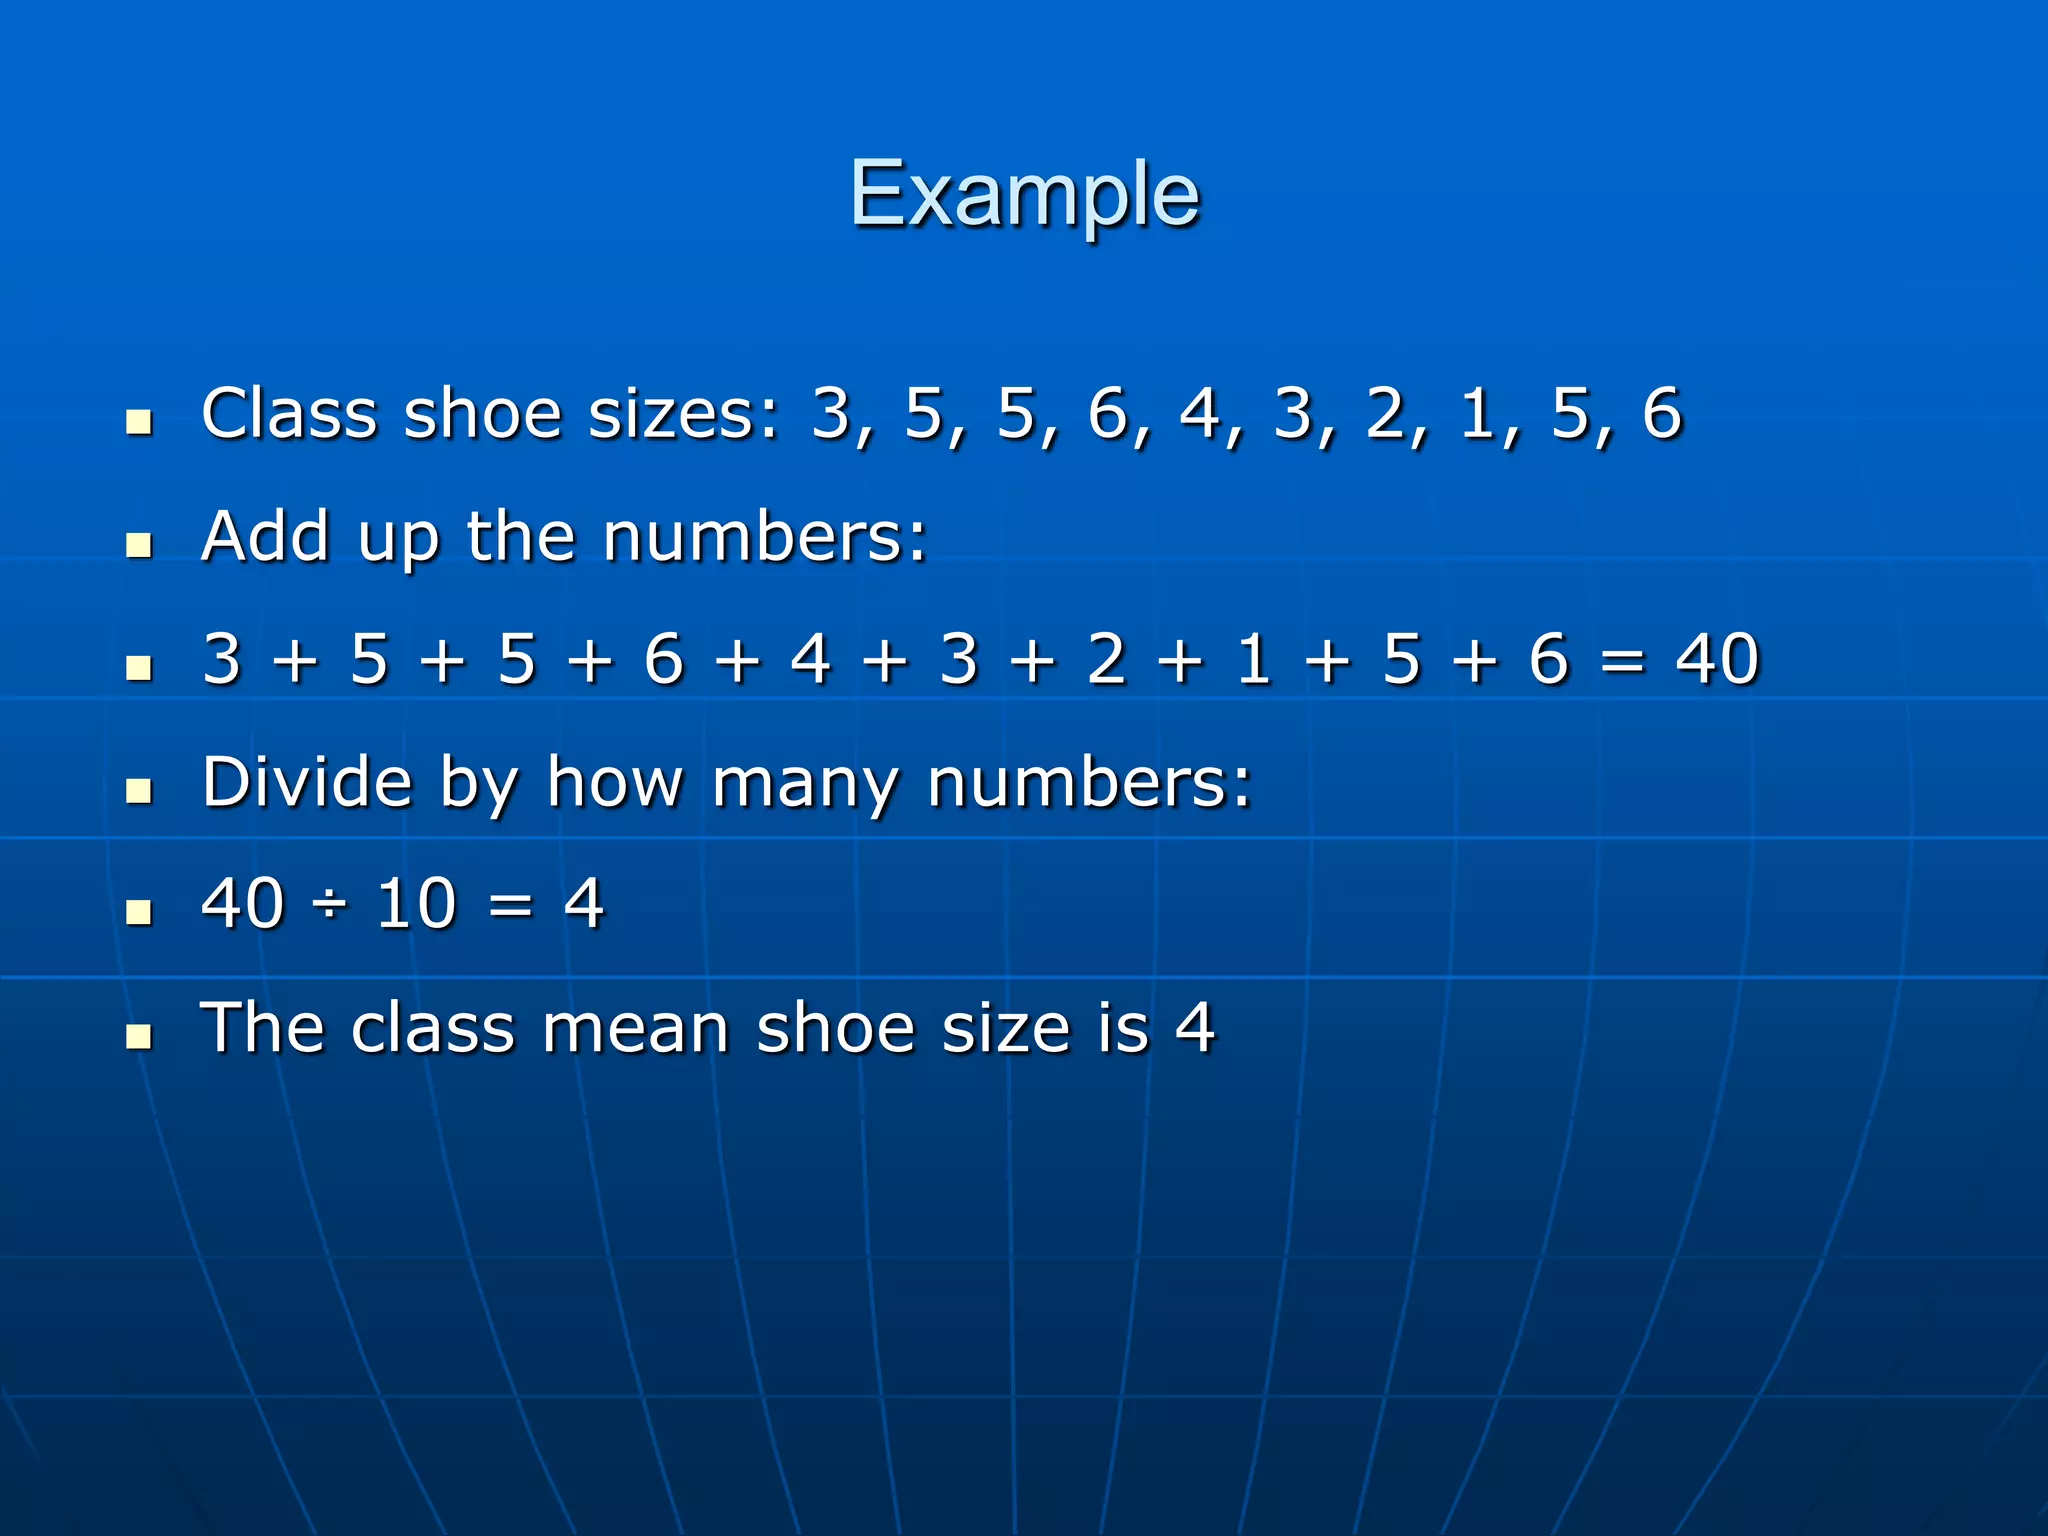
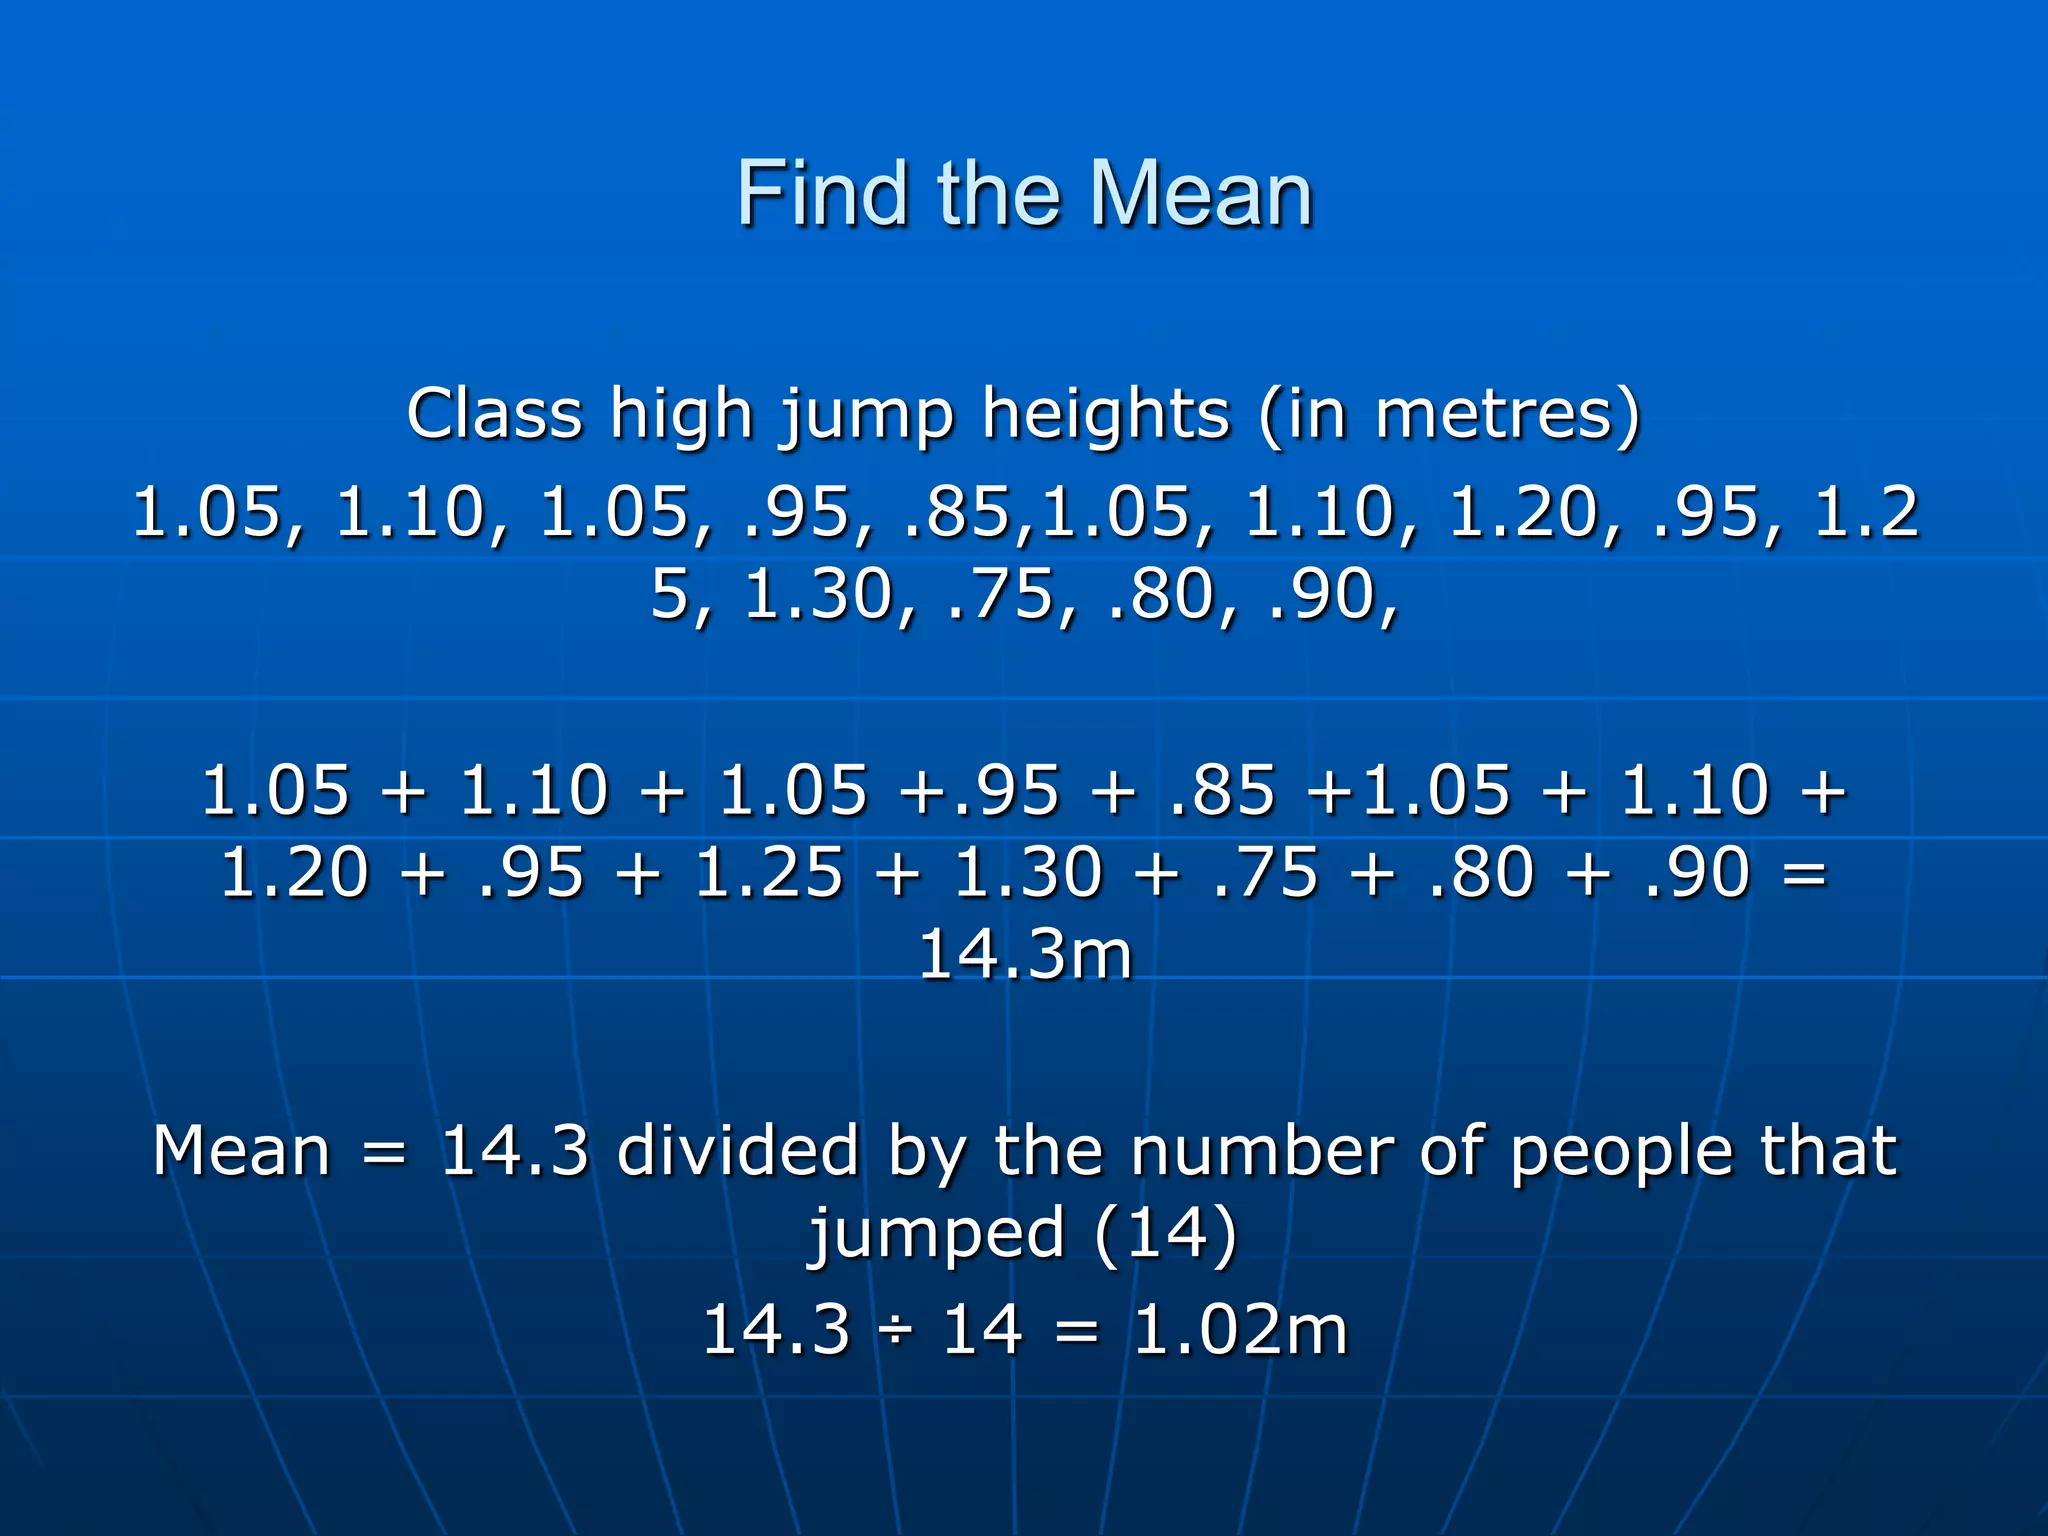
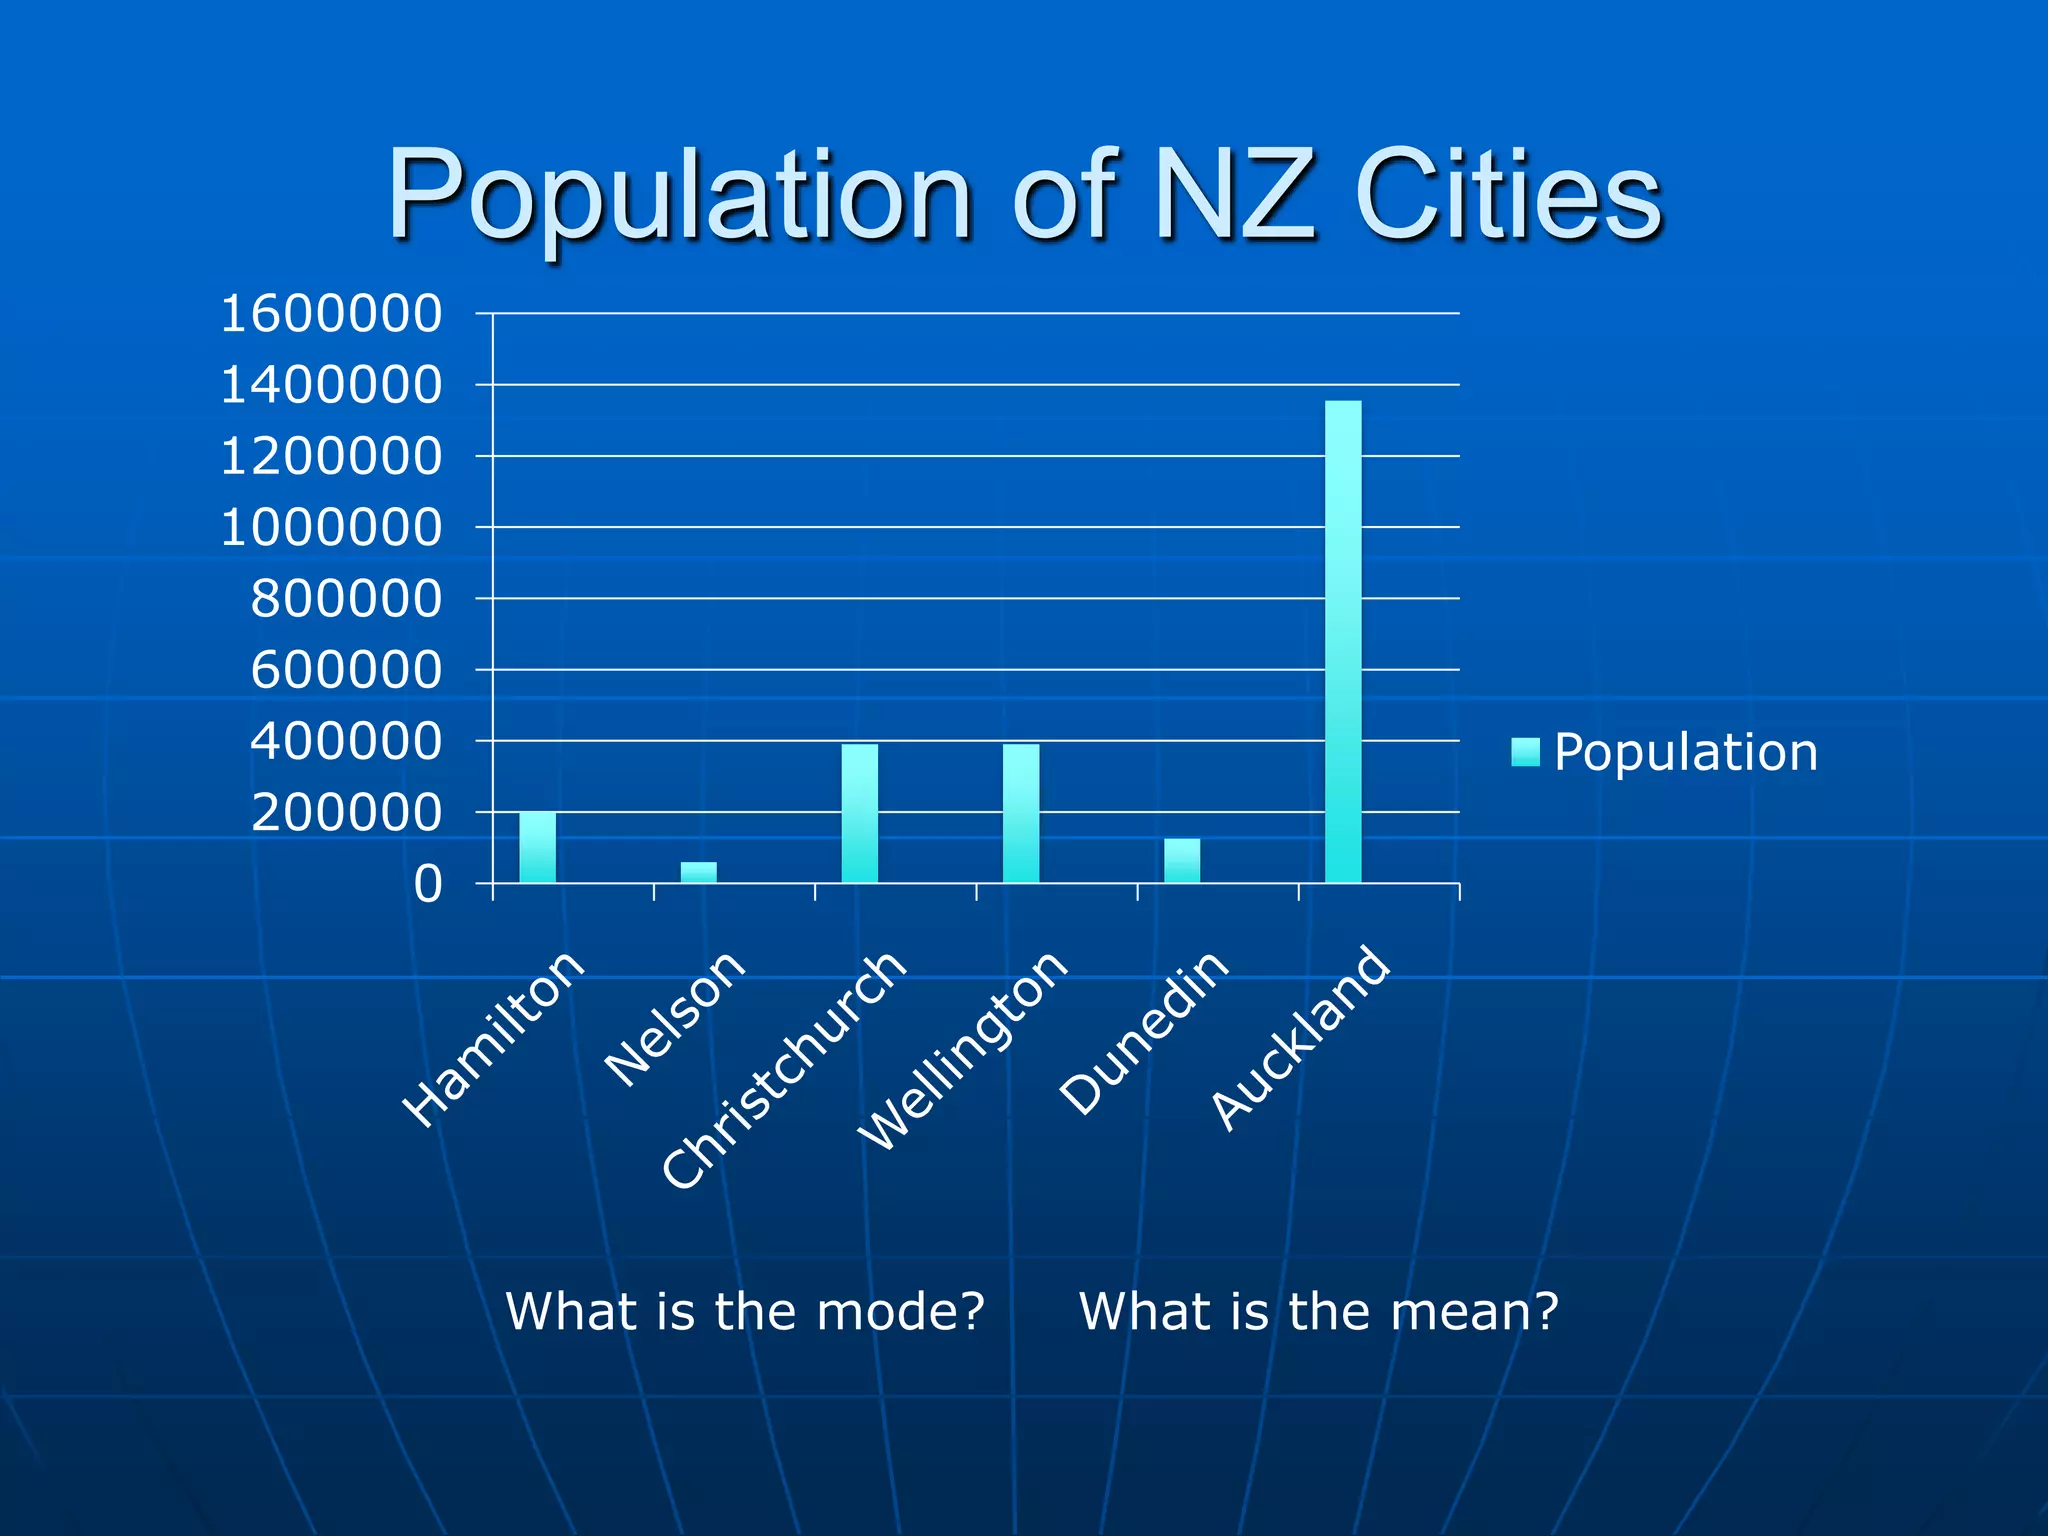
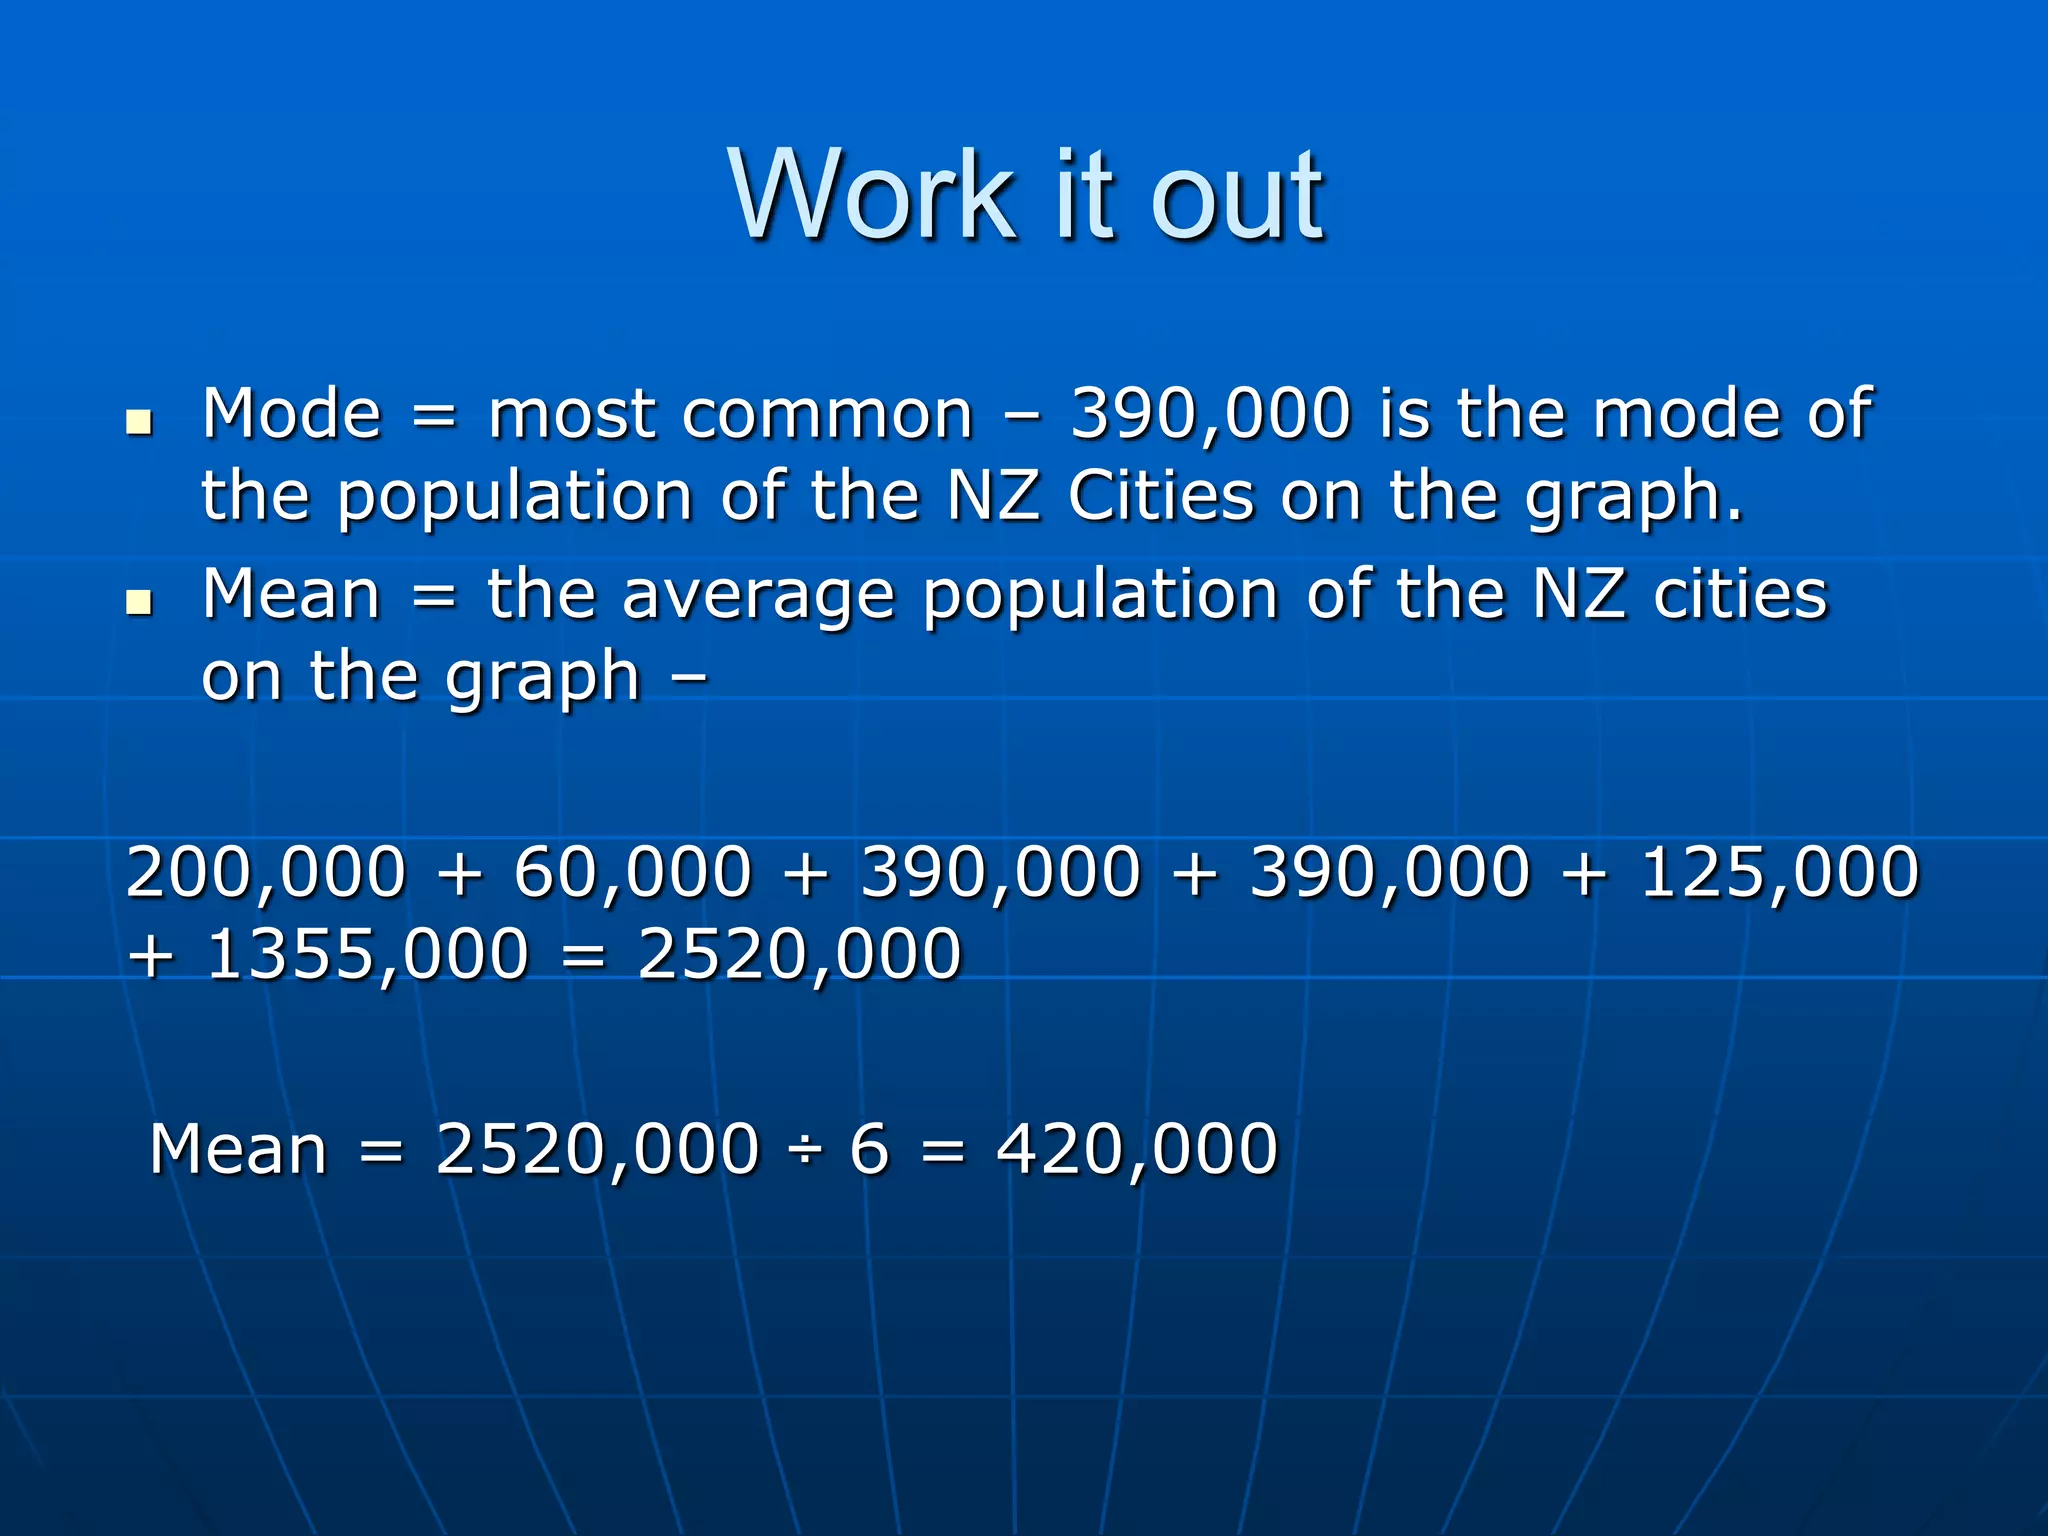
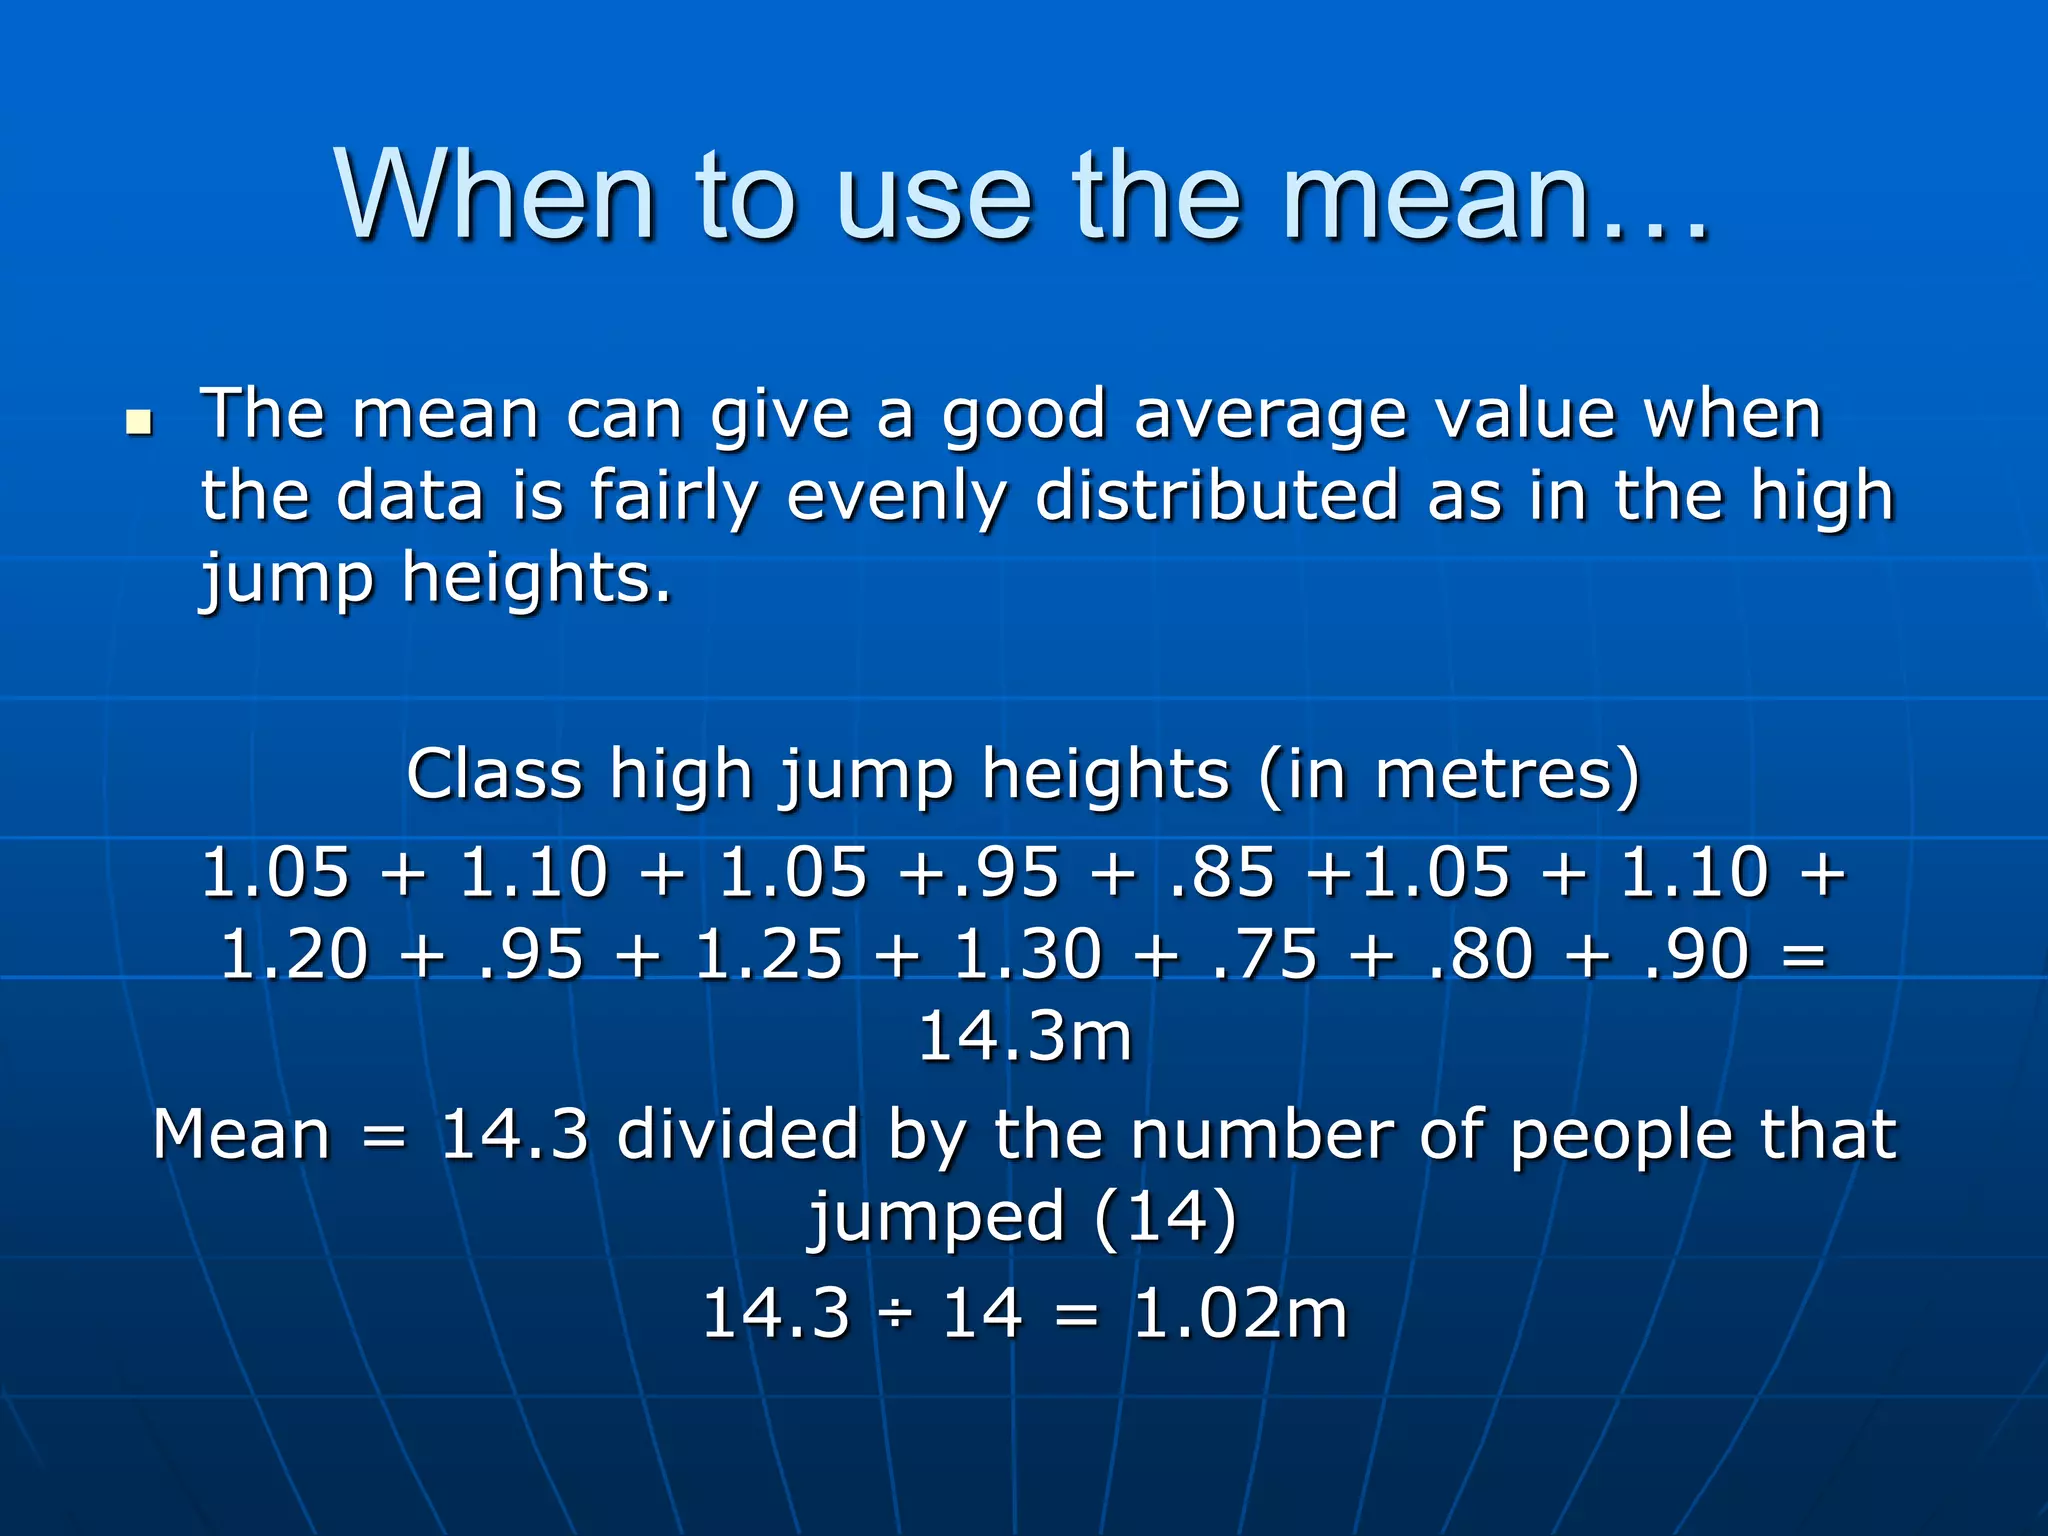
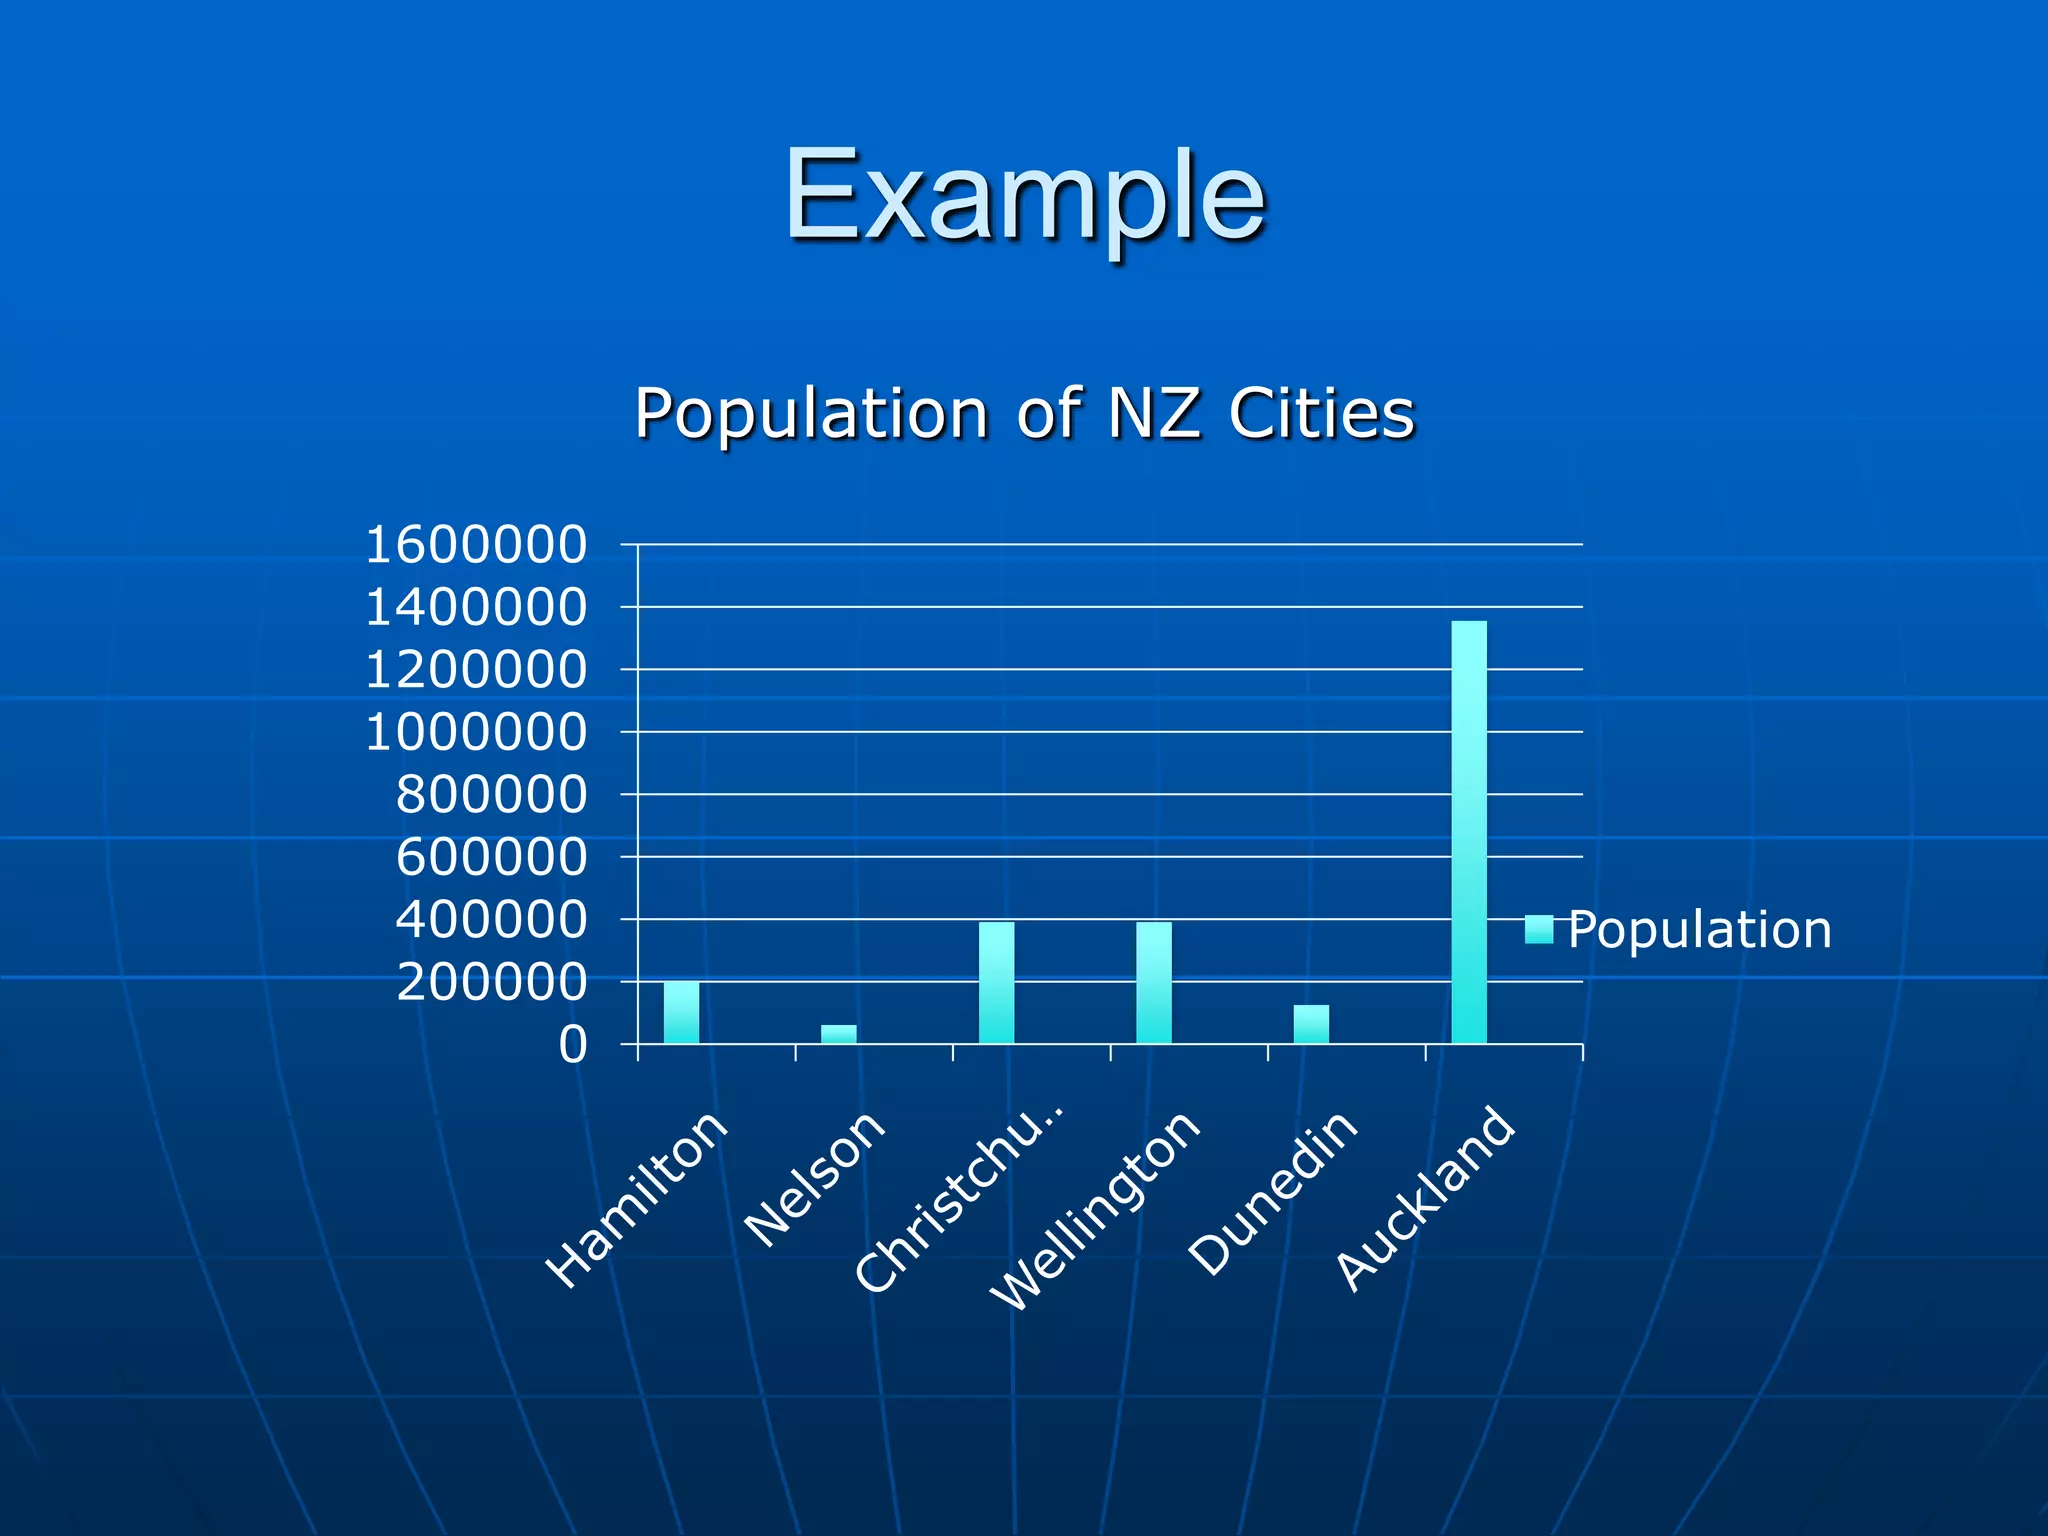
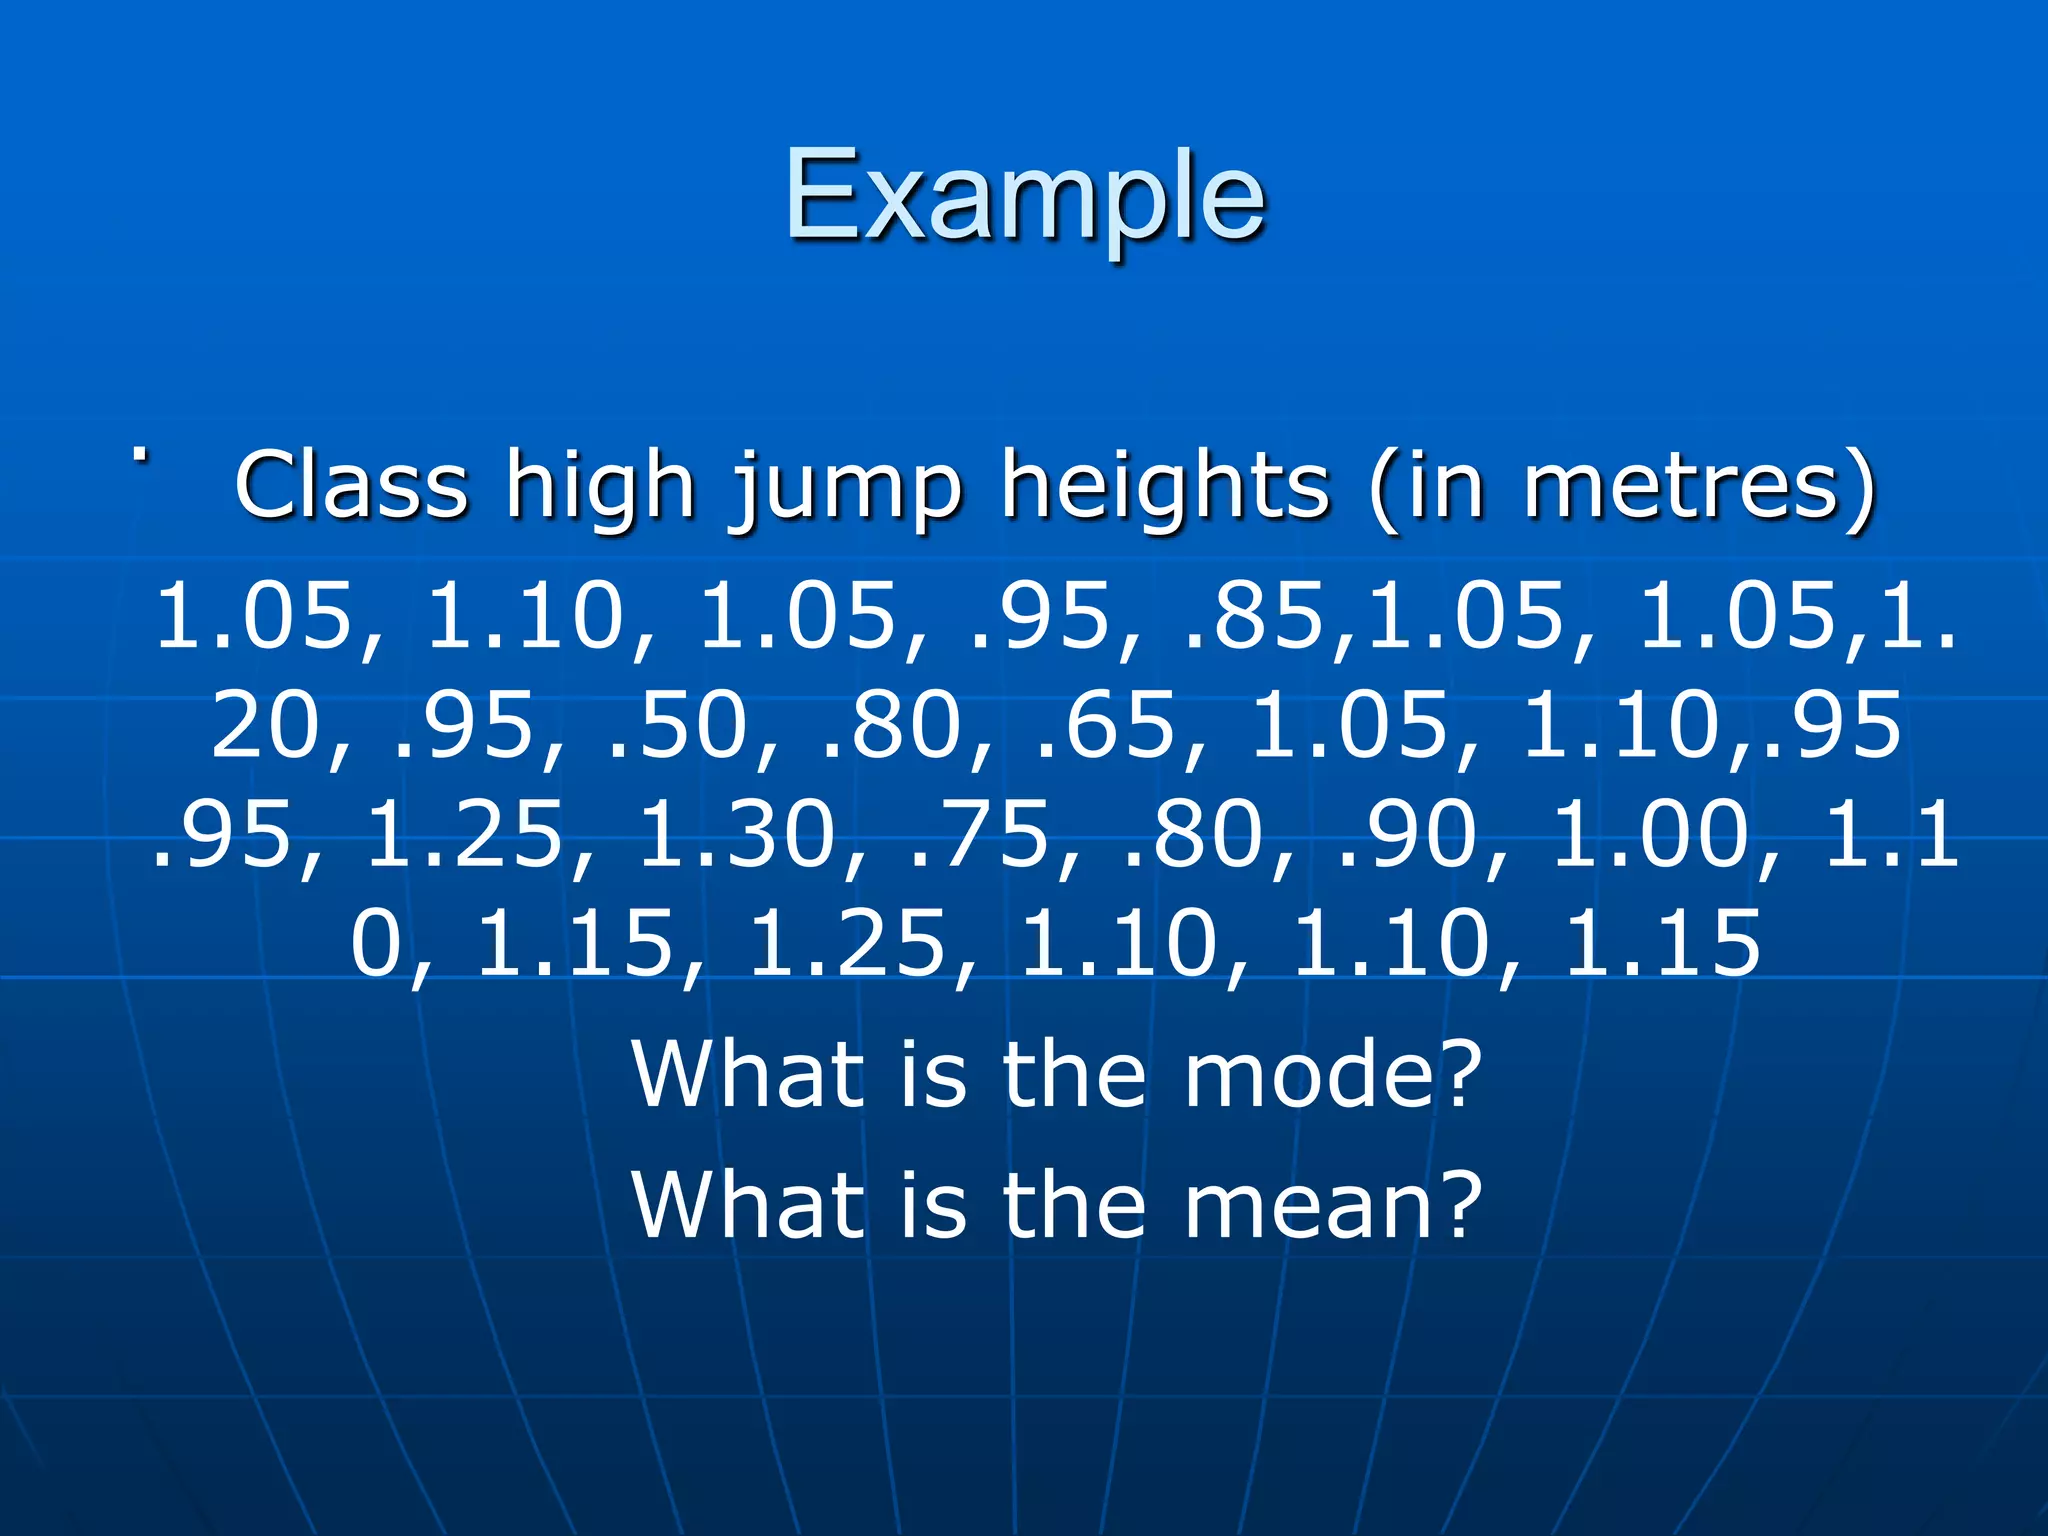
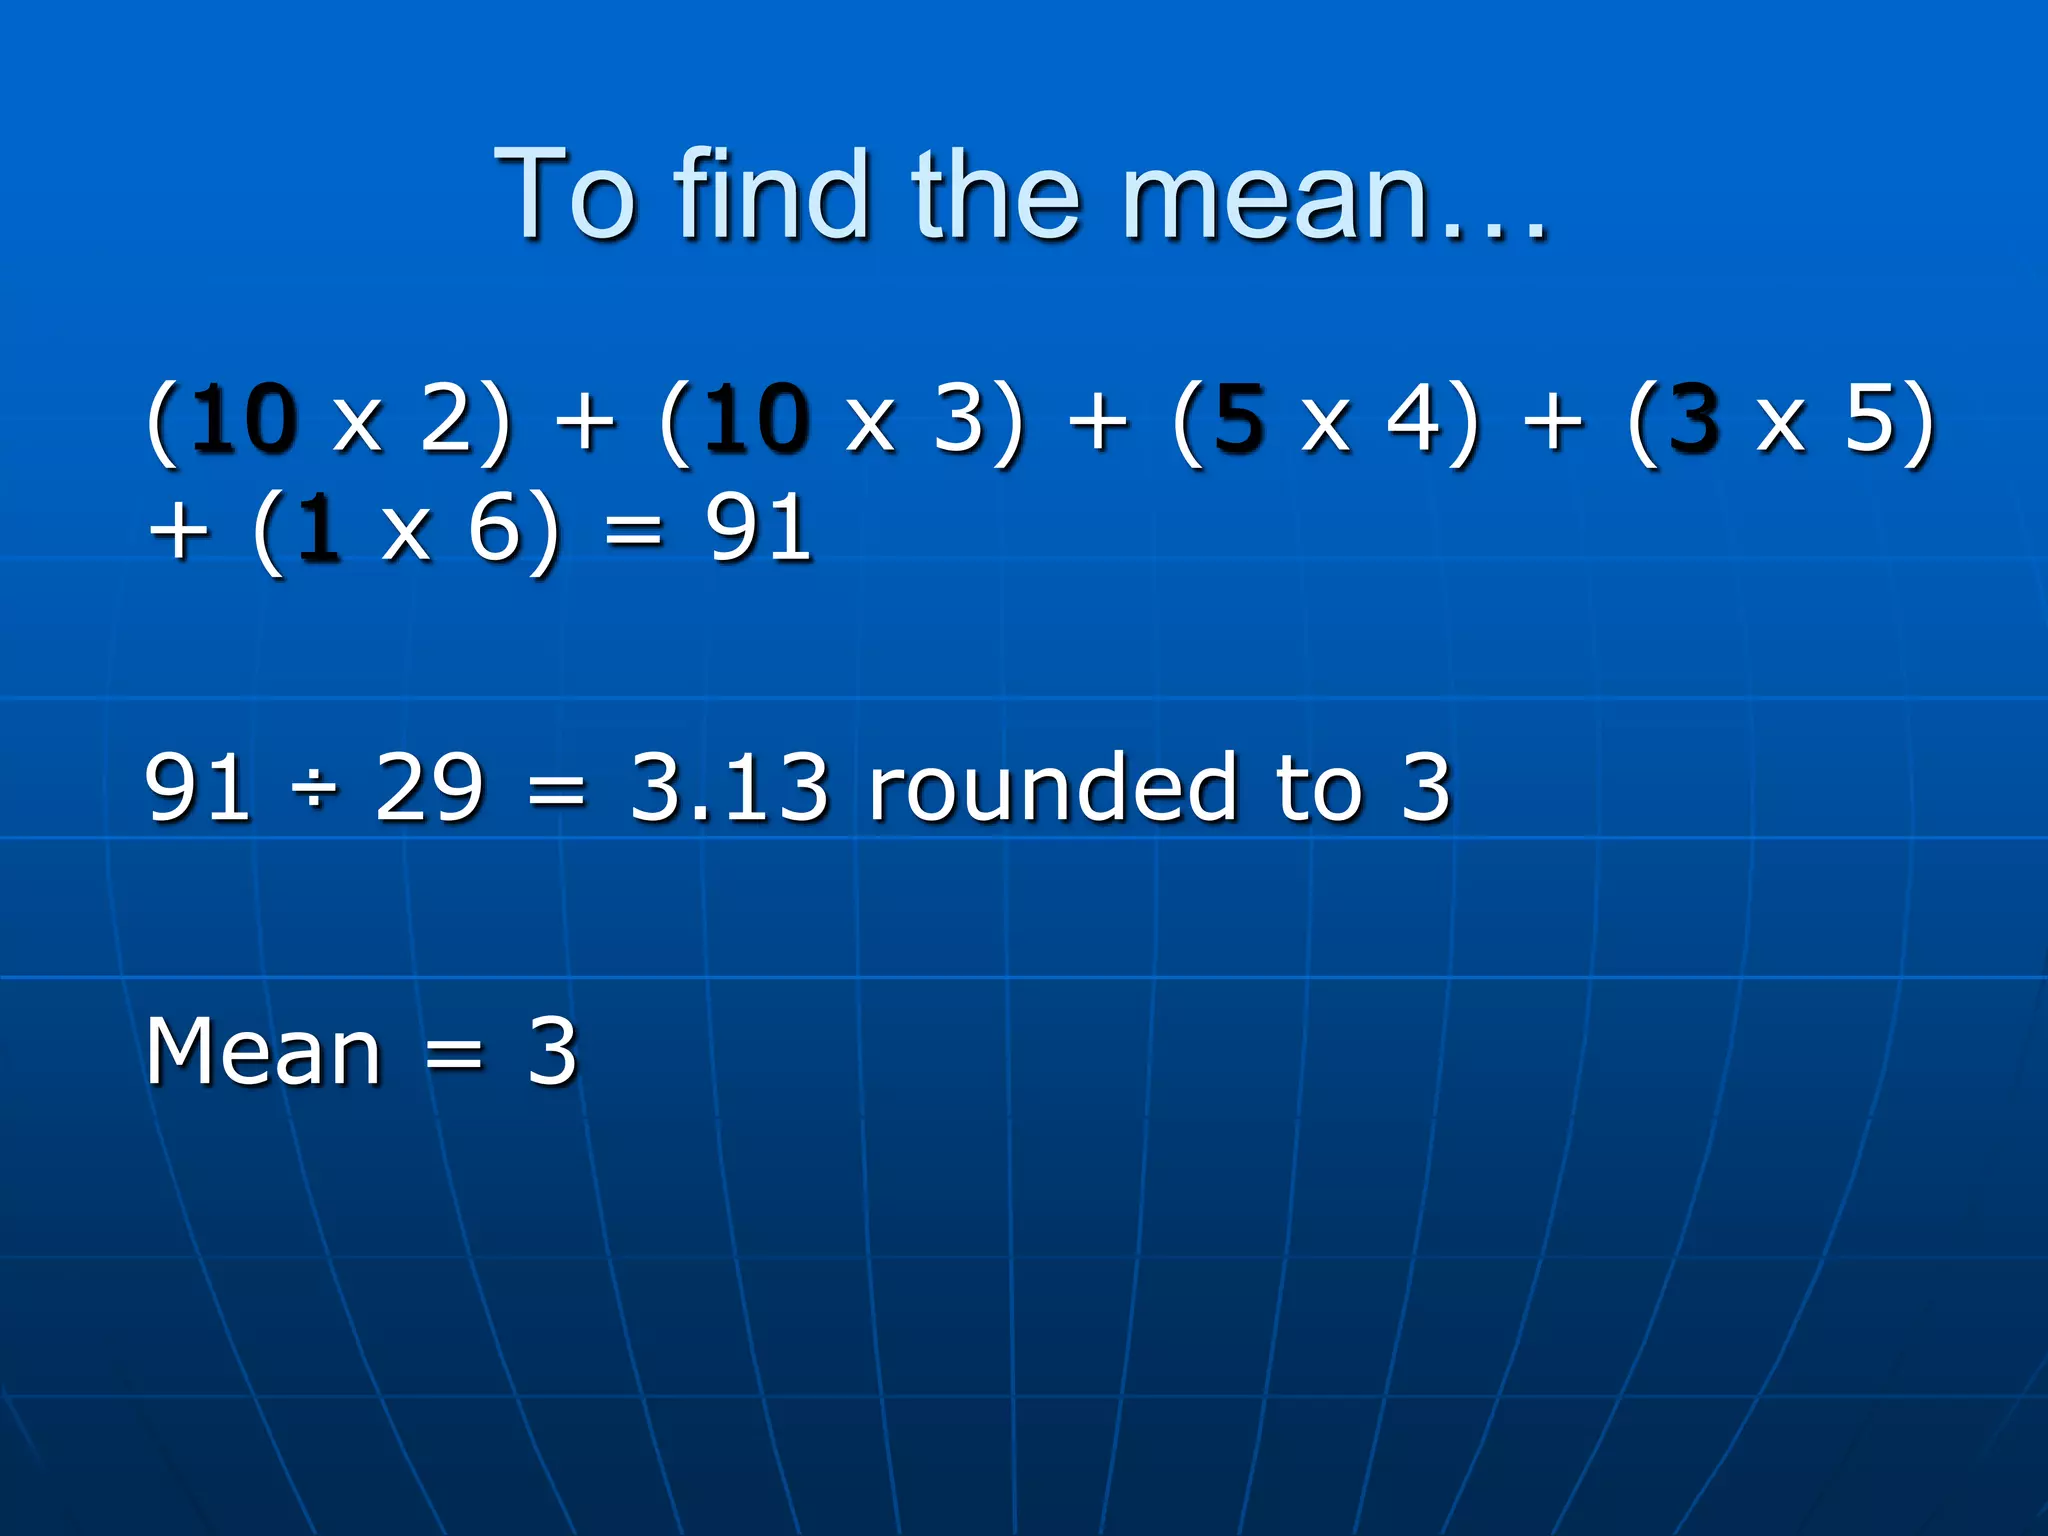
Introduction to Mean: definition, calculation examples, significance, when its use is appropriate, and a specific example from NZ city populations.
Recap of definitions for Mode and Mean highlighting their importance in summarizing data.
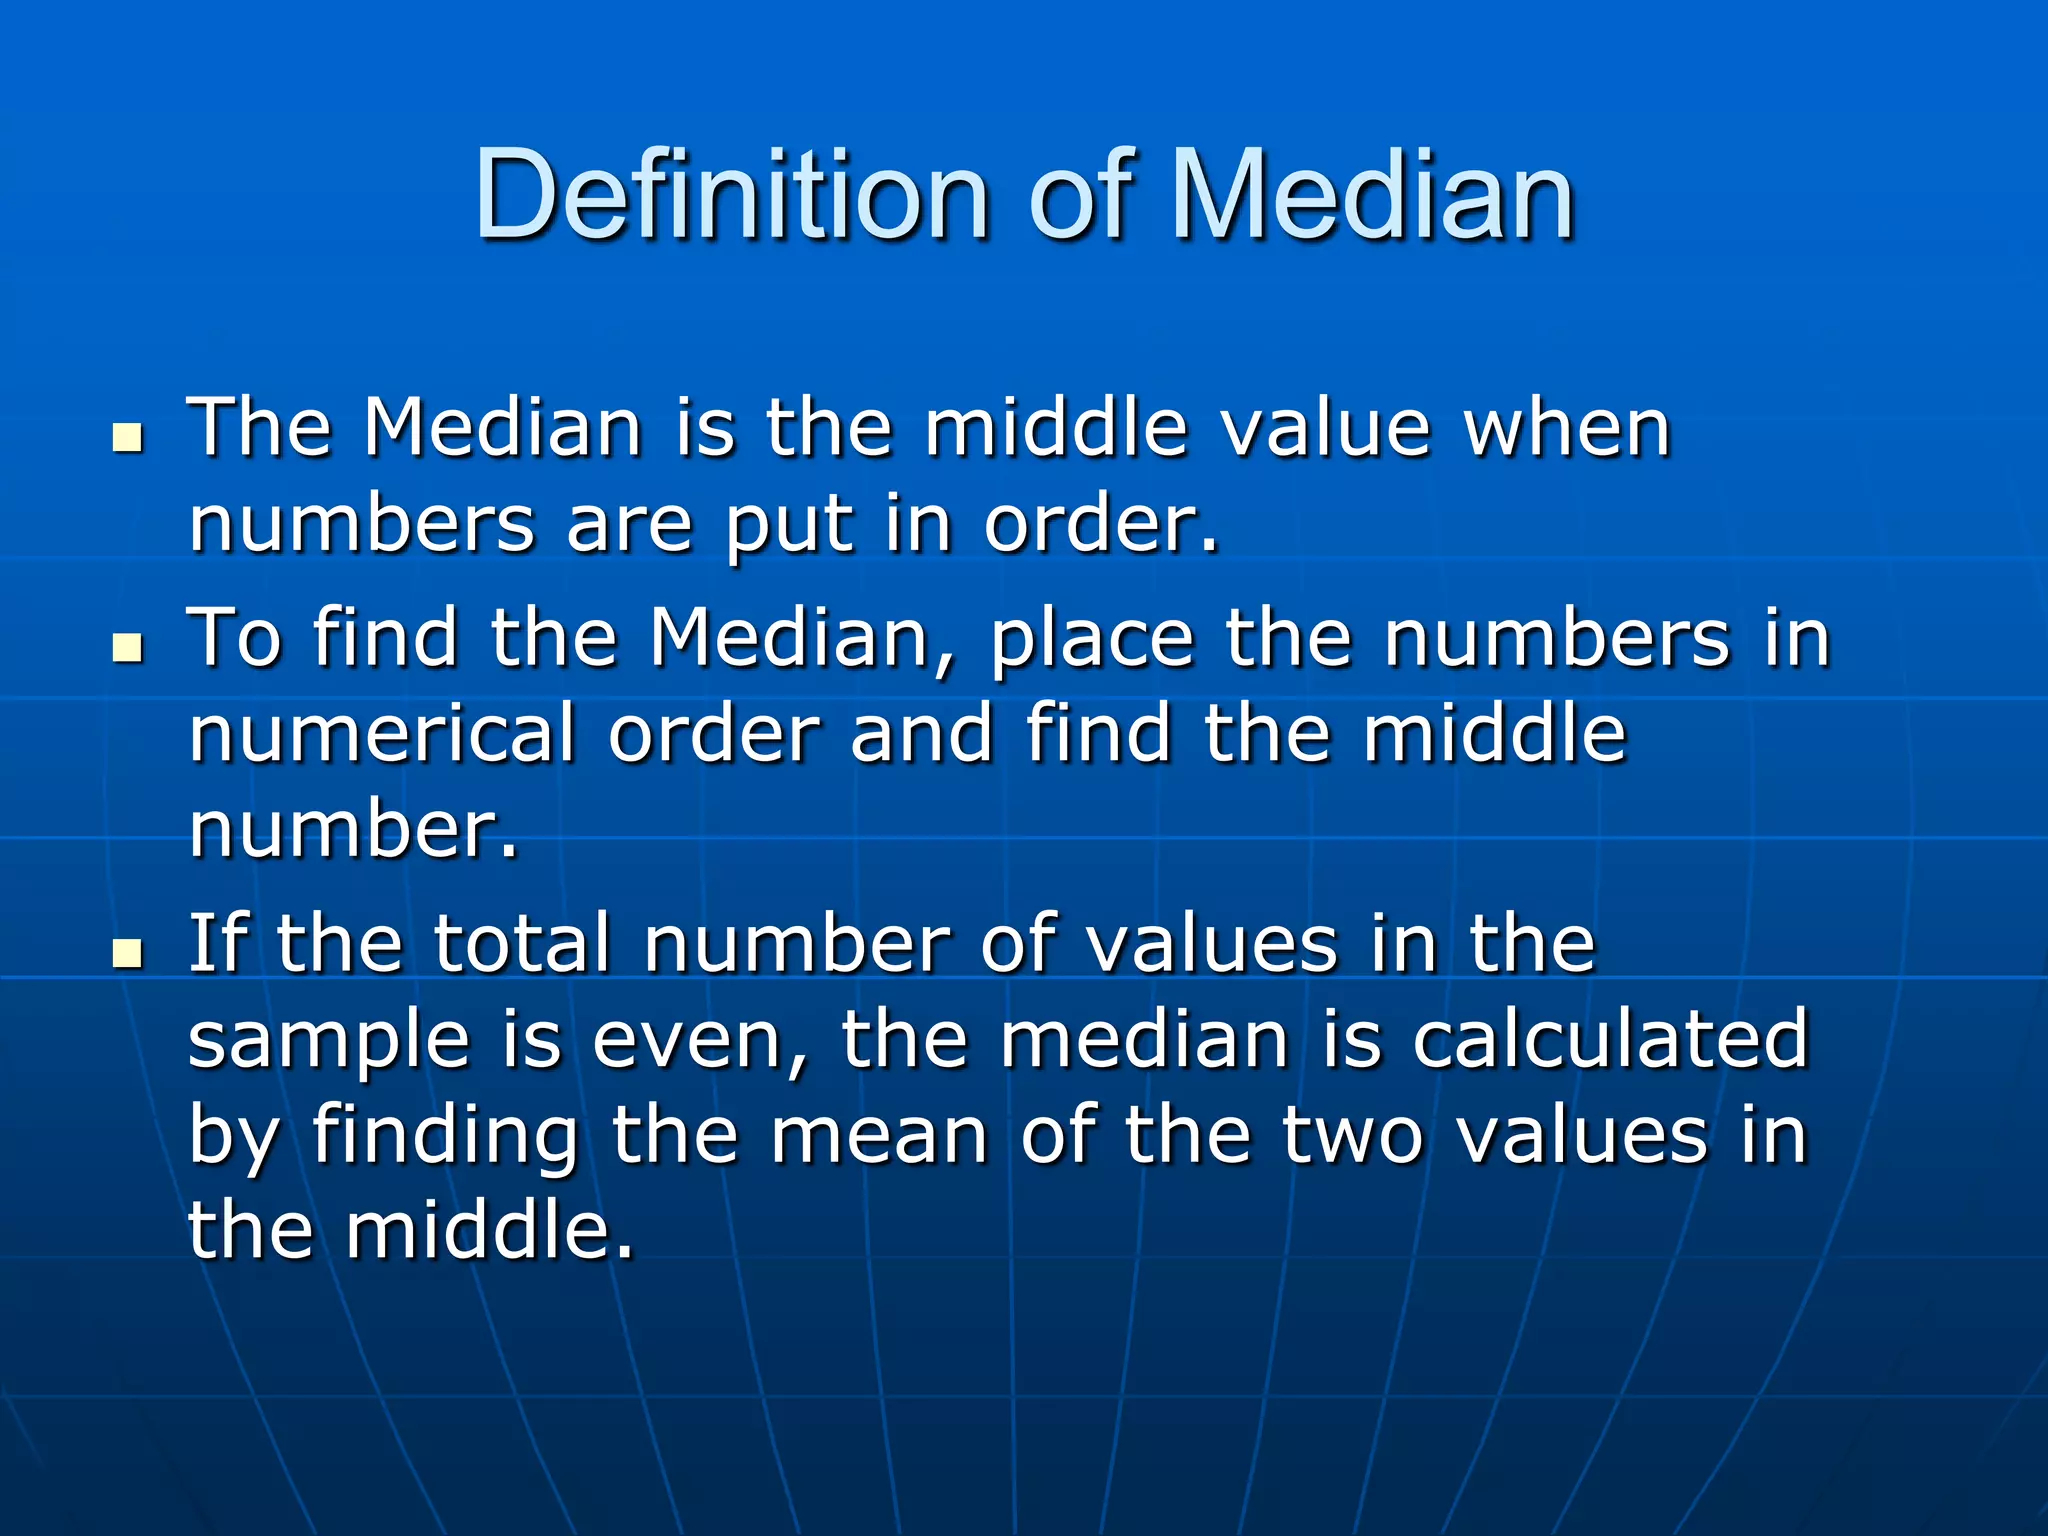
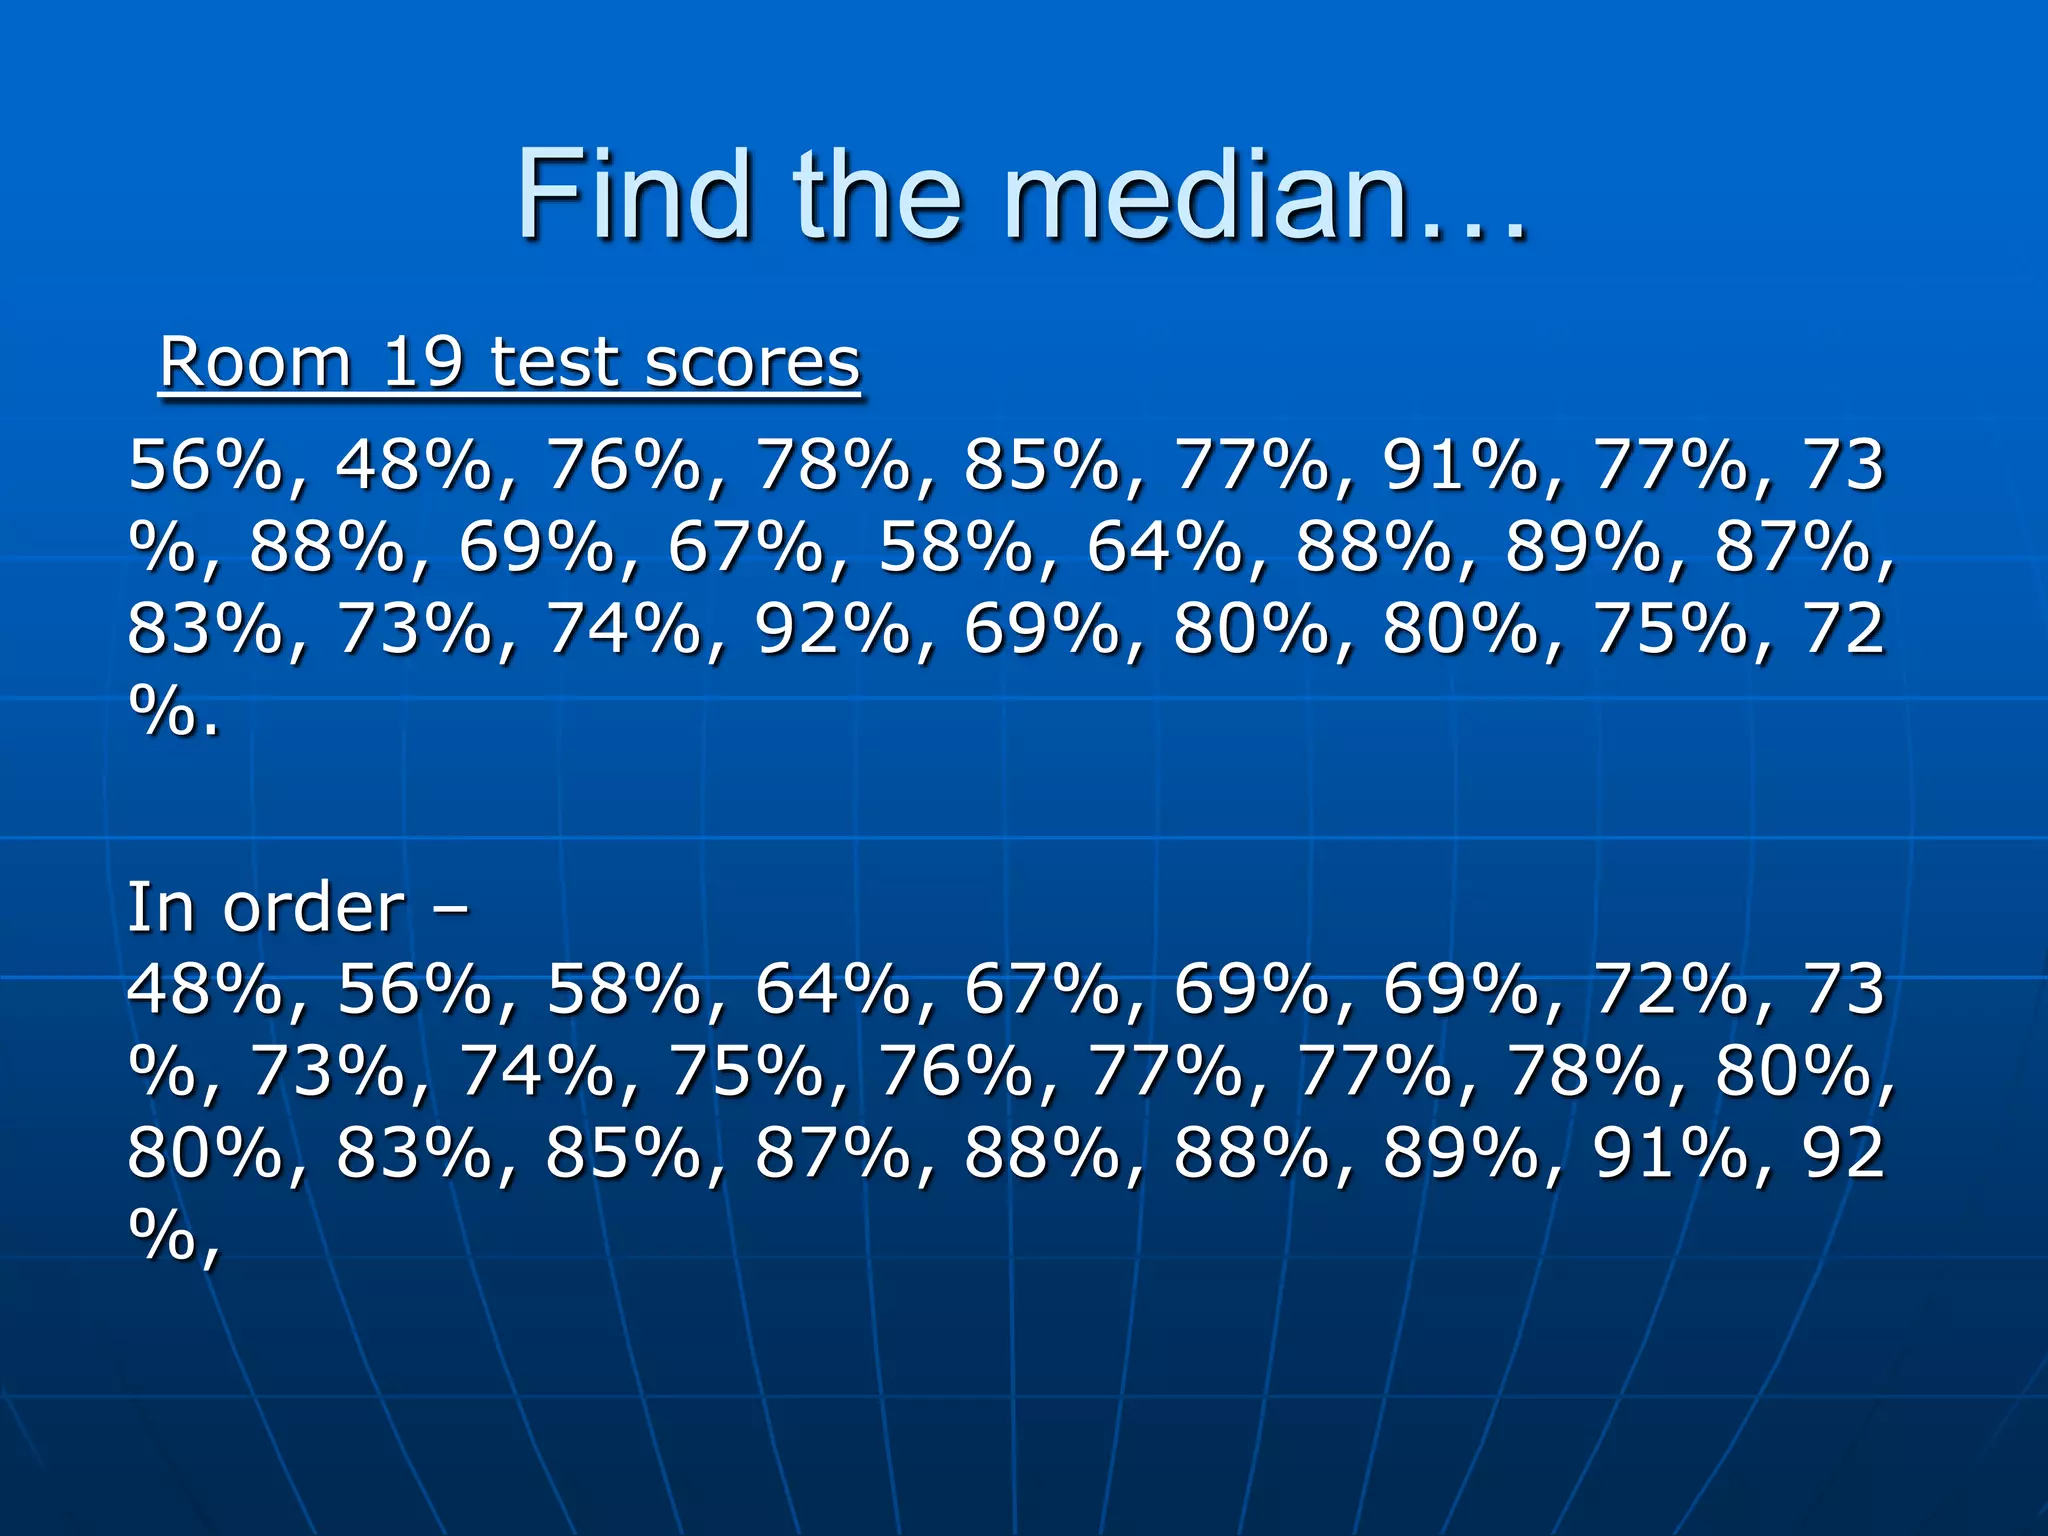
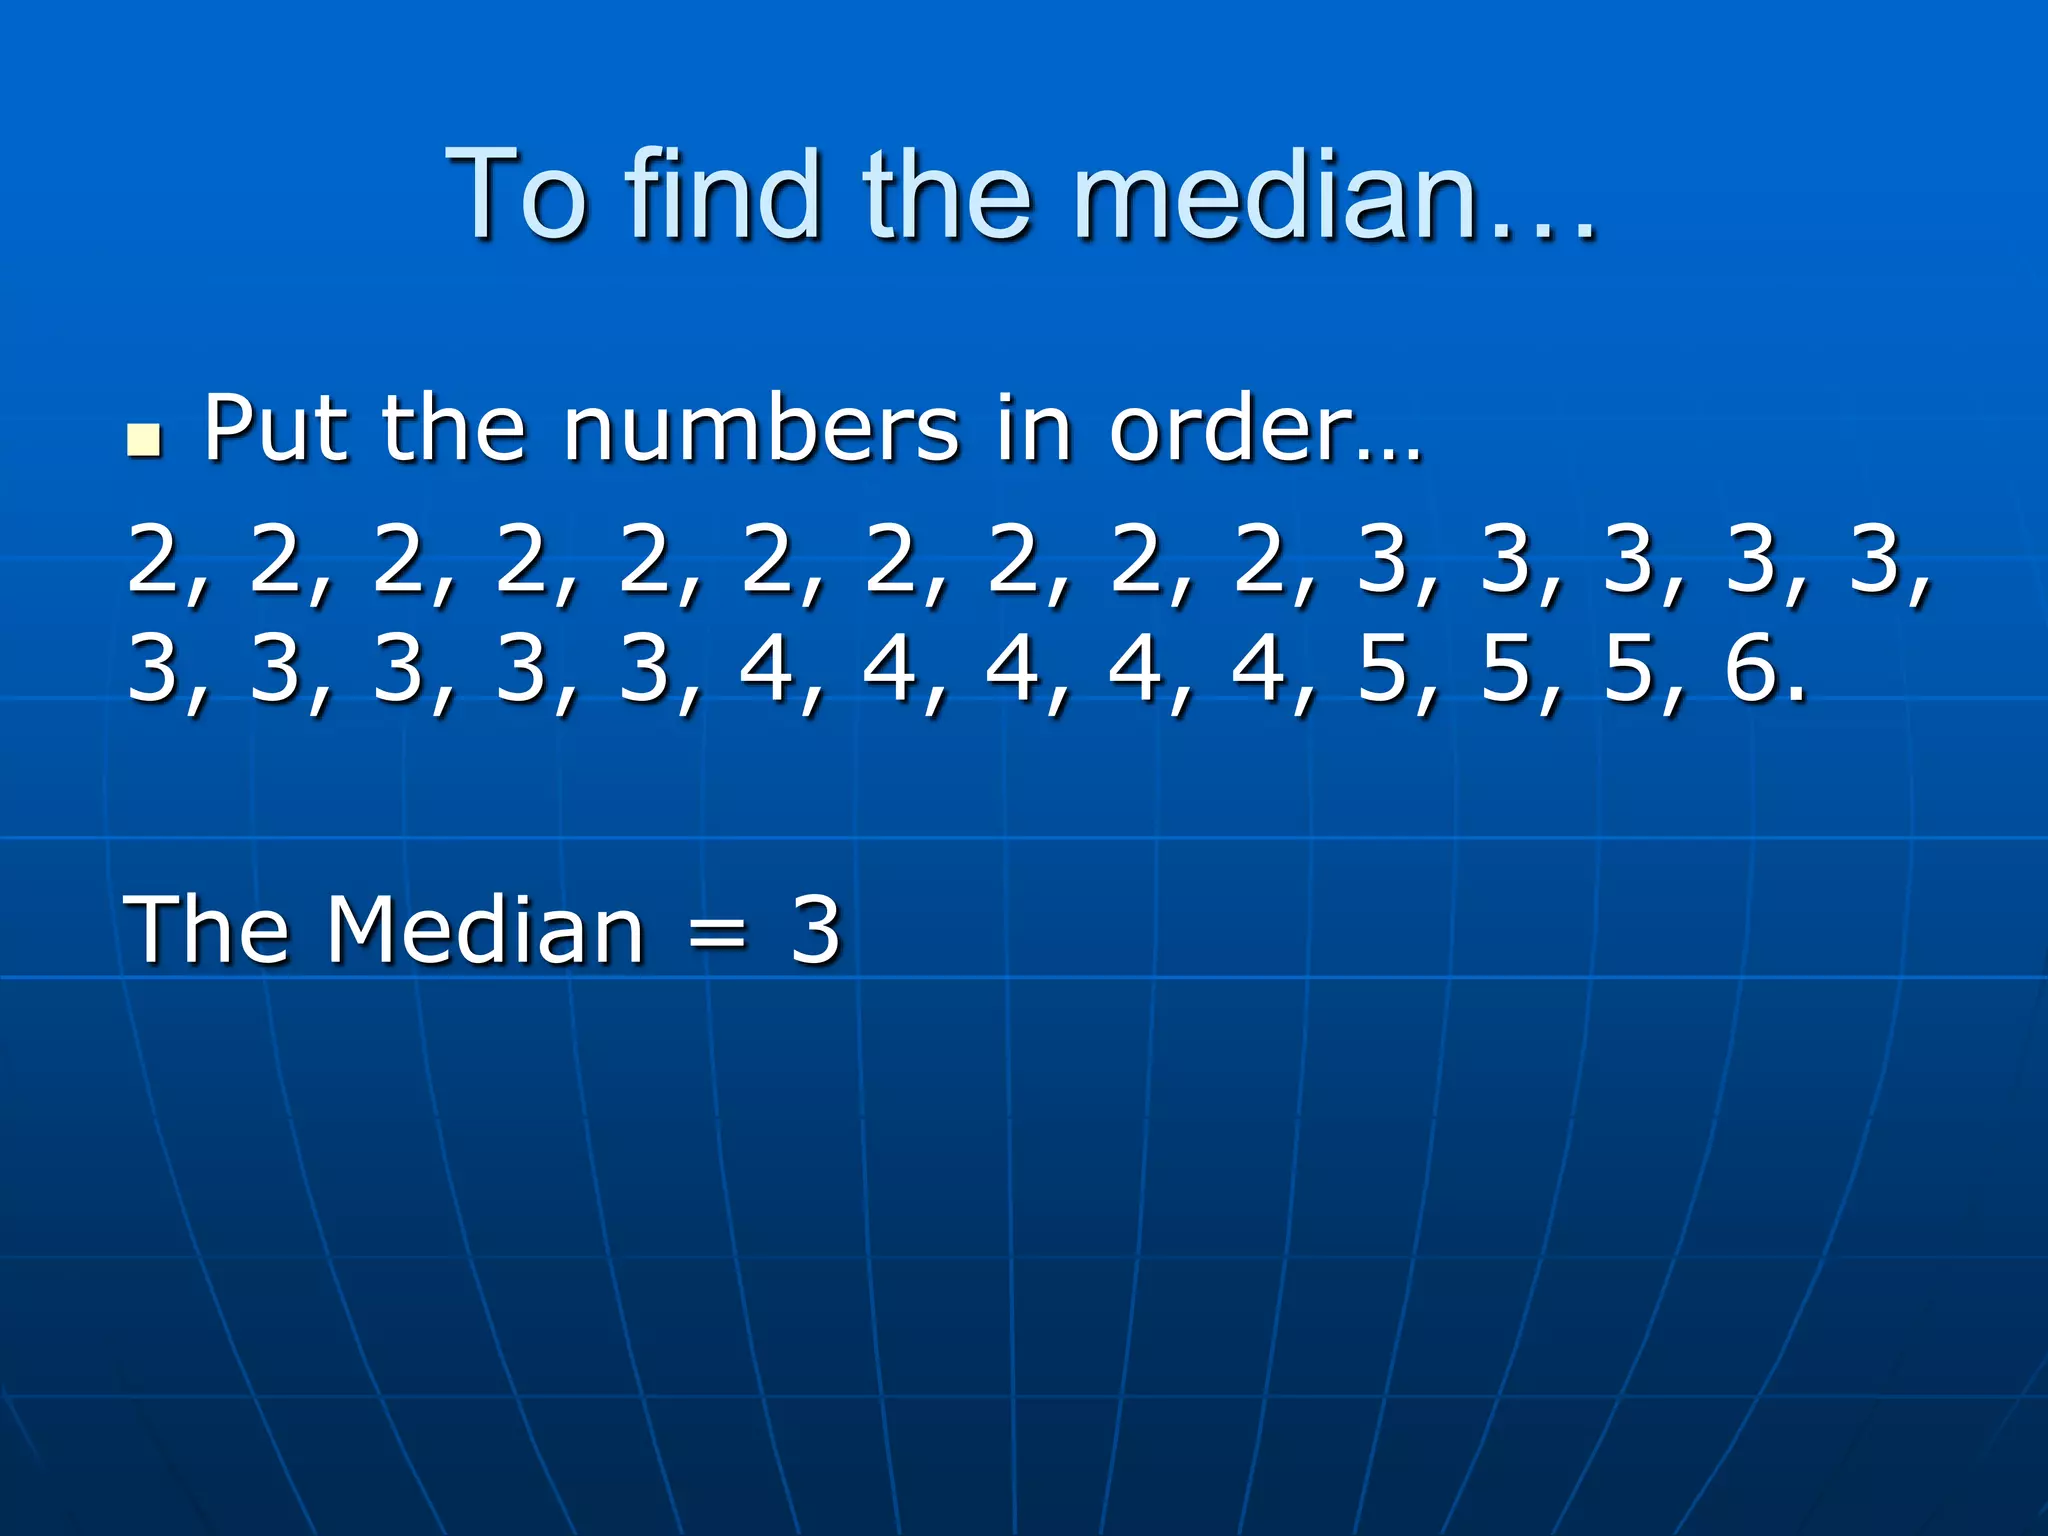
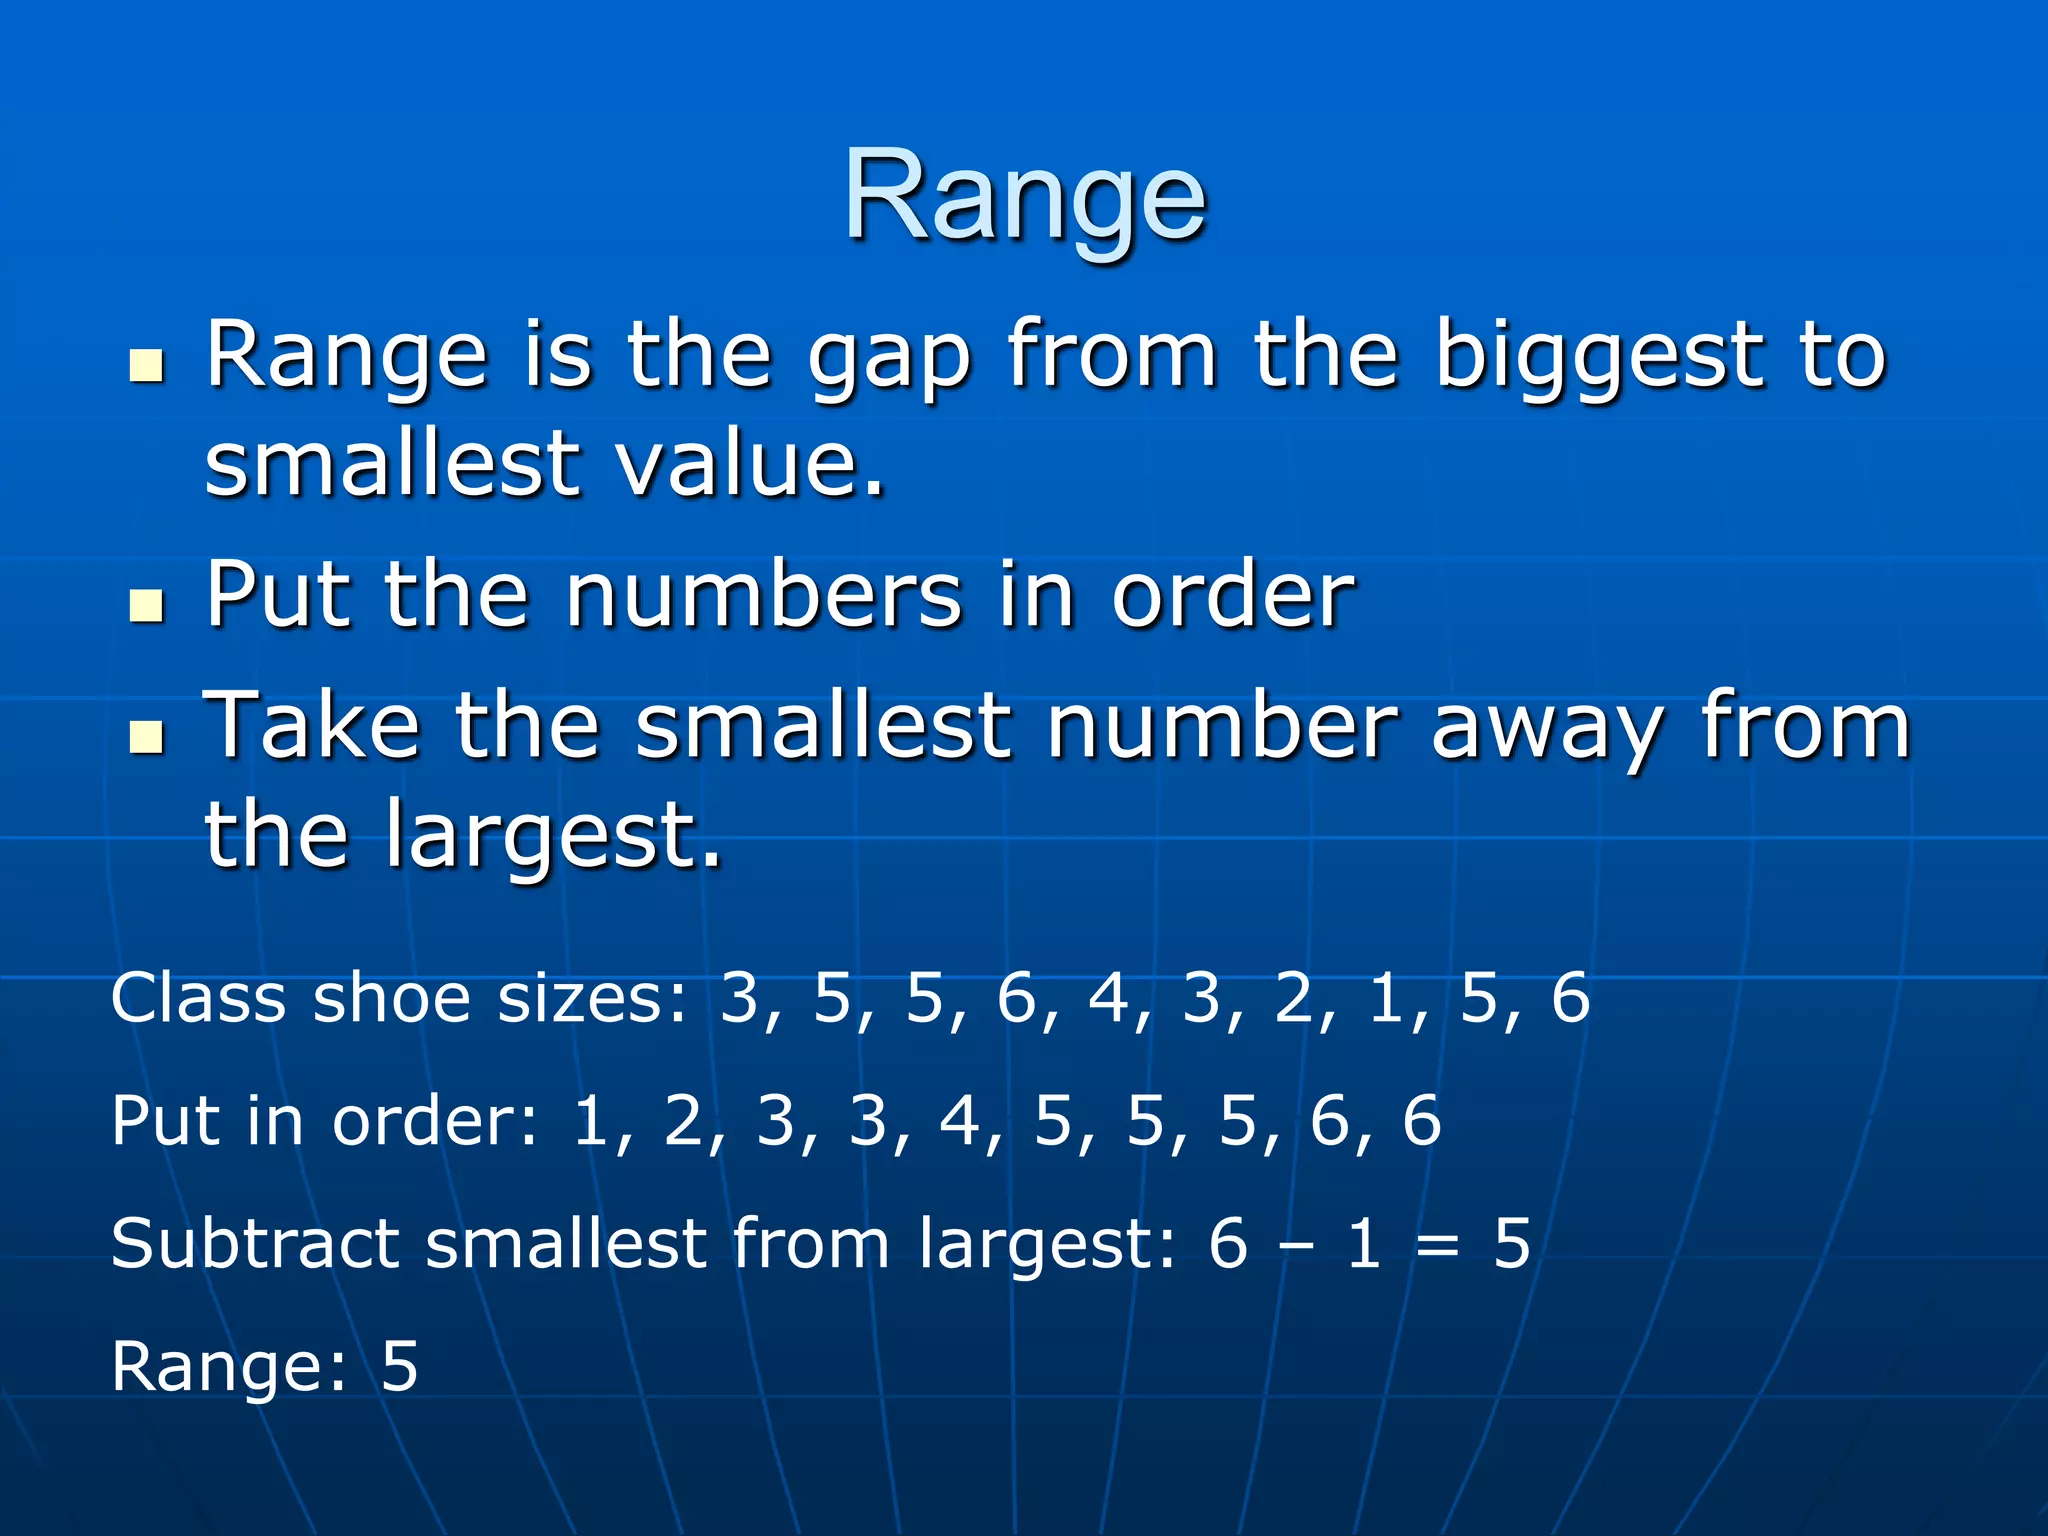
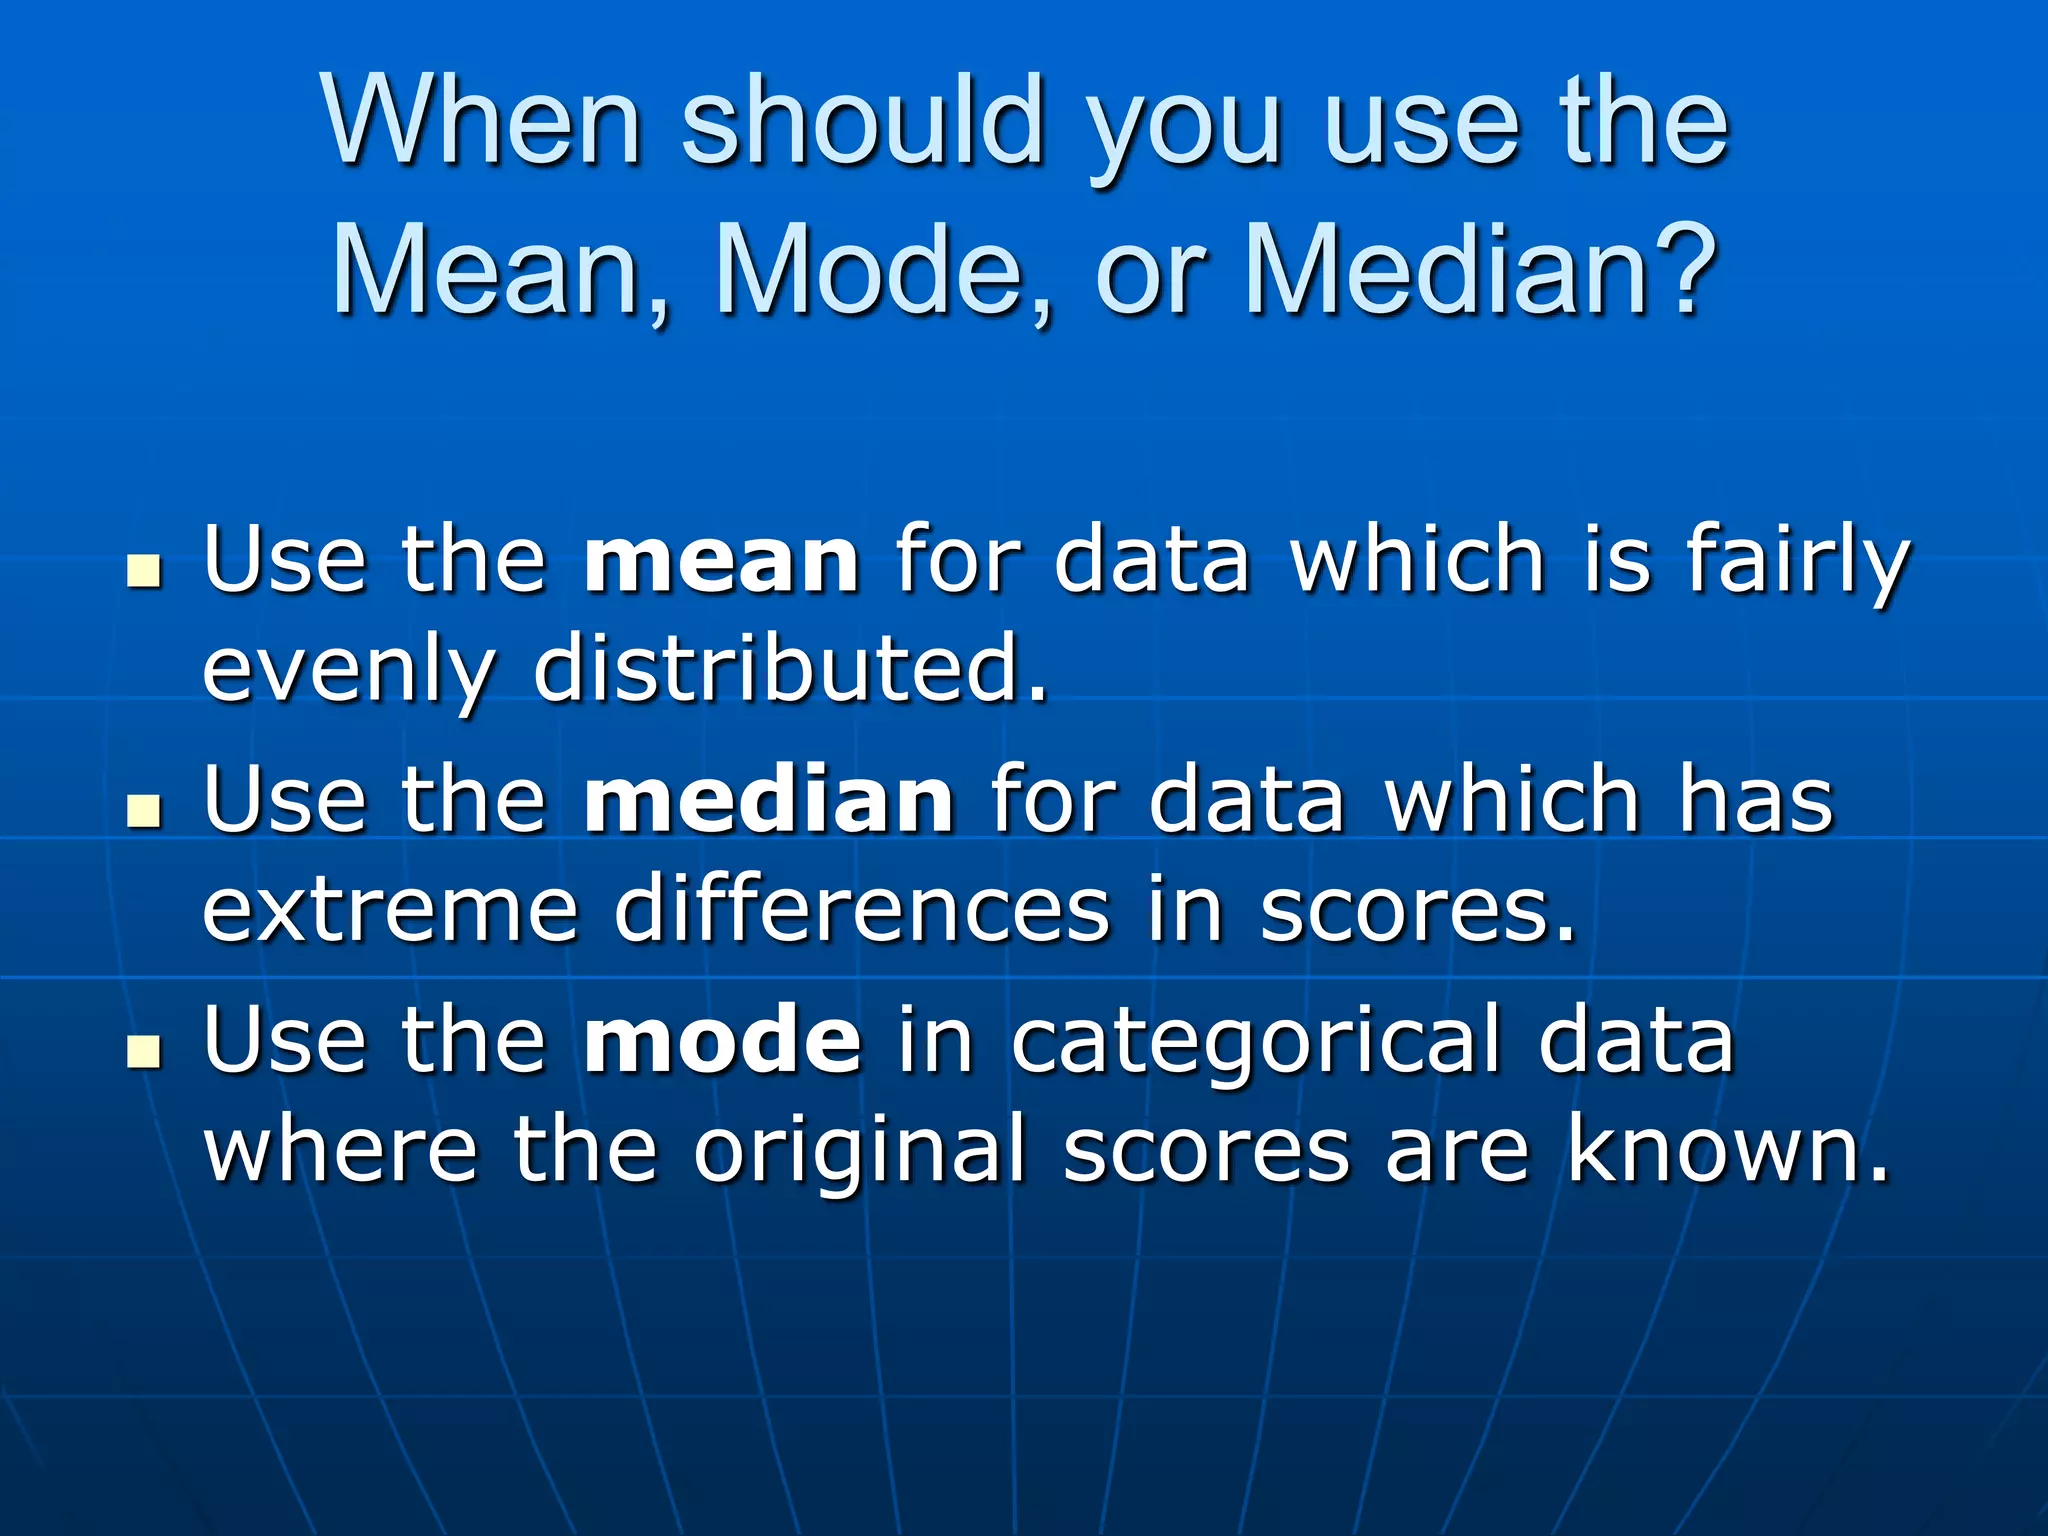
Definition of Median, how to calculate it with examples, along with determining when to use Mean, Mode, or Median in statistical analysis.