This document summarizes a presentation on stability testing of finished pharmaceutical products. It discusses the objectives of stability testing, relevant guidelines such as ICH and WHO, variables that can affect stability, and terminology used in stability testing. The key points are that stability testing provides evidence of how quality varies over time under different storage conditions, and that guidelines help establish shelf lives and ensure products maintain quality within specifications.

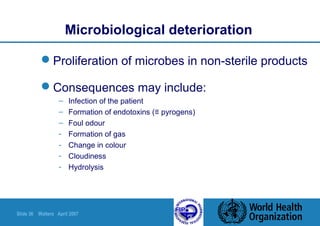
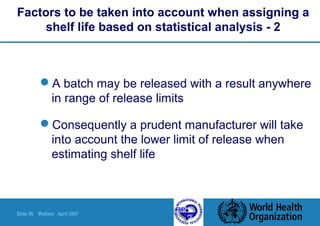
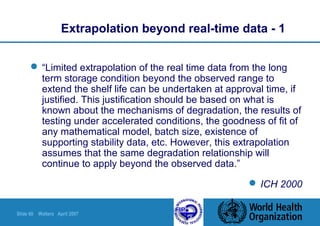
![Slide 18 Walters April 2007
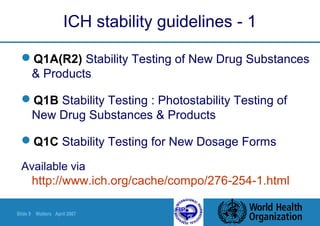
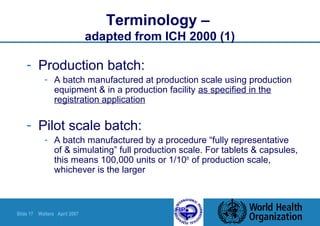
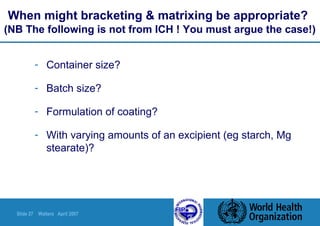
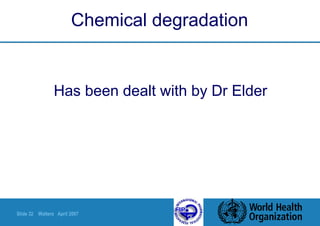
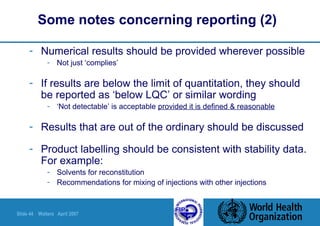
Terminology –
adapted from ICH 2000 (2)
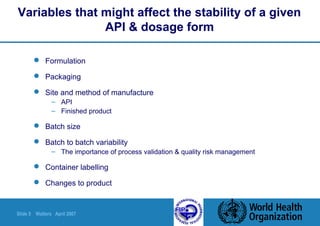
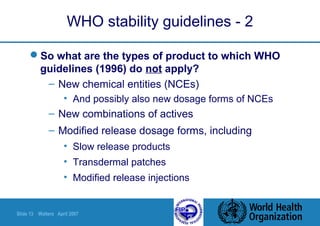
Re-test period: API
– The period of time for which the API remains within
specification when stored under the recommended conditions in
the proposed bulk storage container
– “After this period, the batch should be retested for compliance
with specifications & then used immediately” [if in compliance]](https://image.slidesharecdn.com/stability-151103041919-lva1-app6891/85/Stability-18-320.jpg)
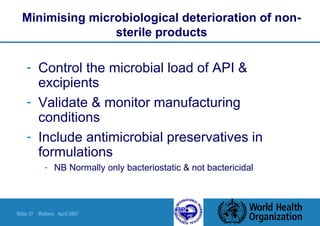
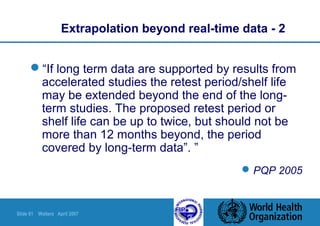
![Slide 19 Walters April 2007
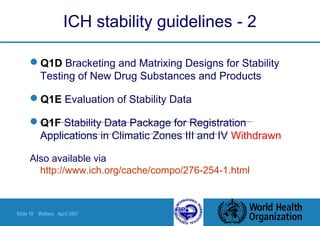
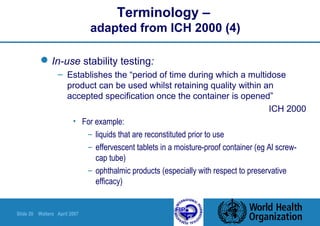
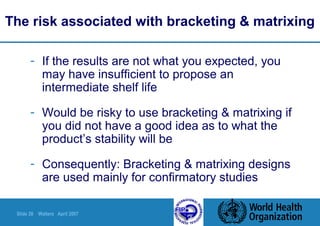
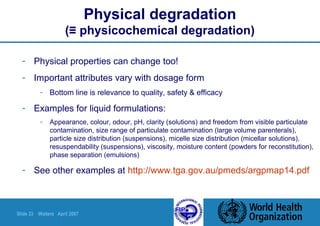
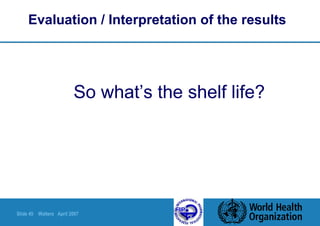
Terminology –
adapted from ICH 2000 (3)
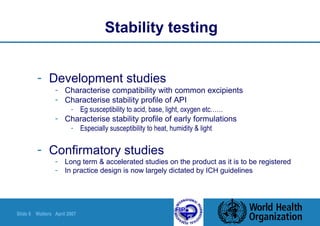
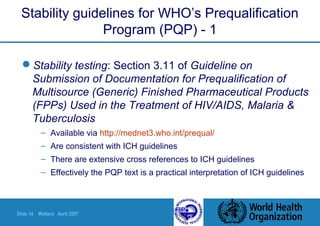
- Accelerated testing
- Studies designed to increase the rate of chemical degradation or physical
change by means of exaggerated storage conditions
- Intermediate testing
- Studies at 30degC/60%RH, intended for extrapolation to long term storage at
25degC [provided that 25degC is appropriate for the market in question]
- Stress testing
- API: Studies which elucidate intrinsic stab of API. Normally during development.
Normally more stressful than ‘accelerated’ testing.
- Finished product: Studies of effect of ‘severe’ conditions. Eg freeze/thaw cycling
for suspensions & emulsions, low humidity for aqueous liquids in moisture-
permeable containers.](https://image.slidesharecdn.com/stability-151103041919-lva1-app6891/85/Stability-19-320.jpg)
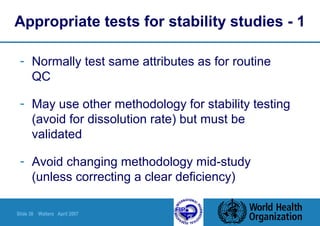
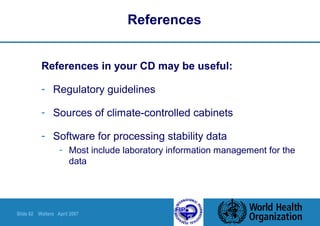
![Slide 30 Walters April 2007
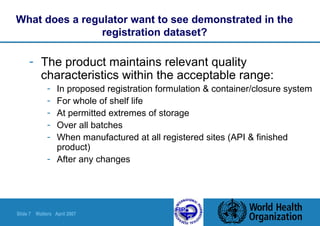
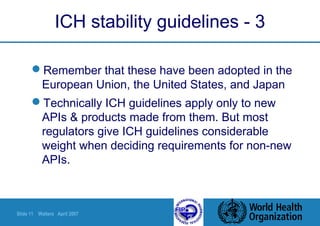
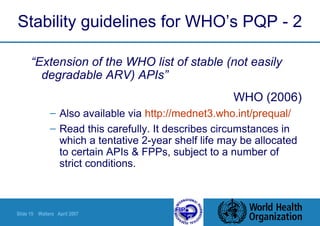
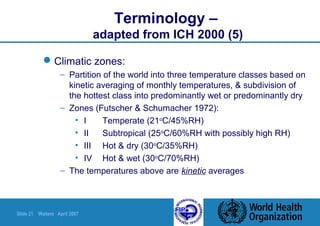
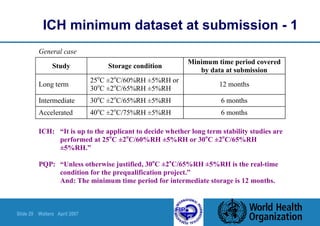
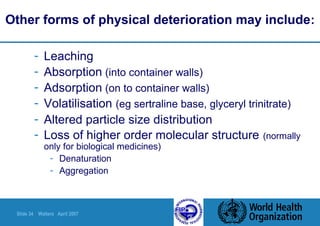
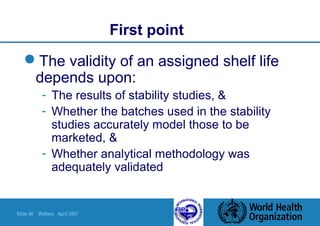
ICH minimum dataset at submission - 2
FPPs packaged in impermeable containers need not be
stored under controlled humidity conditions
There are different minimum conditions for:
– Liquid products packaged in semi-permeable containers
[relating to potential loss of solvent]
– Products intended for storage in a refrigerator, freezer or deep-
freeze](https://image.slidesharecdn.com/stability-151103041919-lva1-app6891/85/Stability-30-320.jpg)


![Stability[1].ppt in pharmaceutcals tablets and capsules](https://cdn.slidesharecdn.com/ss_thumbnails/stability1-250310060758-1027a557-thumbnail.jpg?width=640&height=640&fit=bounds)


![ONFH[AVN HIP] -TRIPLE REGIME -A NOVAL SURGICAL CONCEPT .pptx](https://cdn.slidesharecdn.com/ss_thumbnails/onfhavnhip2026koaconcalicutdrgokuldevdrmashraf-260210064517-213ec005-thumbnail.jpg?width=640&height=640&fit=bounds)


![CTEV [ clubfoot] DR ARUN LAL ,DR MOHAMED ASHRAF travancore medical college k...](https://cdn.slidesharecdn.com/ss_thumbnails/ctevclubfootdrarunlaldrmohamedashraftravancoremedicalcollegekollamkeralaindia-260208063247-18fc466c-thumbnail.jpg?width=640&height=640&fit=bounds)


