Download as PDF, PPTX
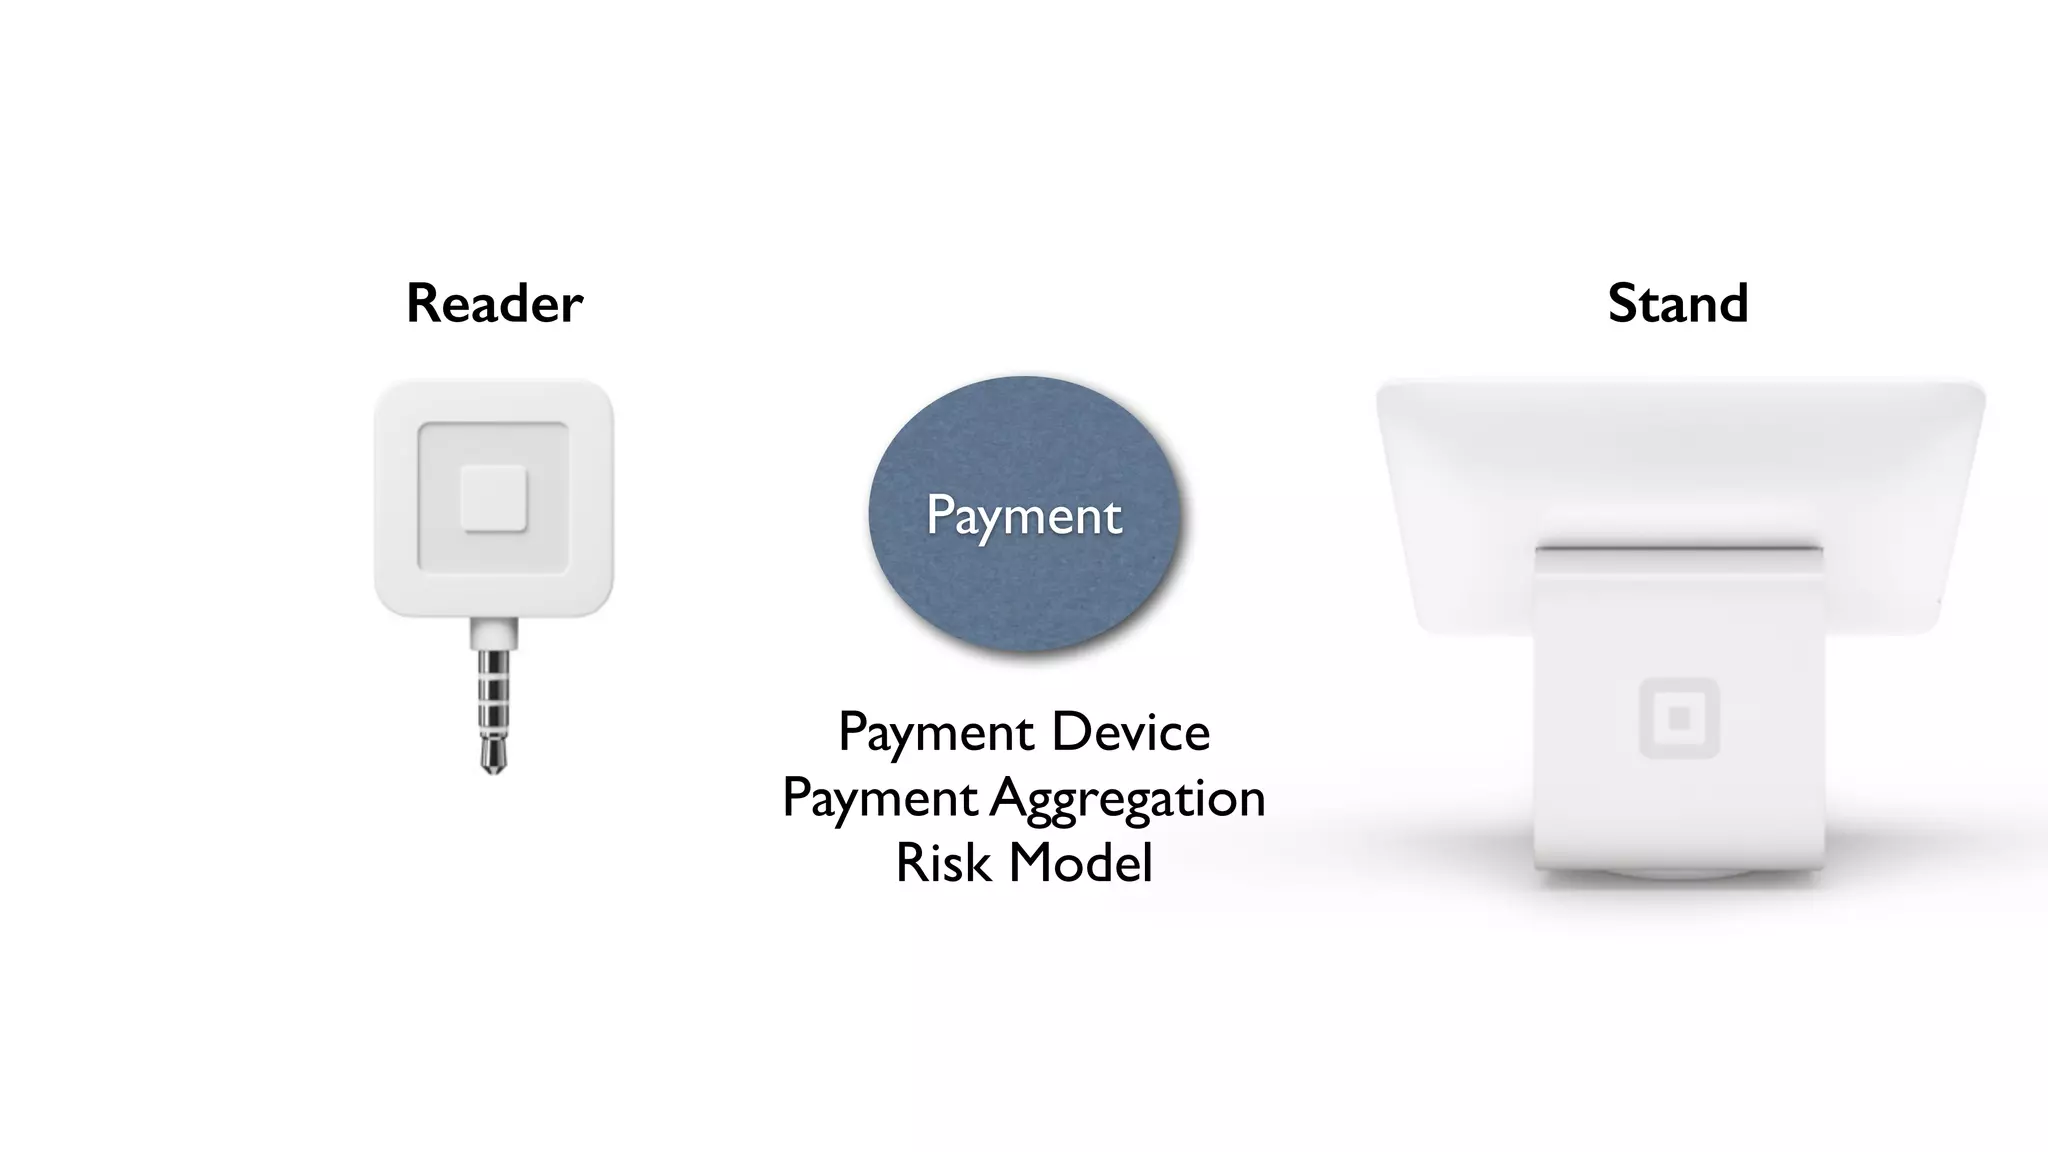
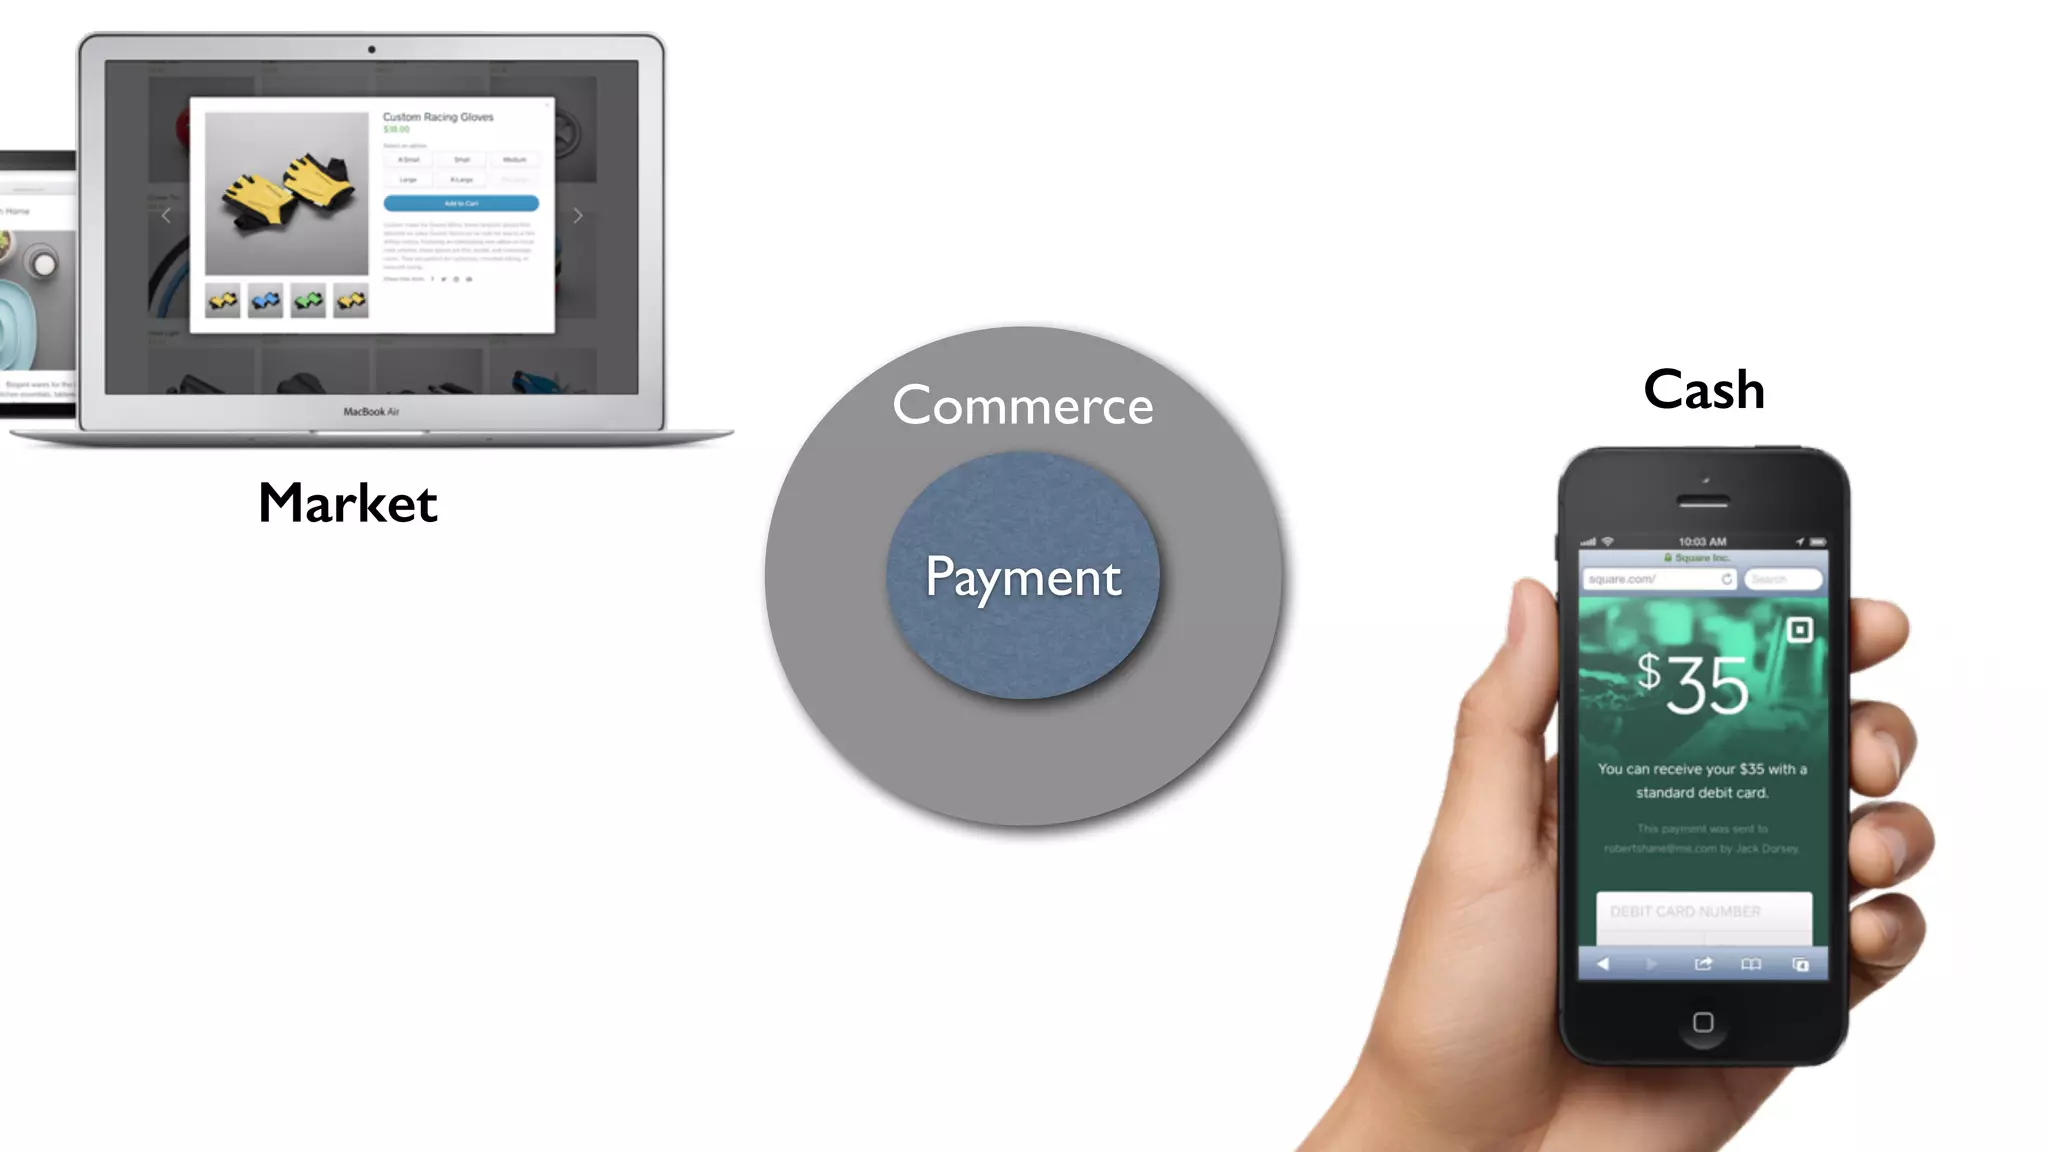


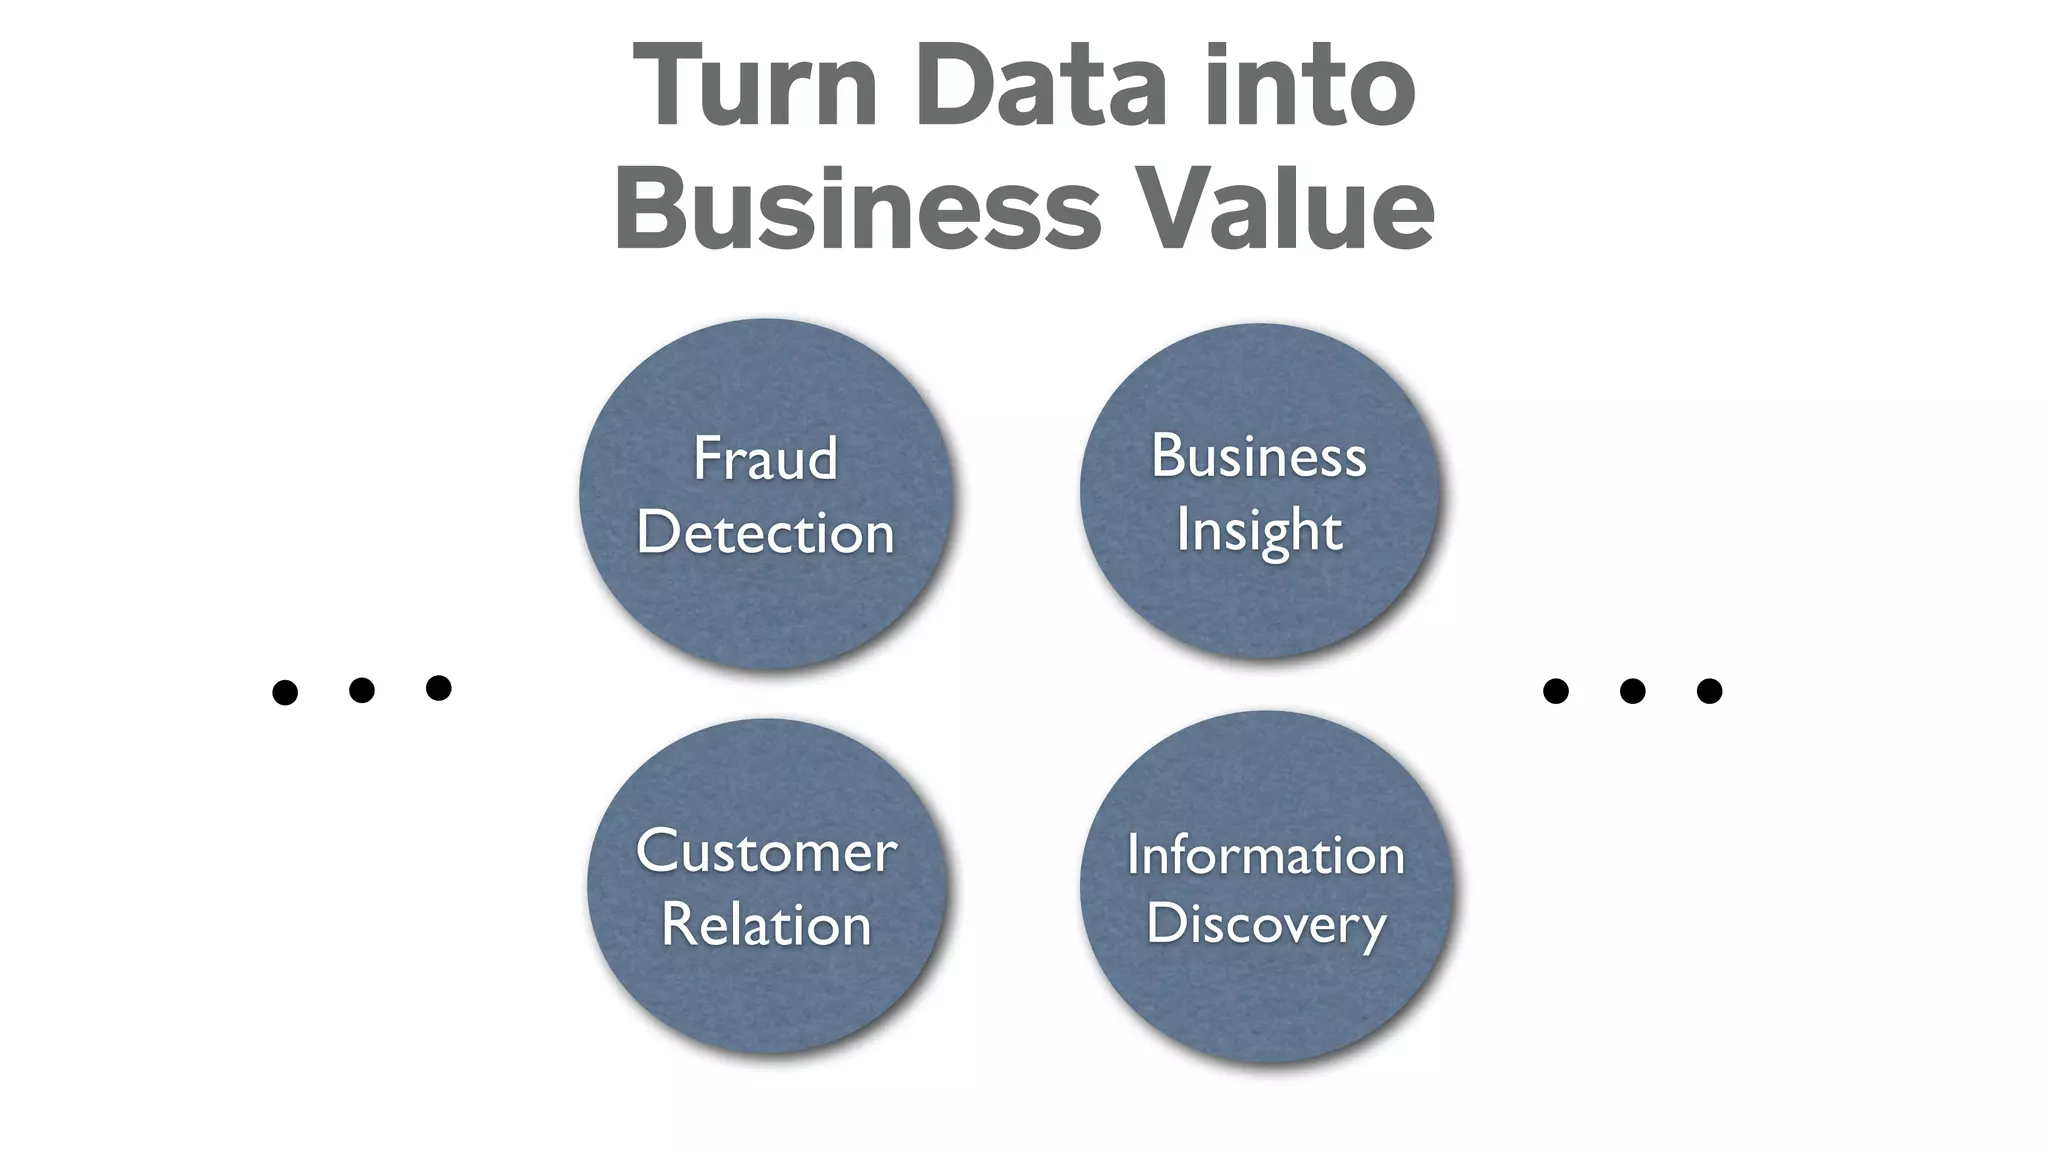
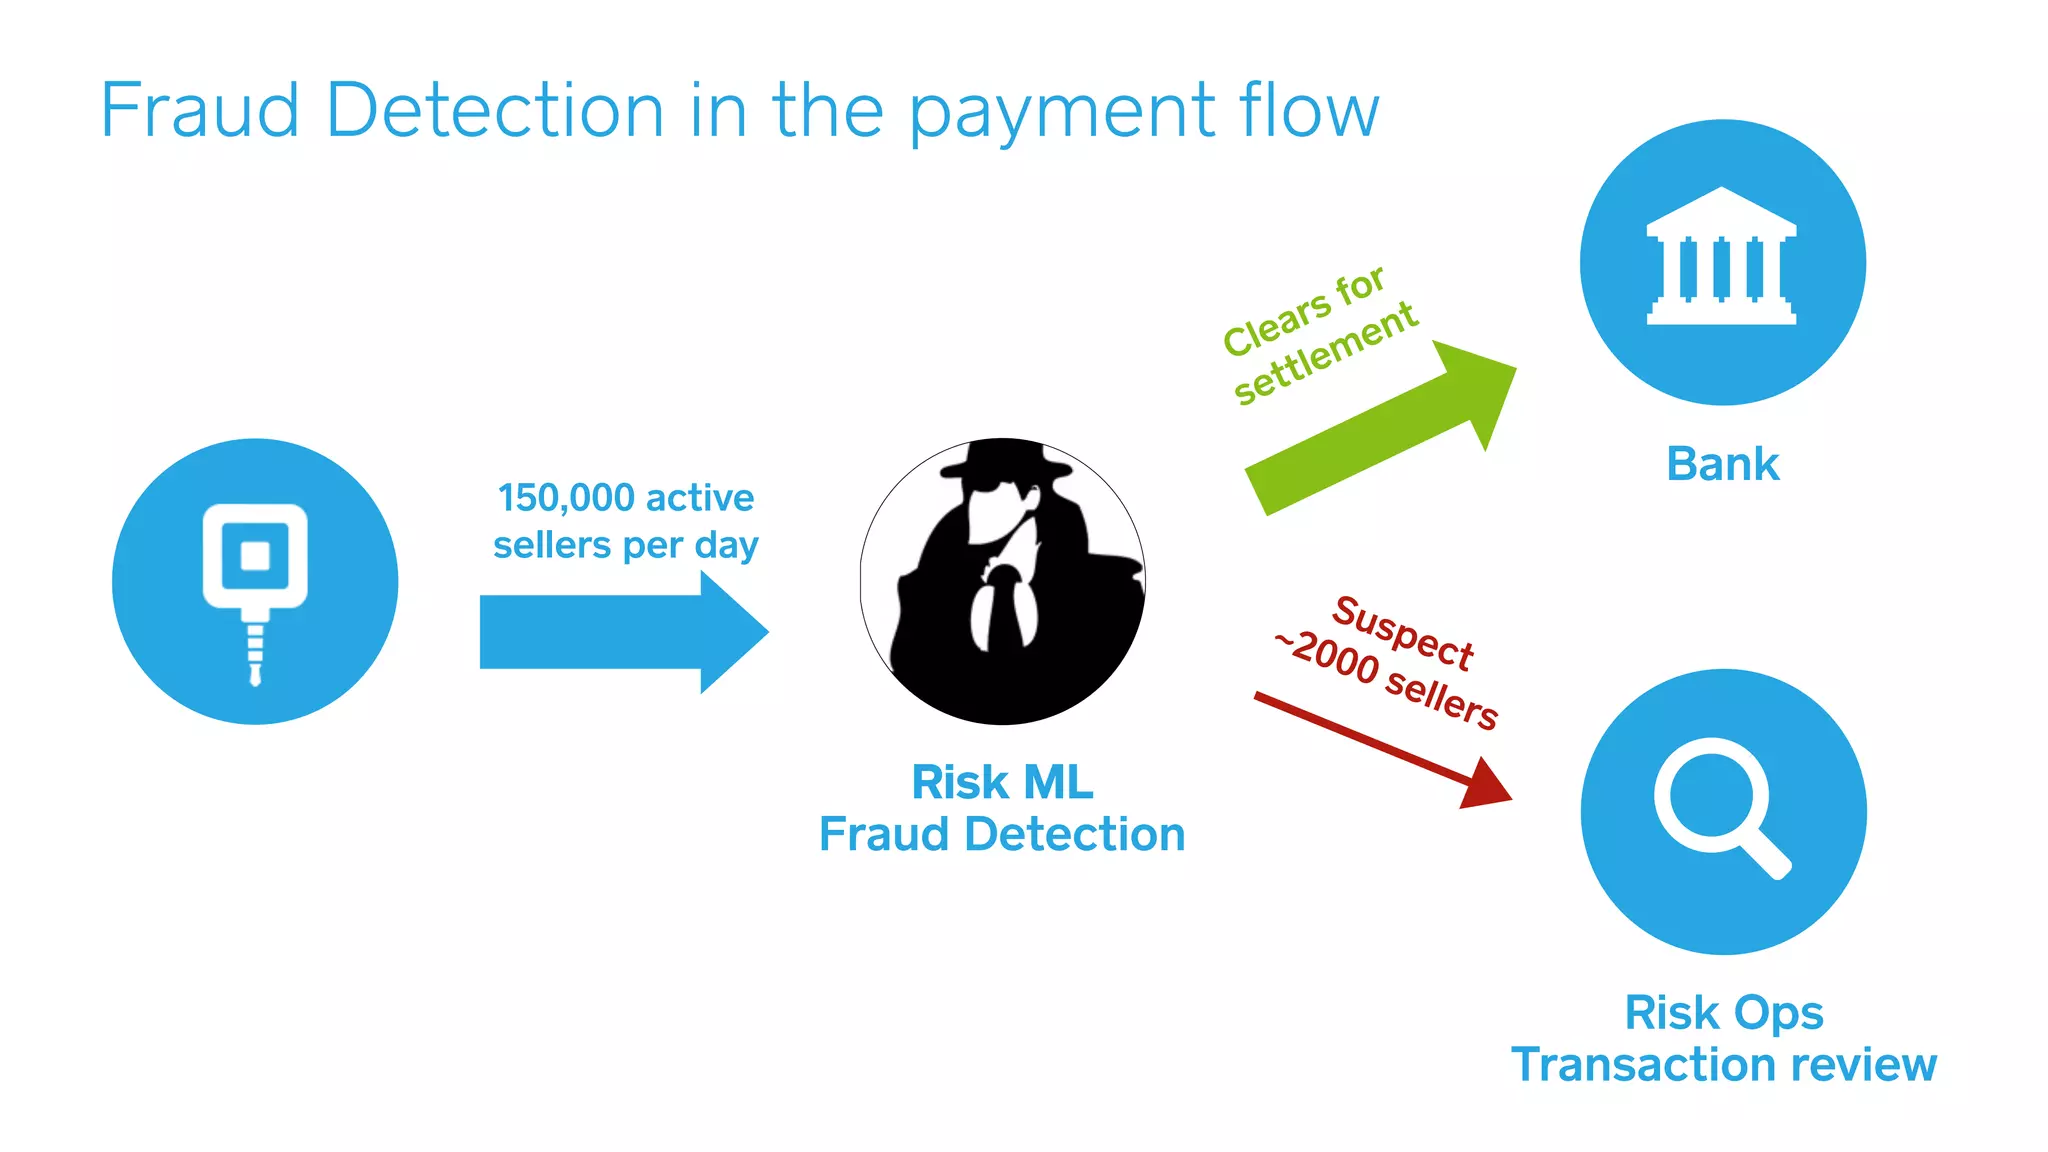
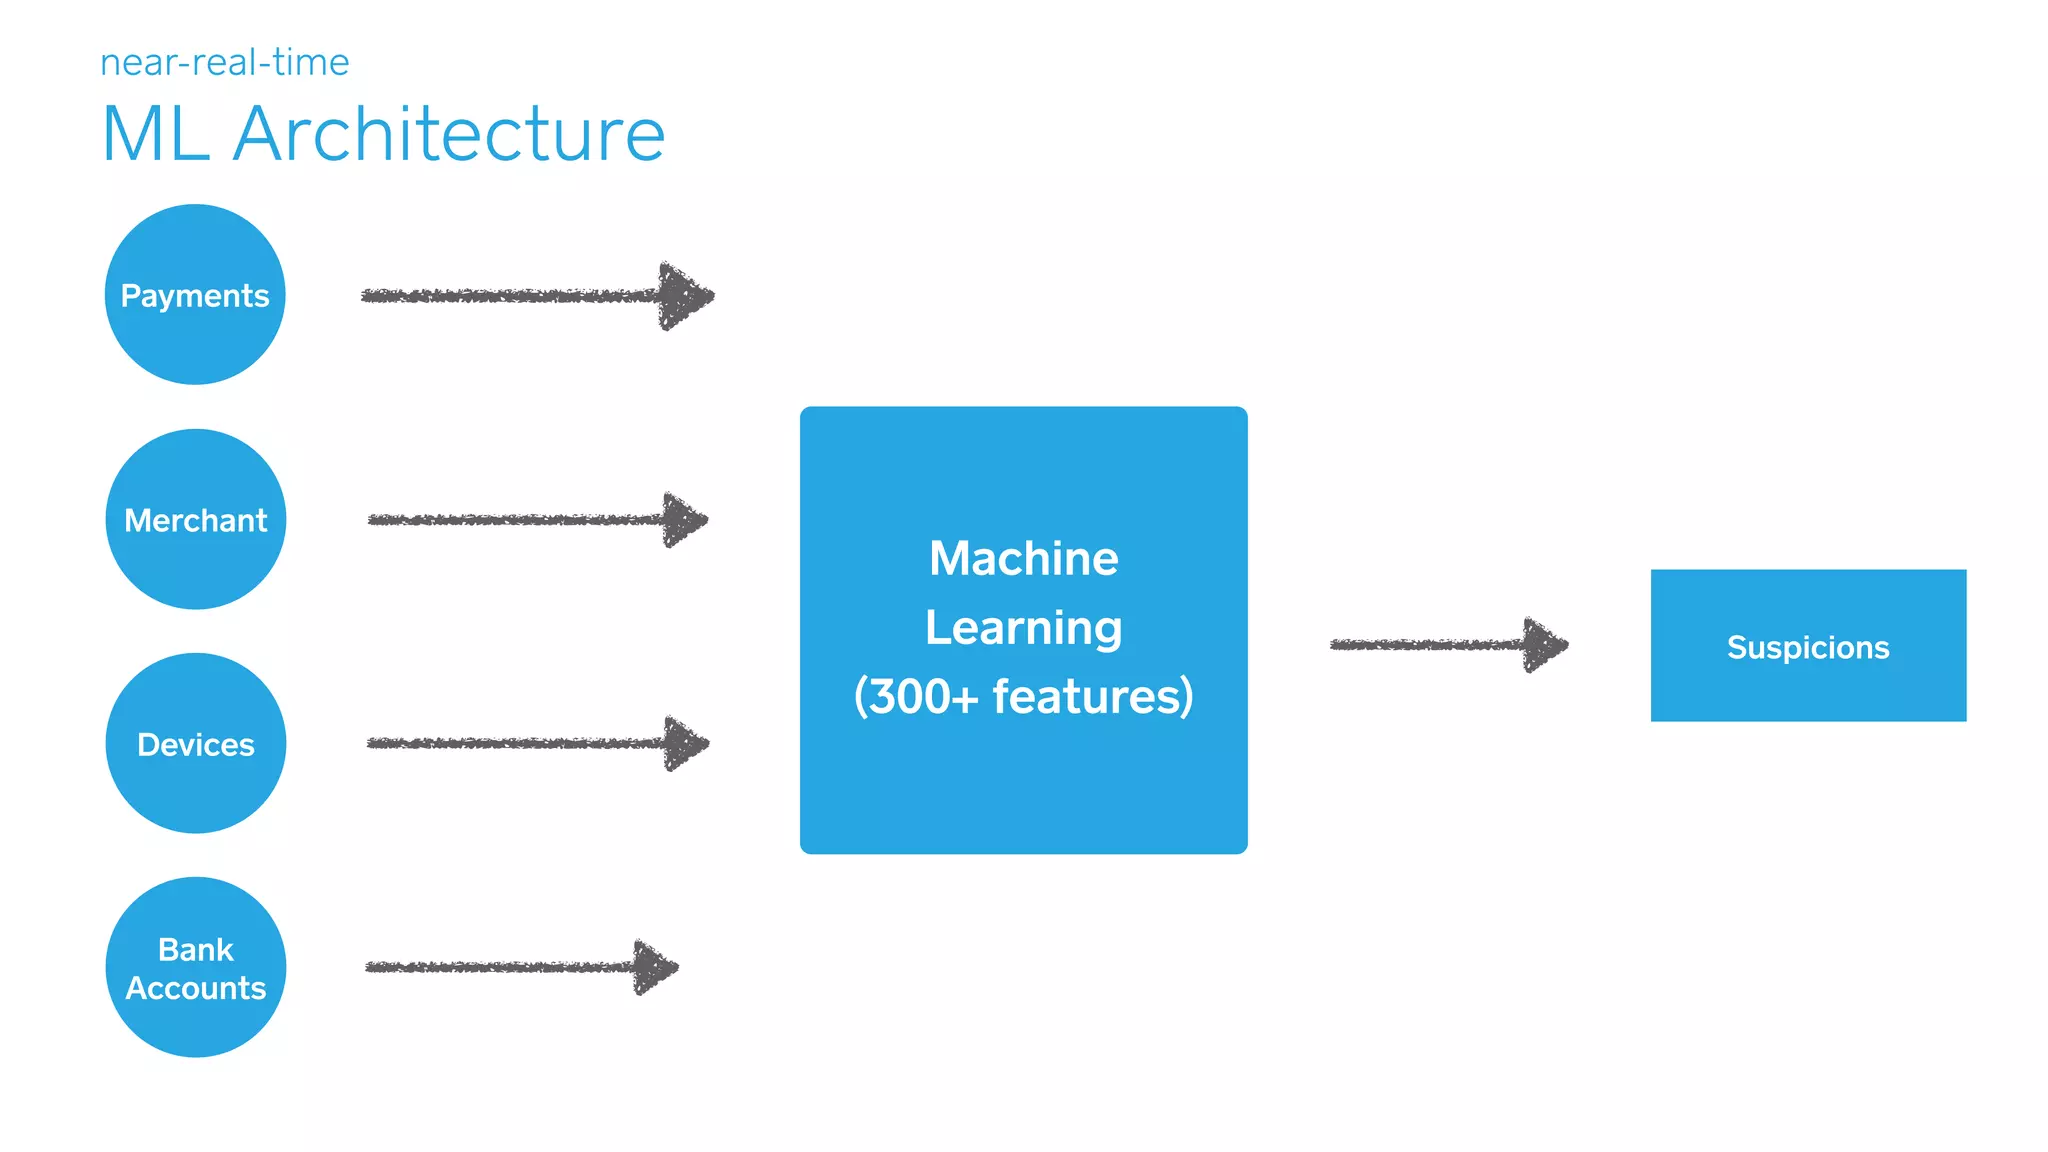

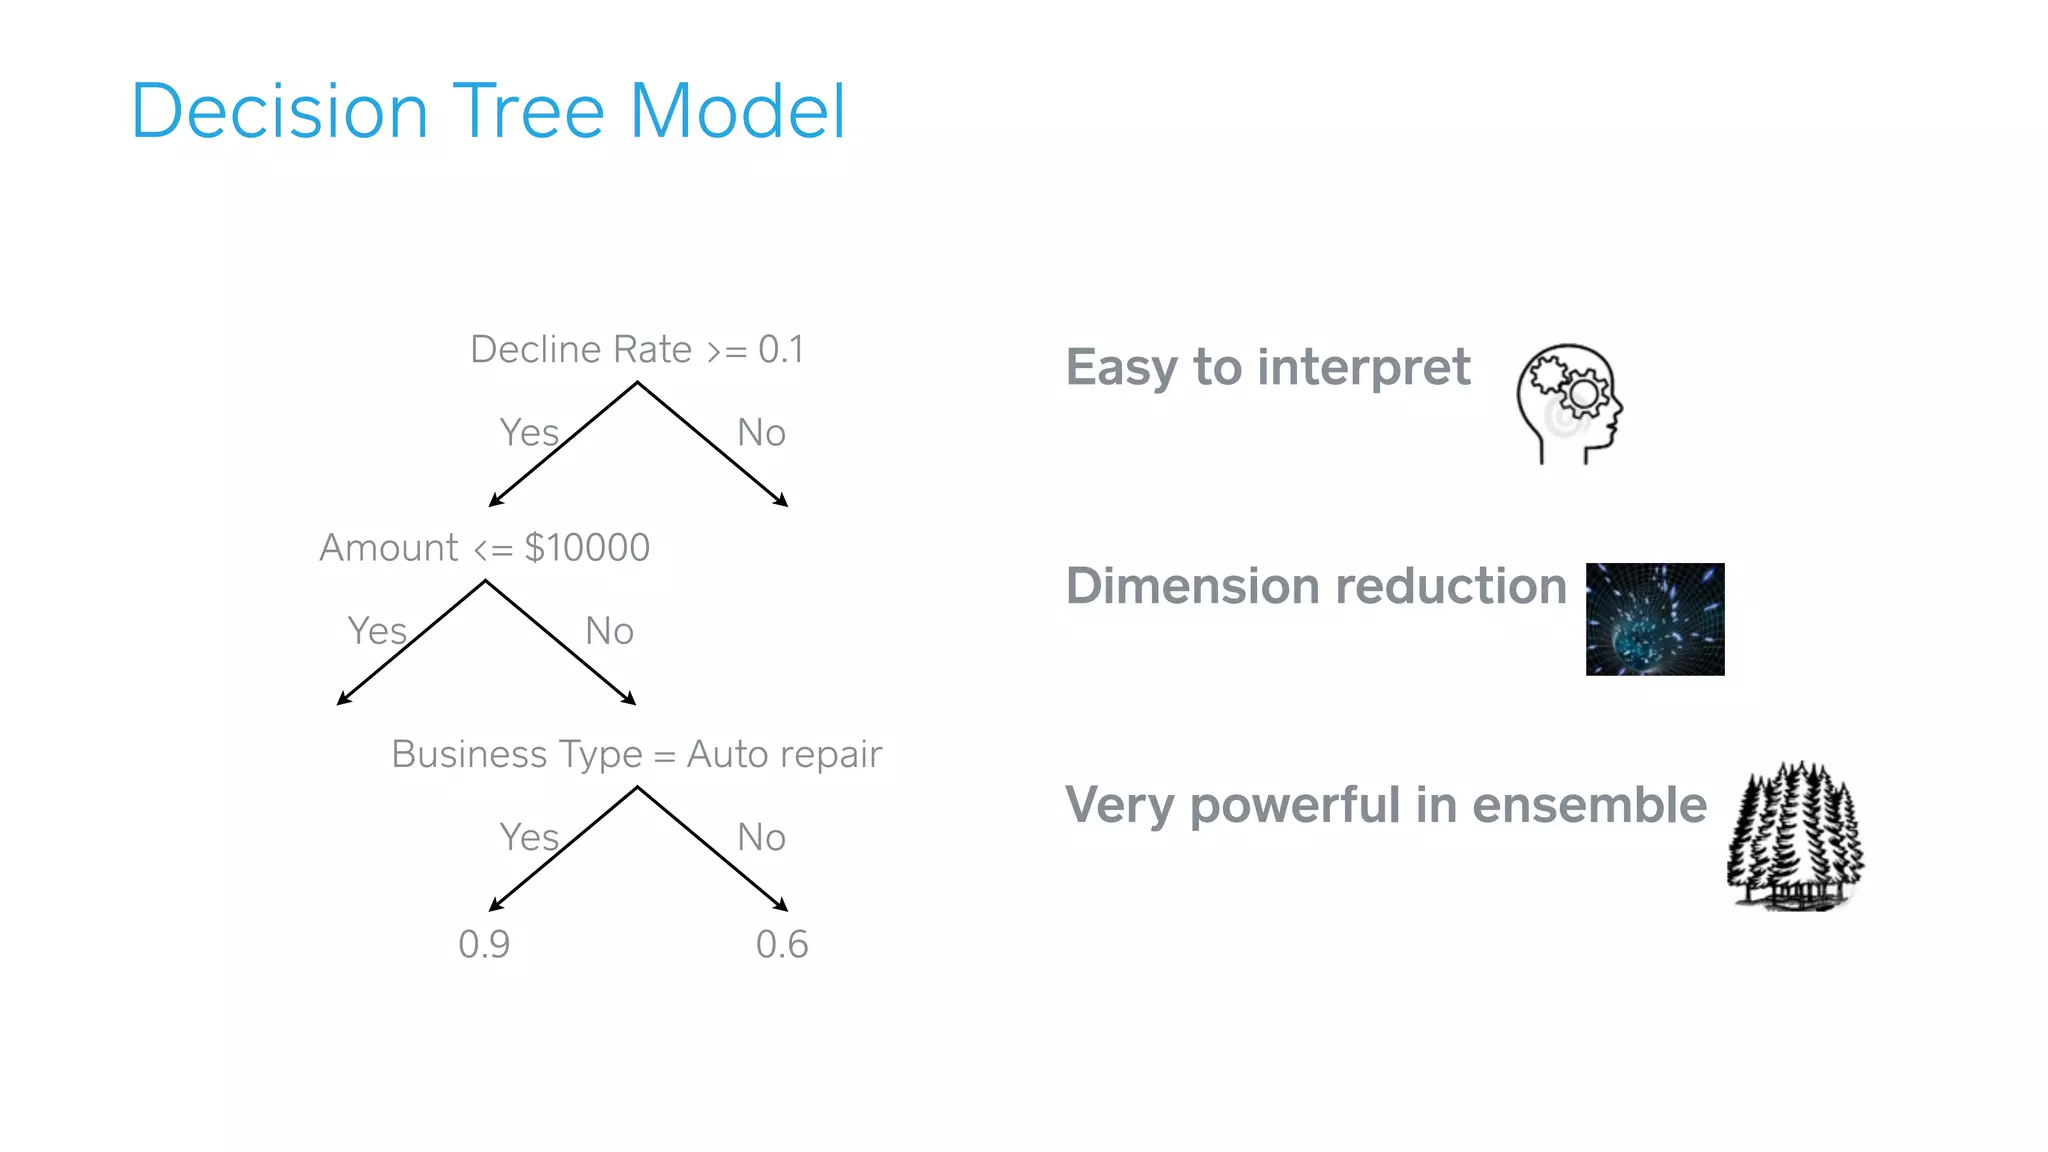
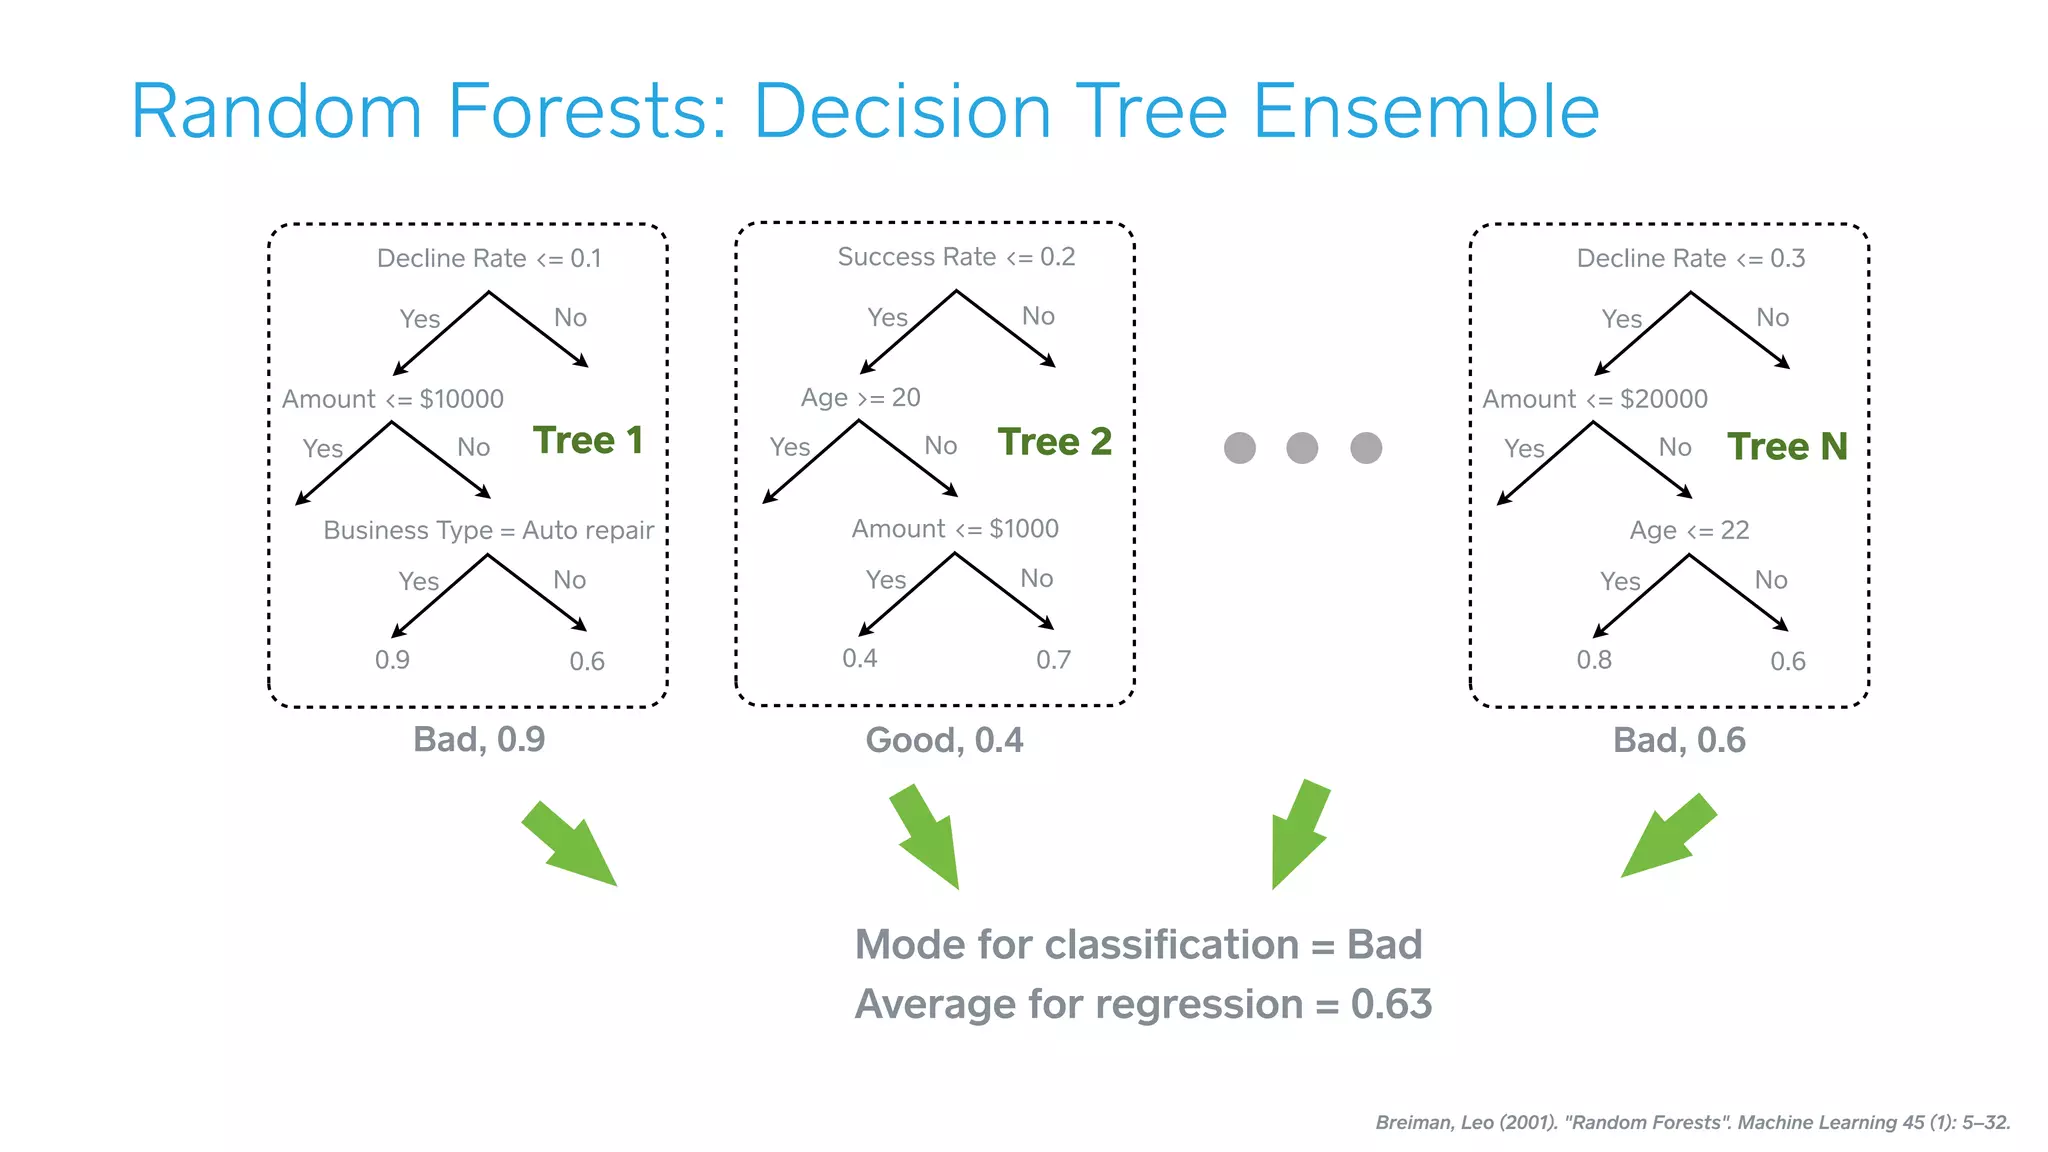
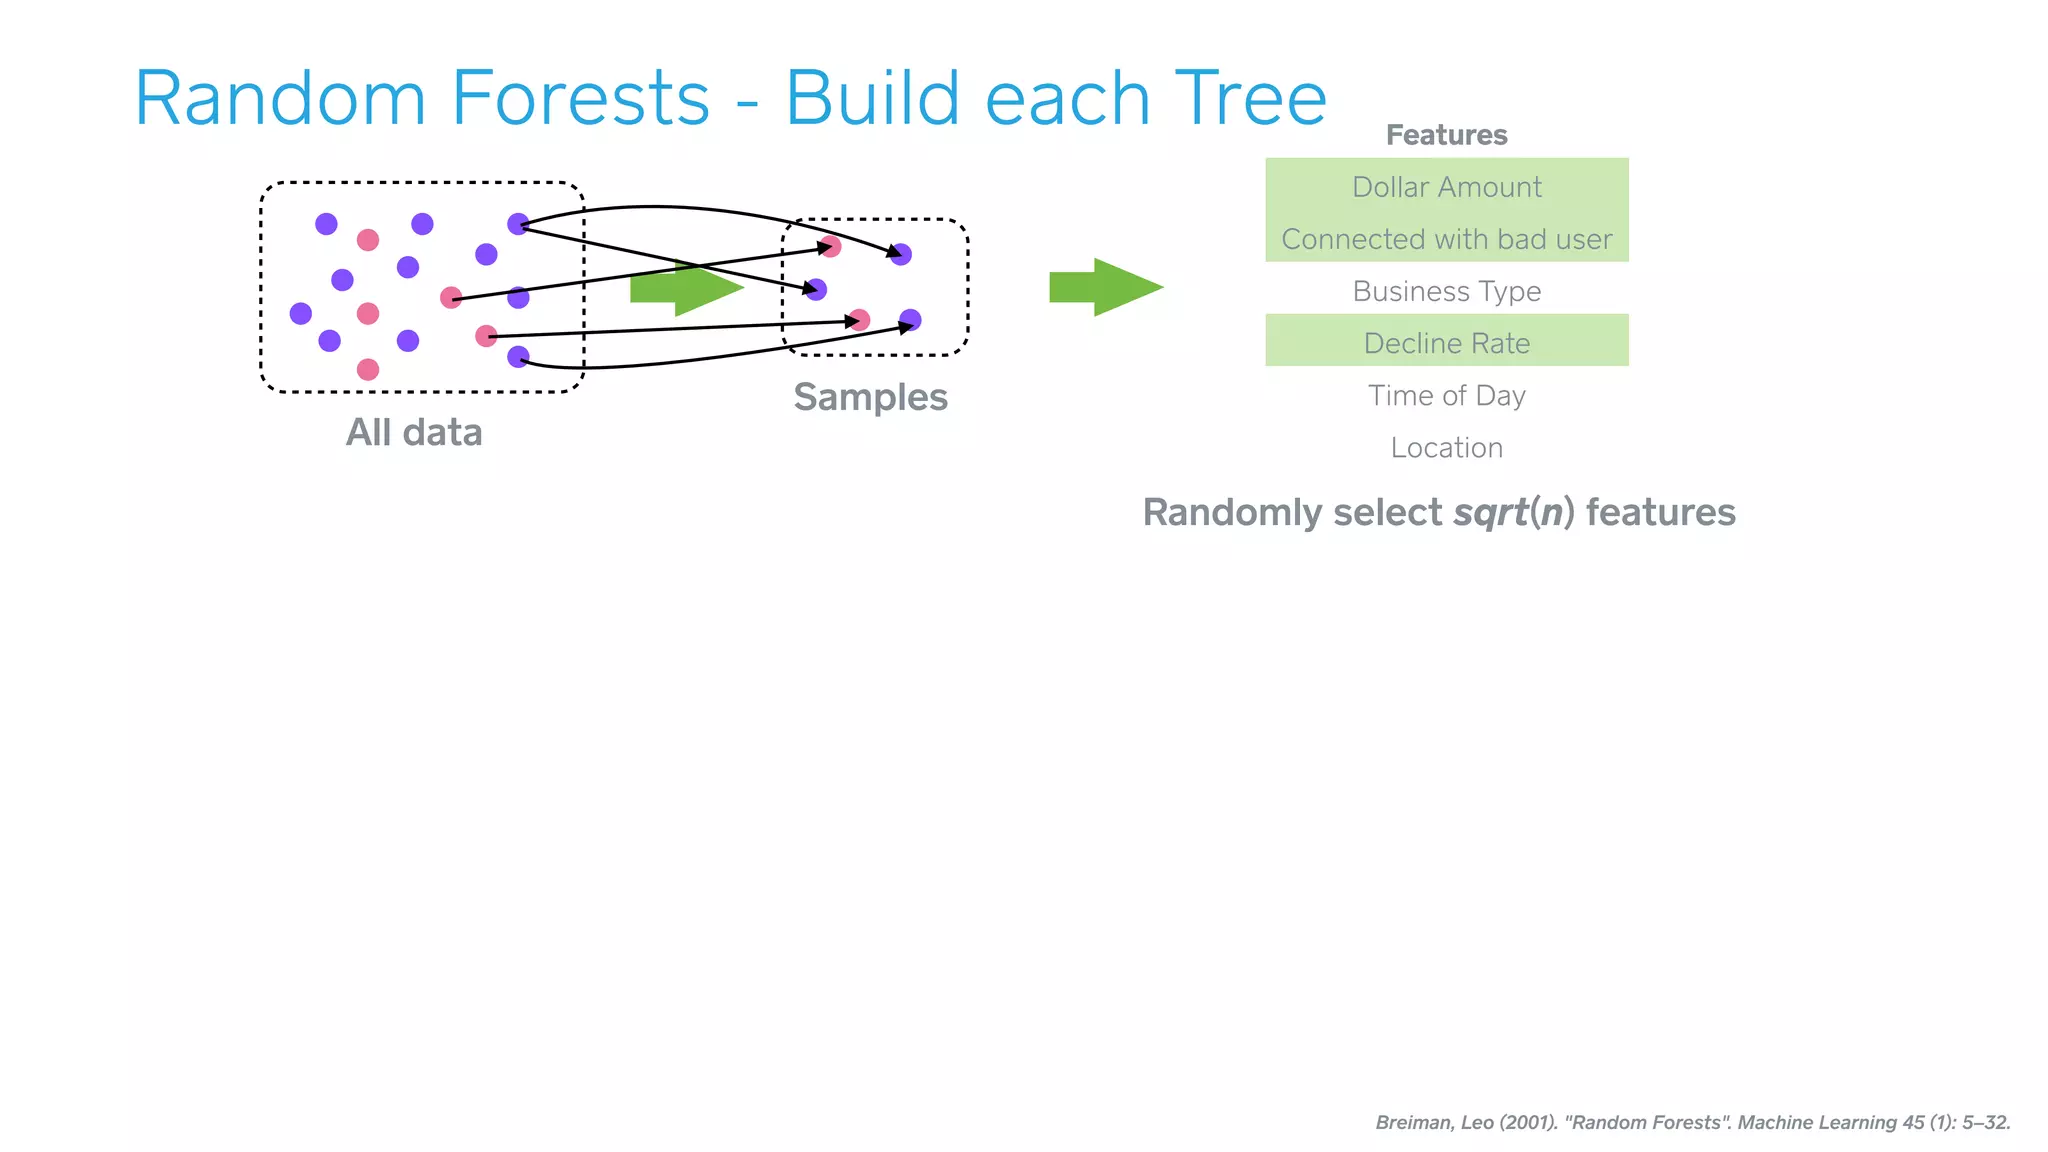
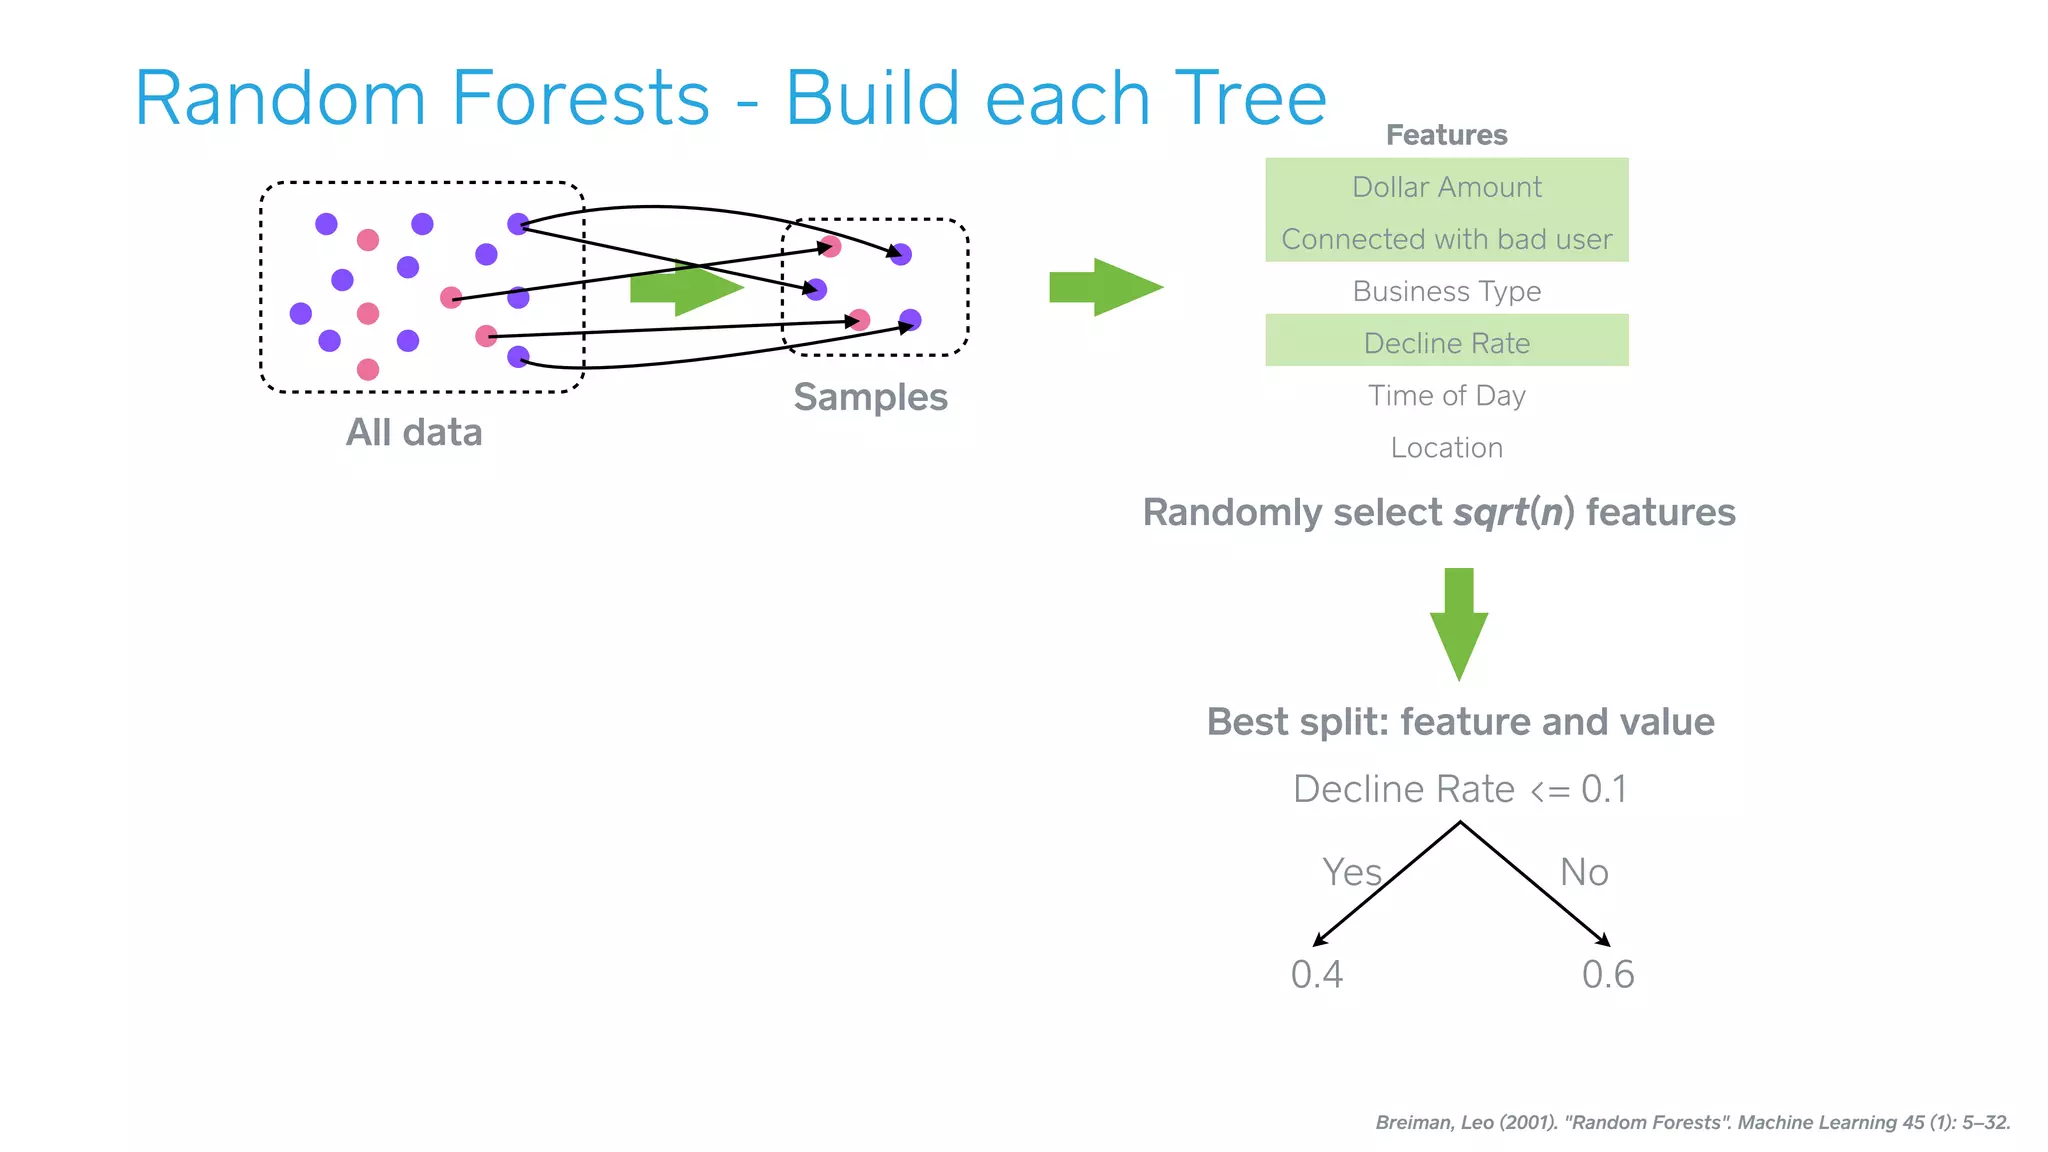
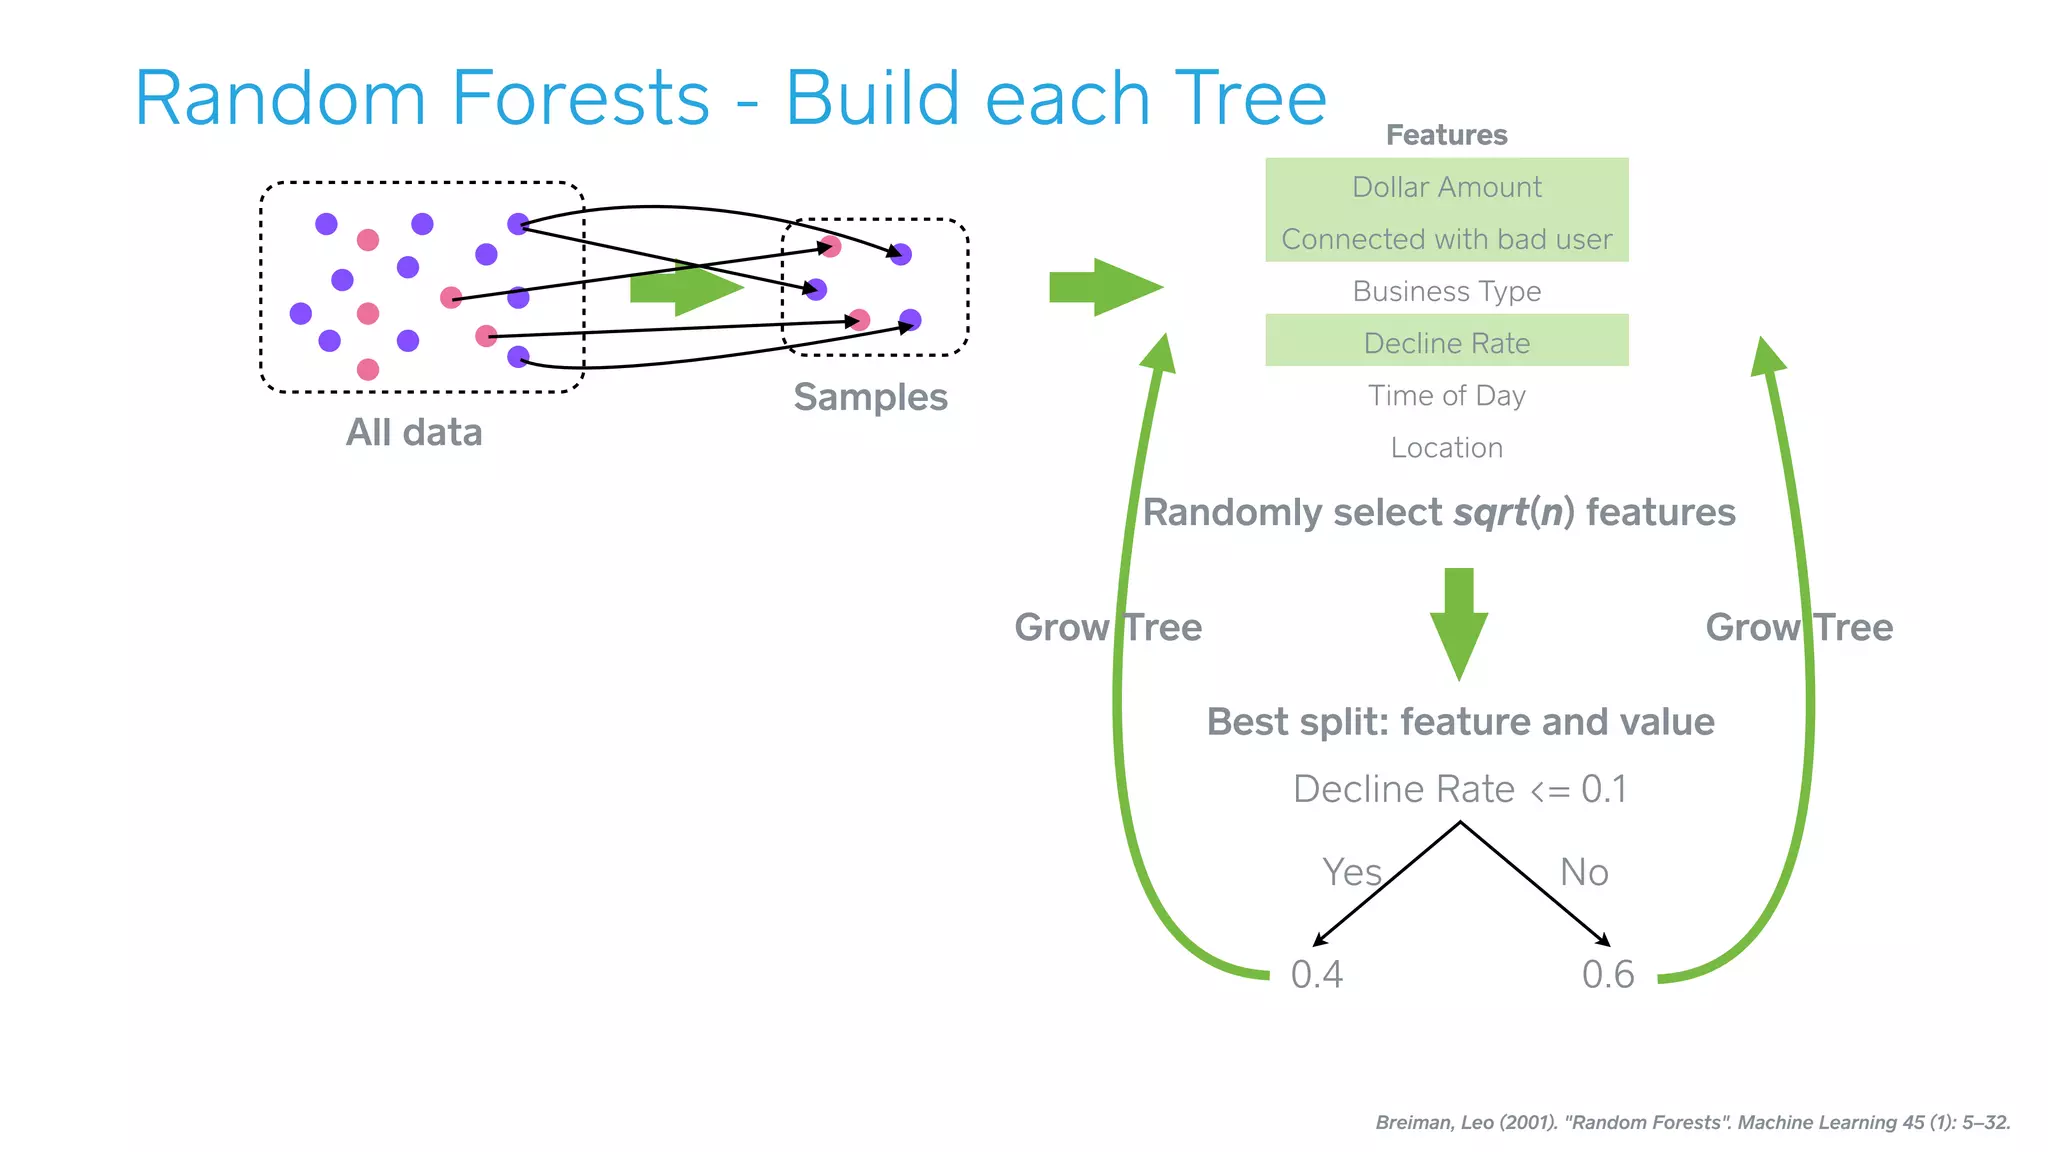
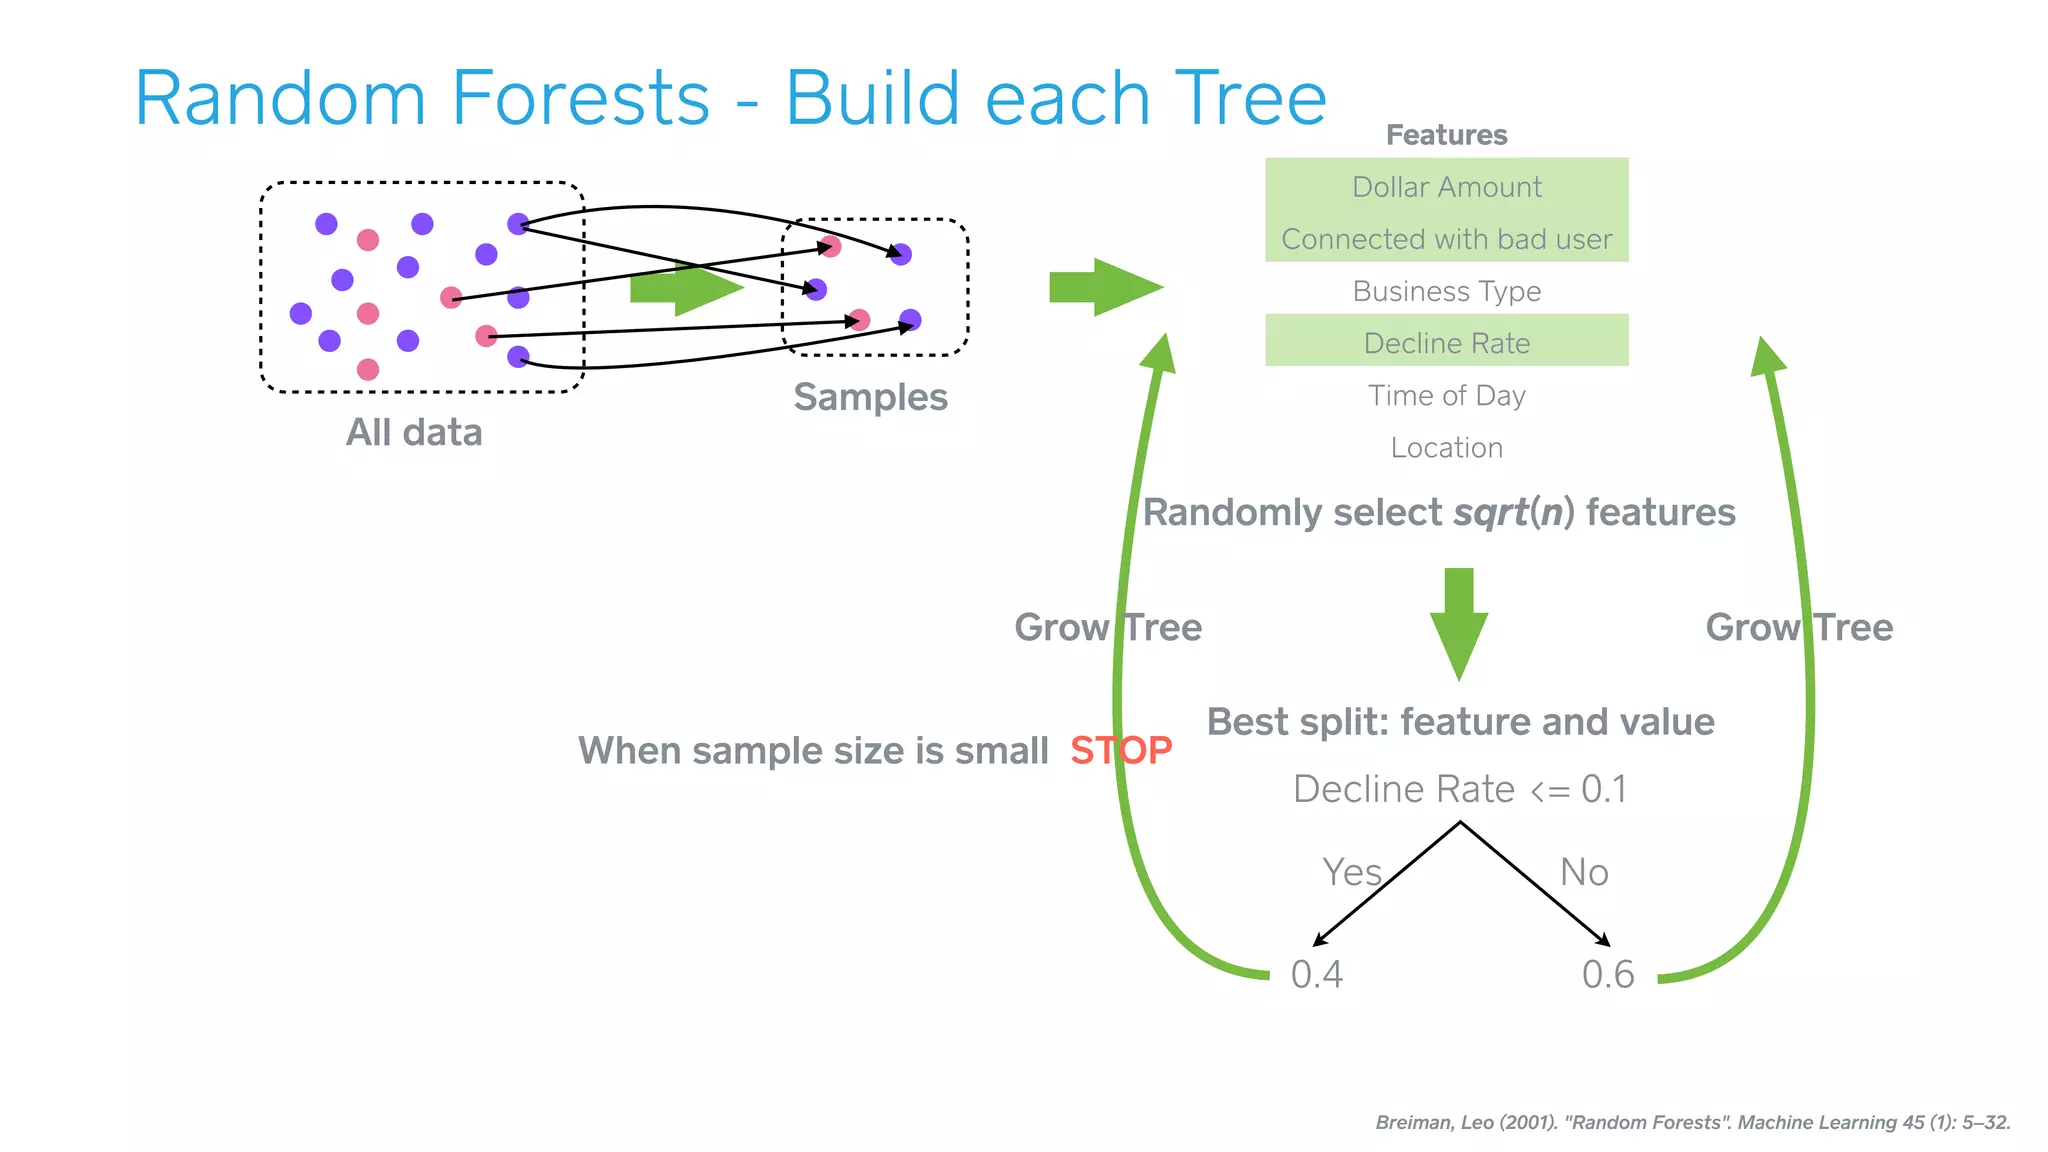
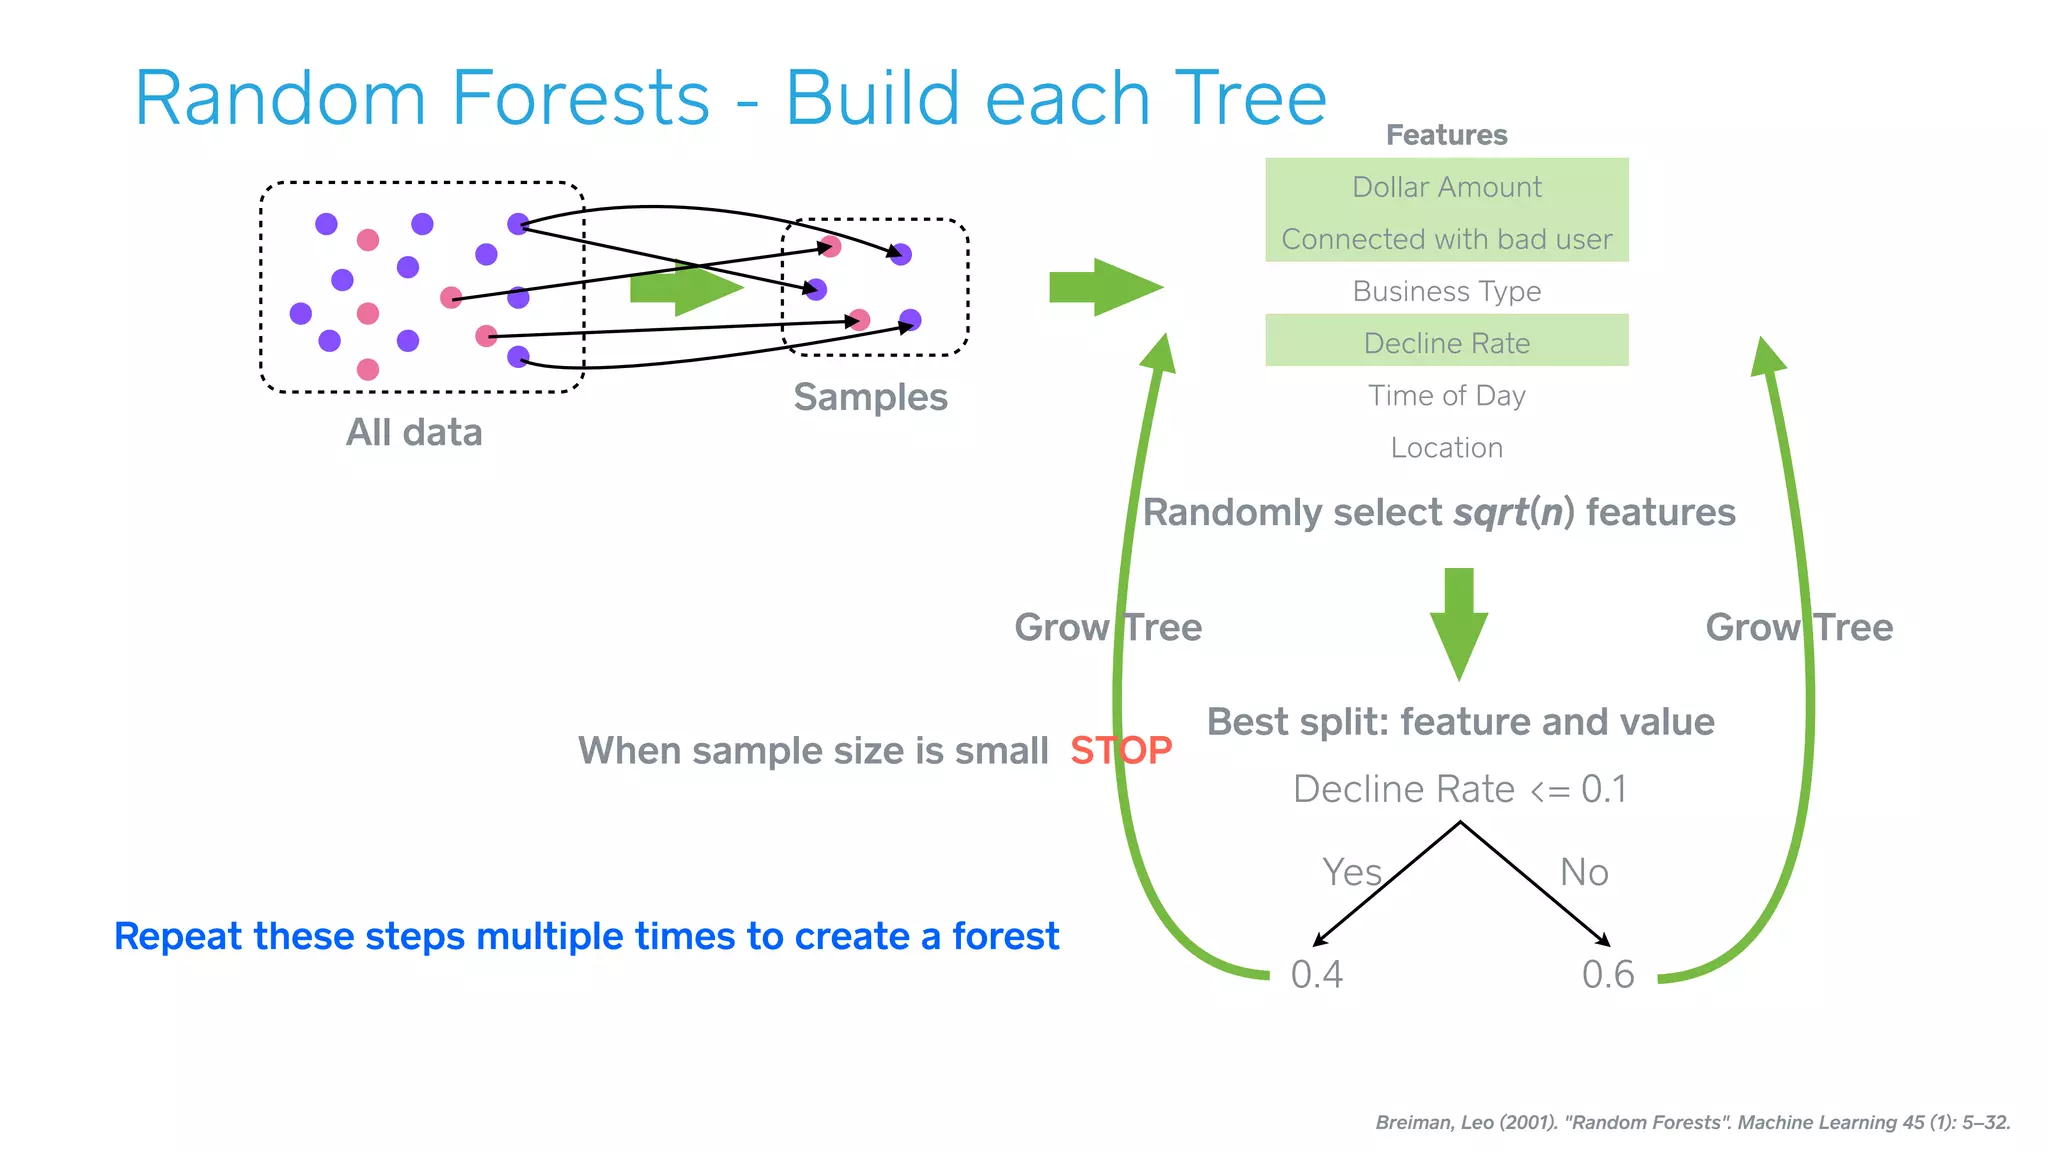
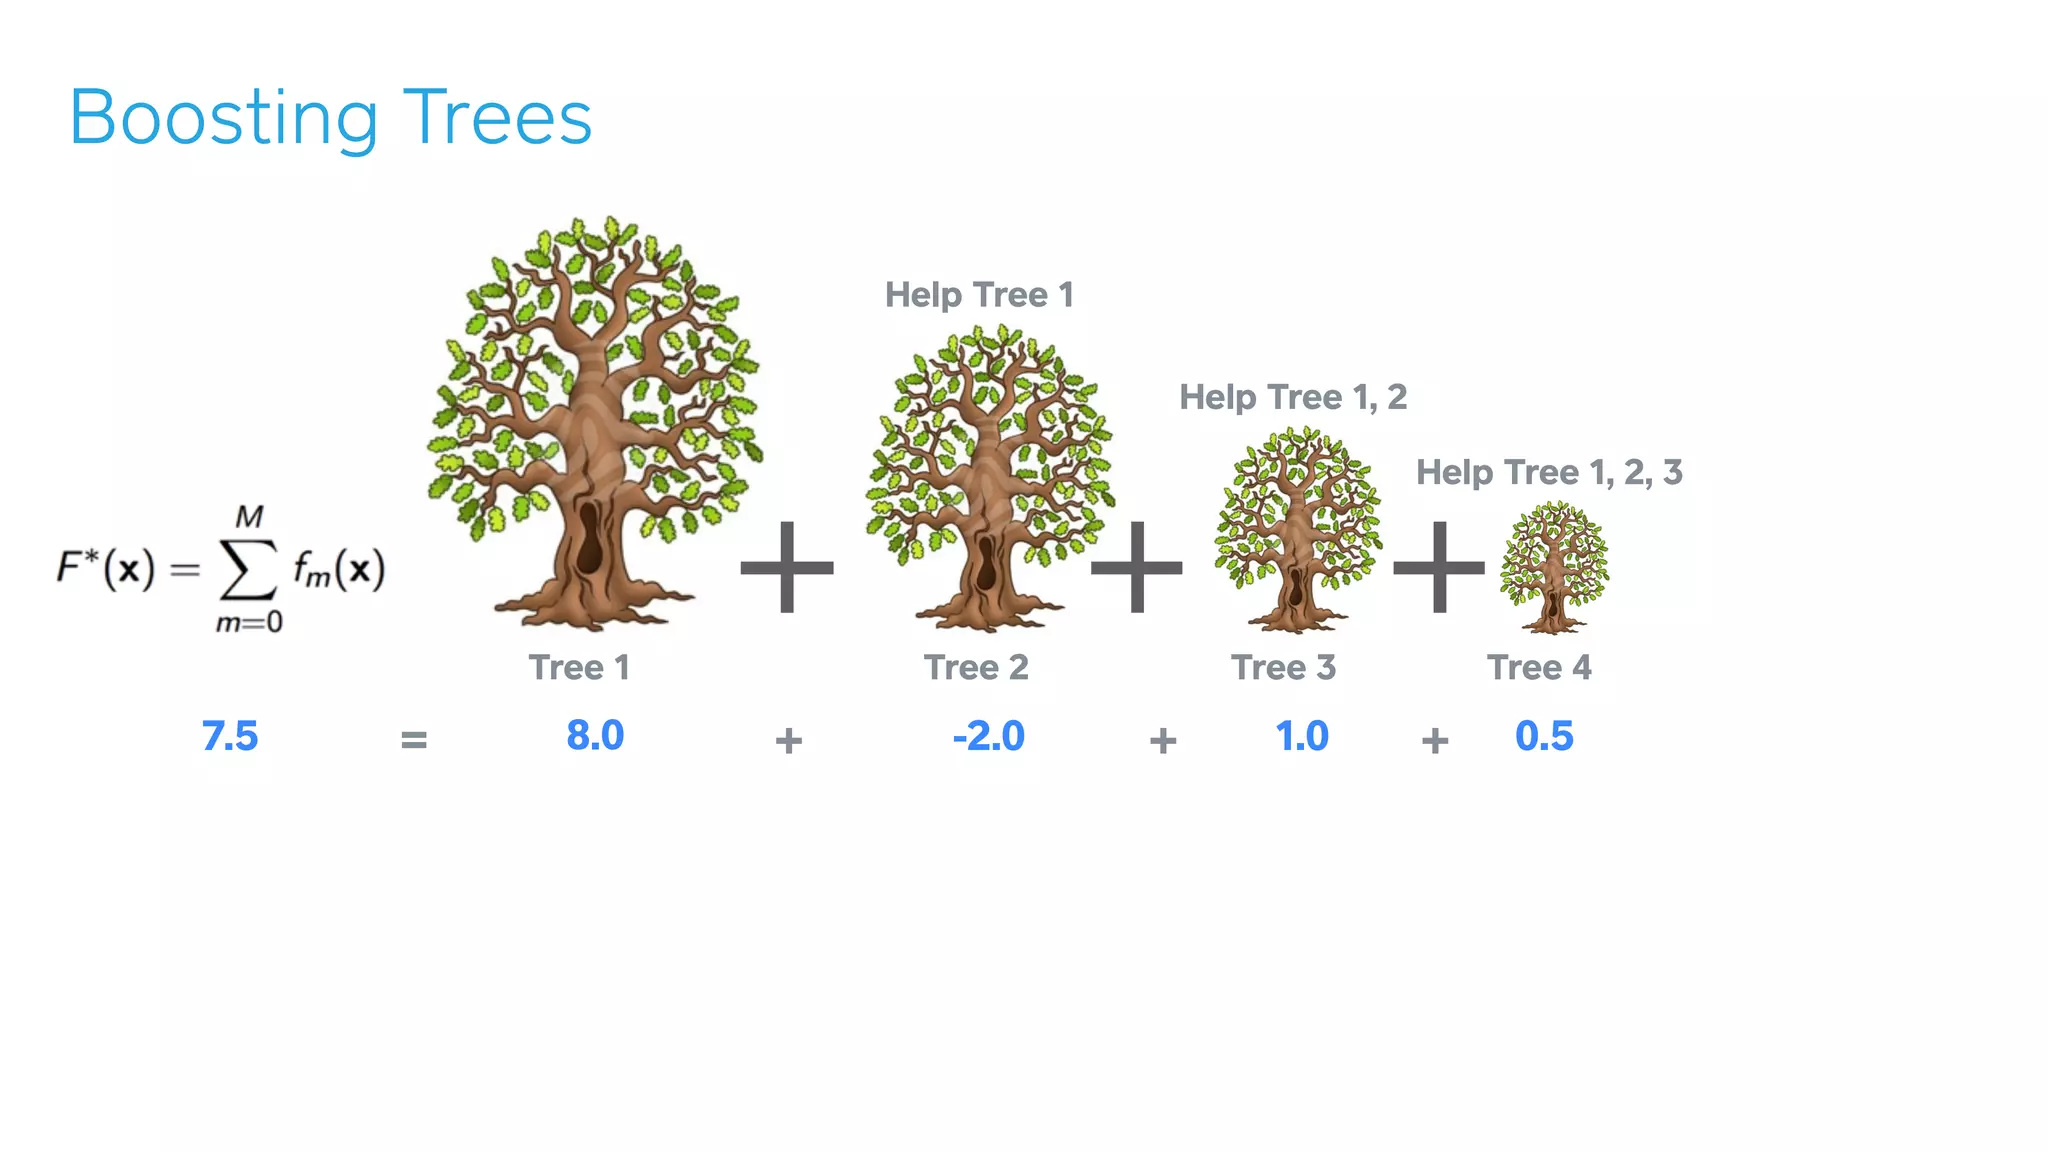
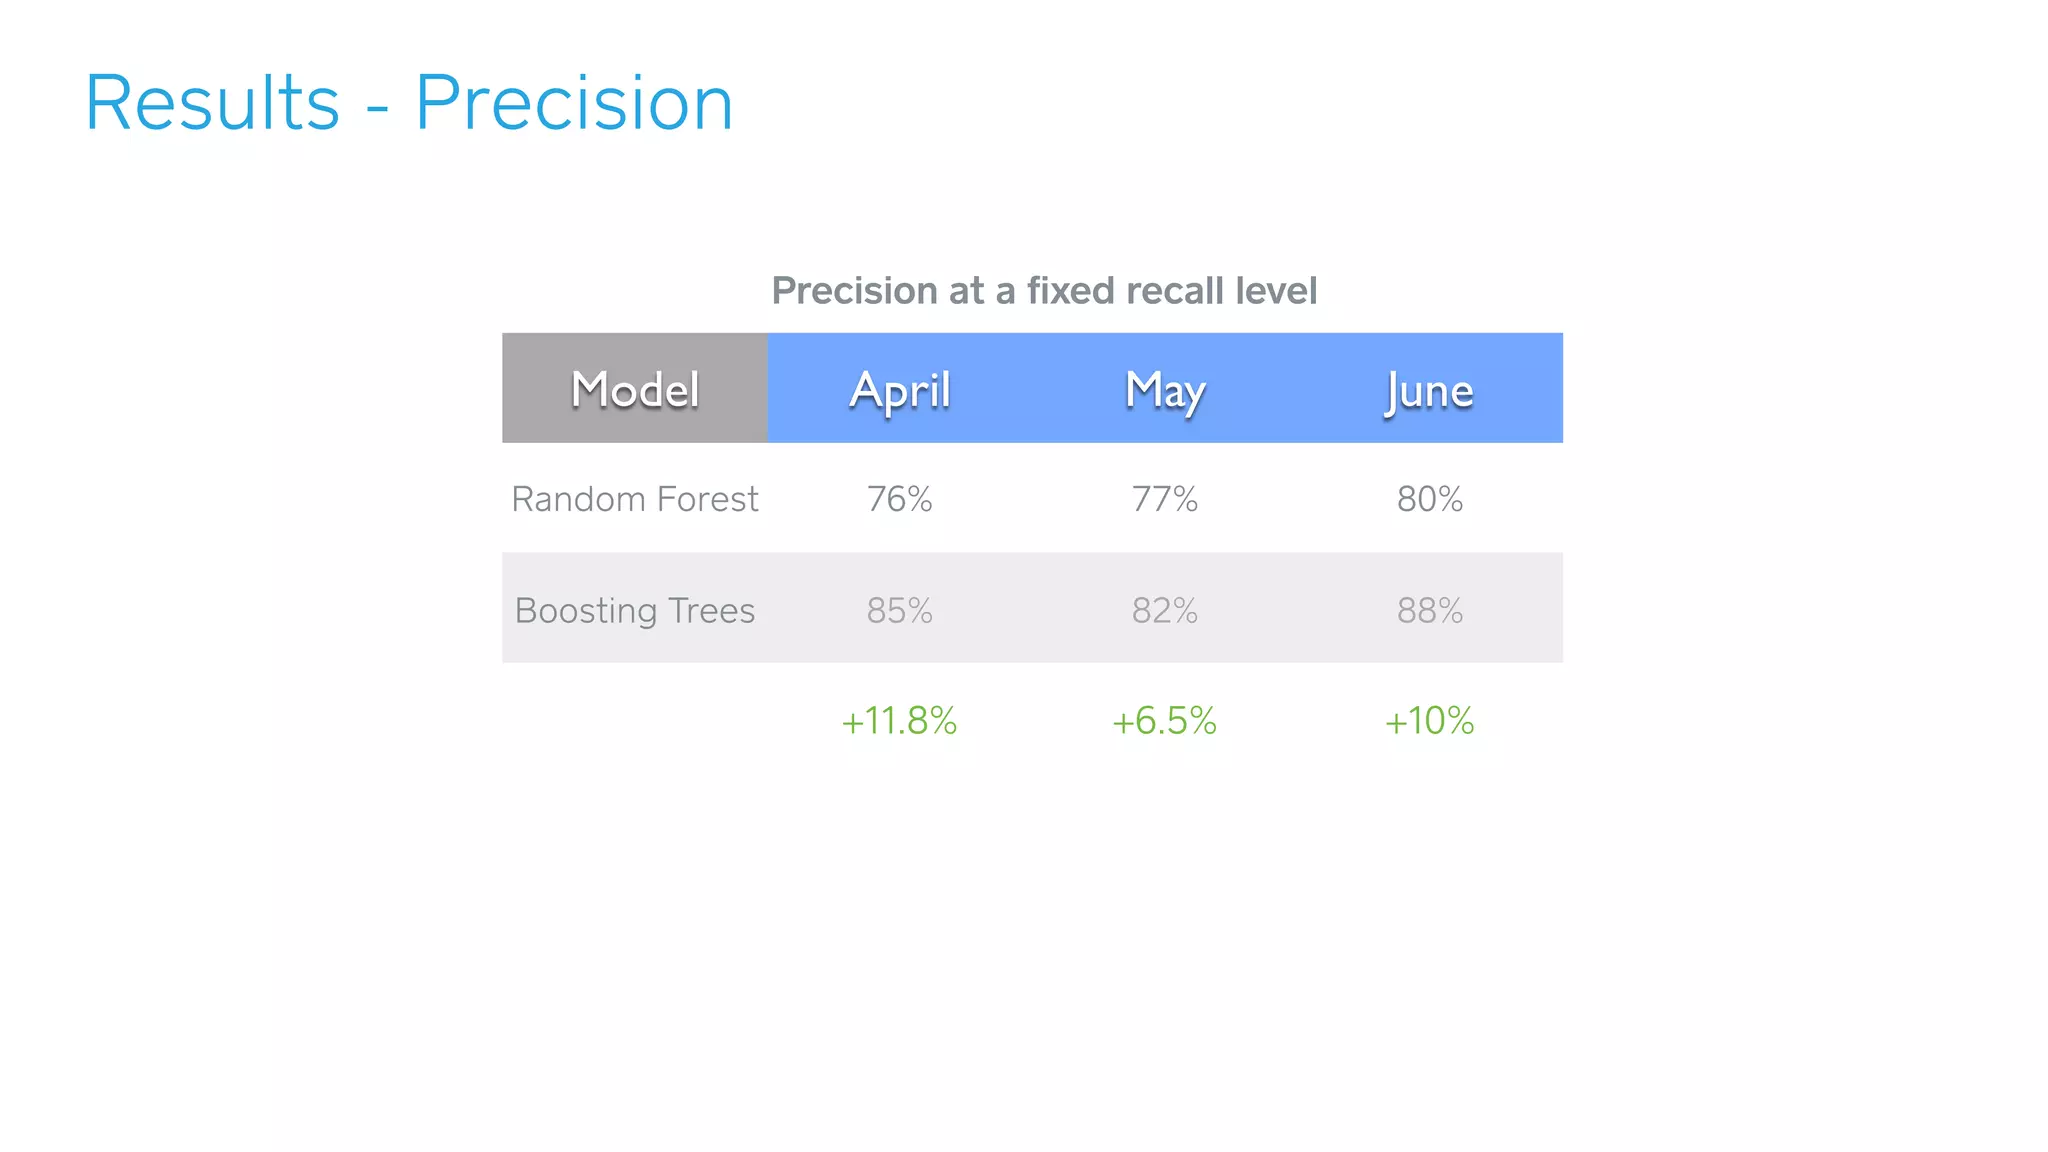
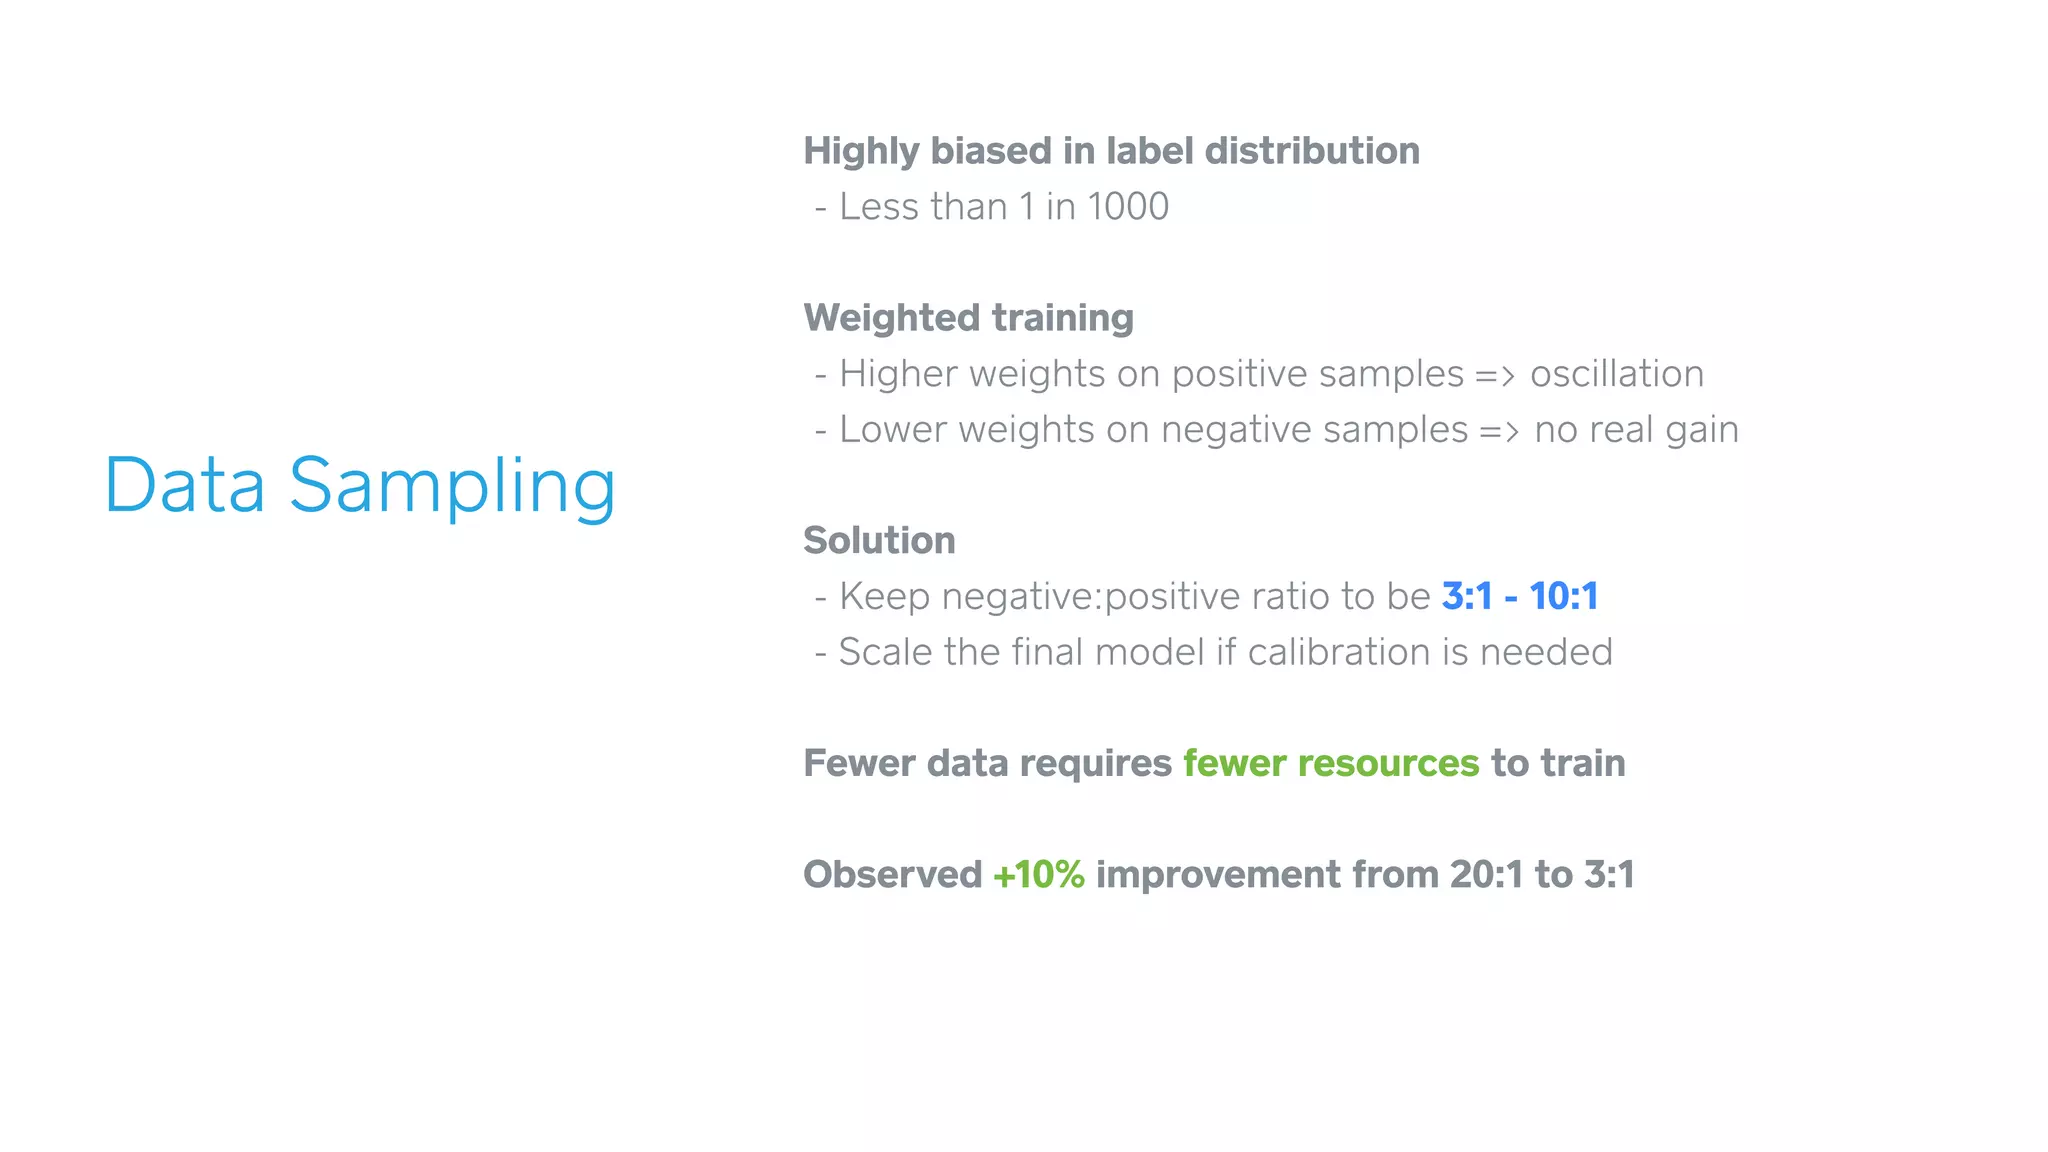


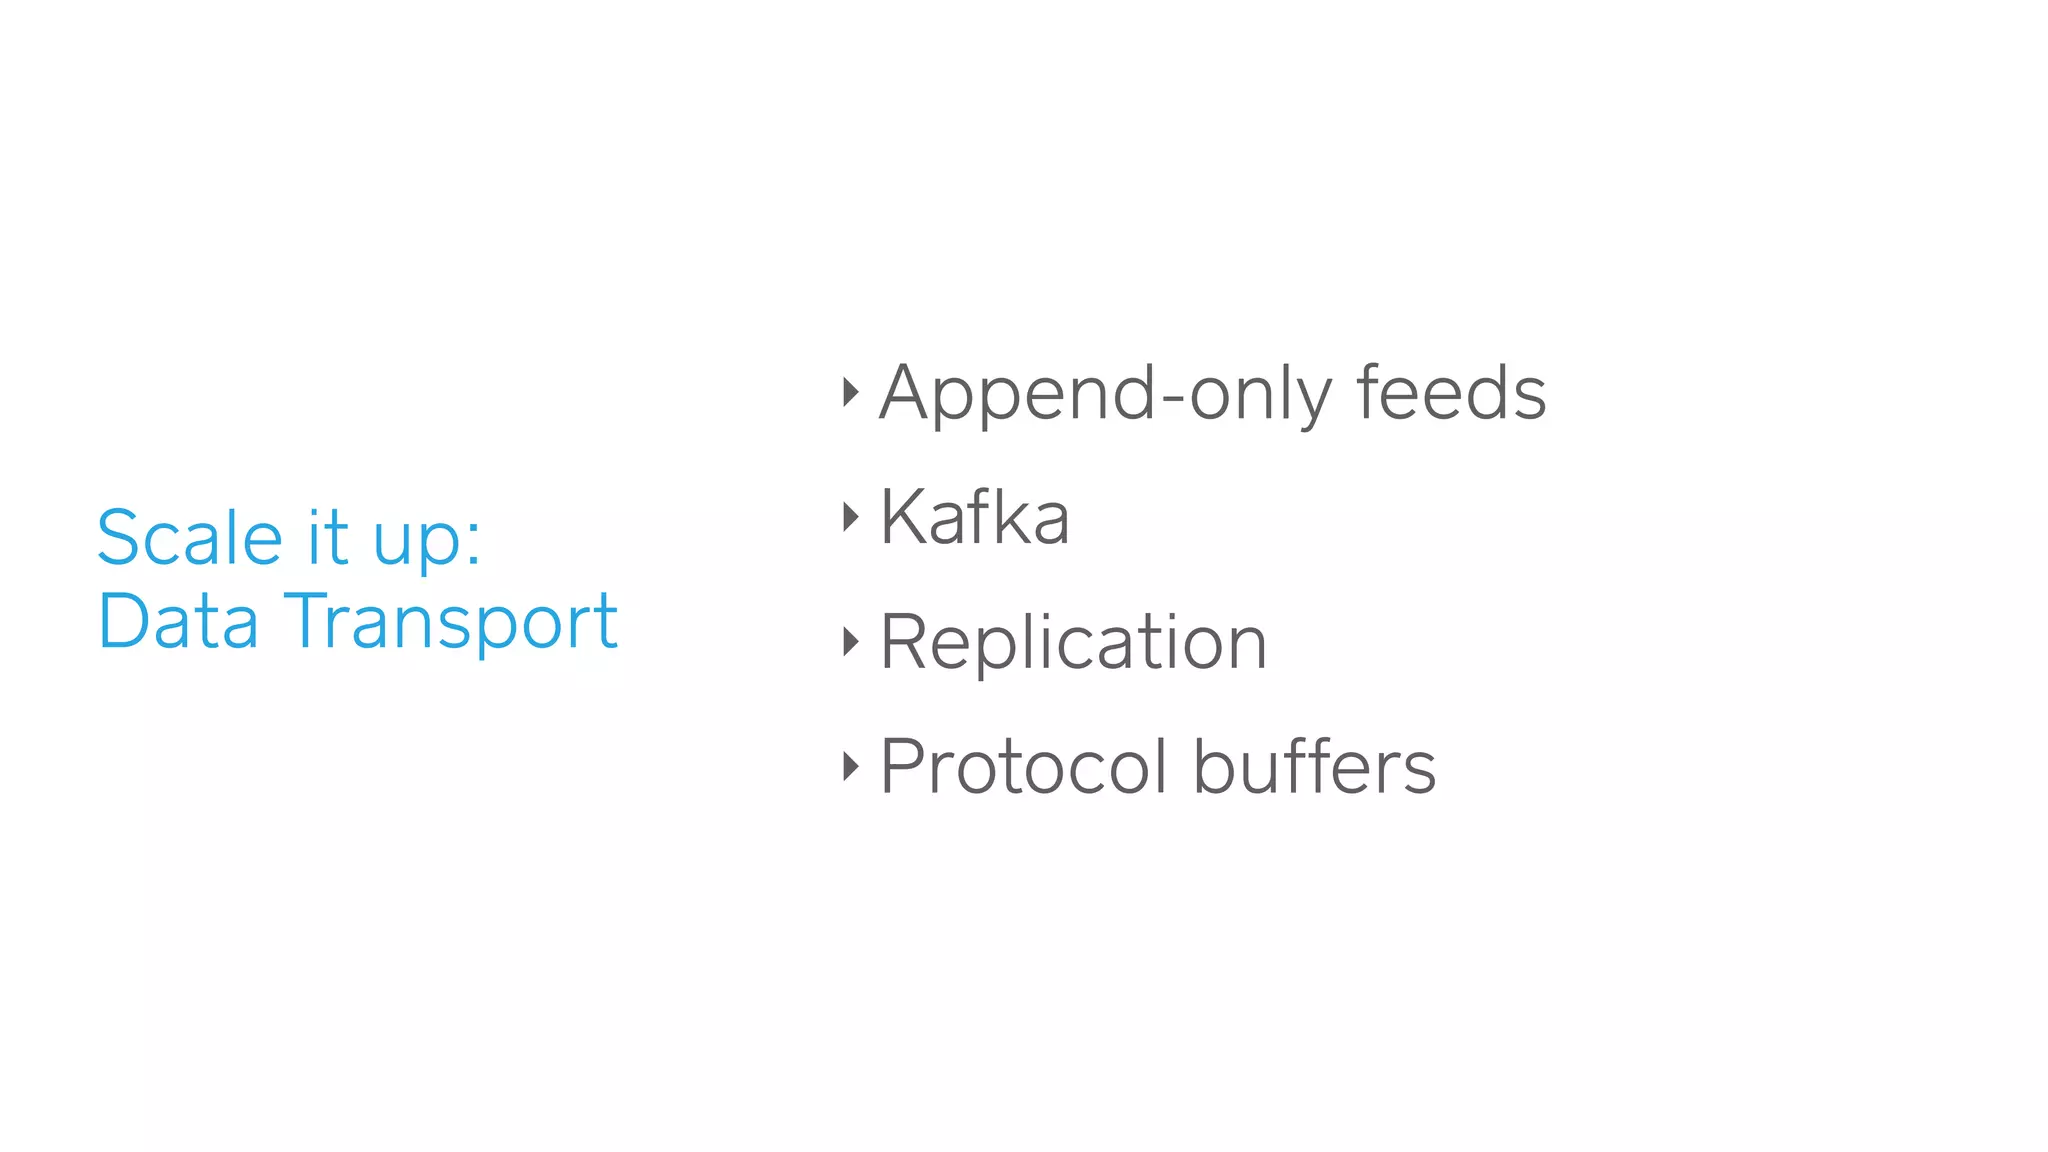

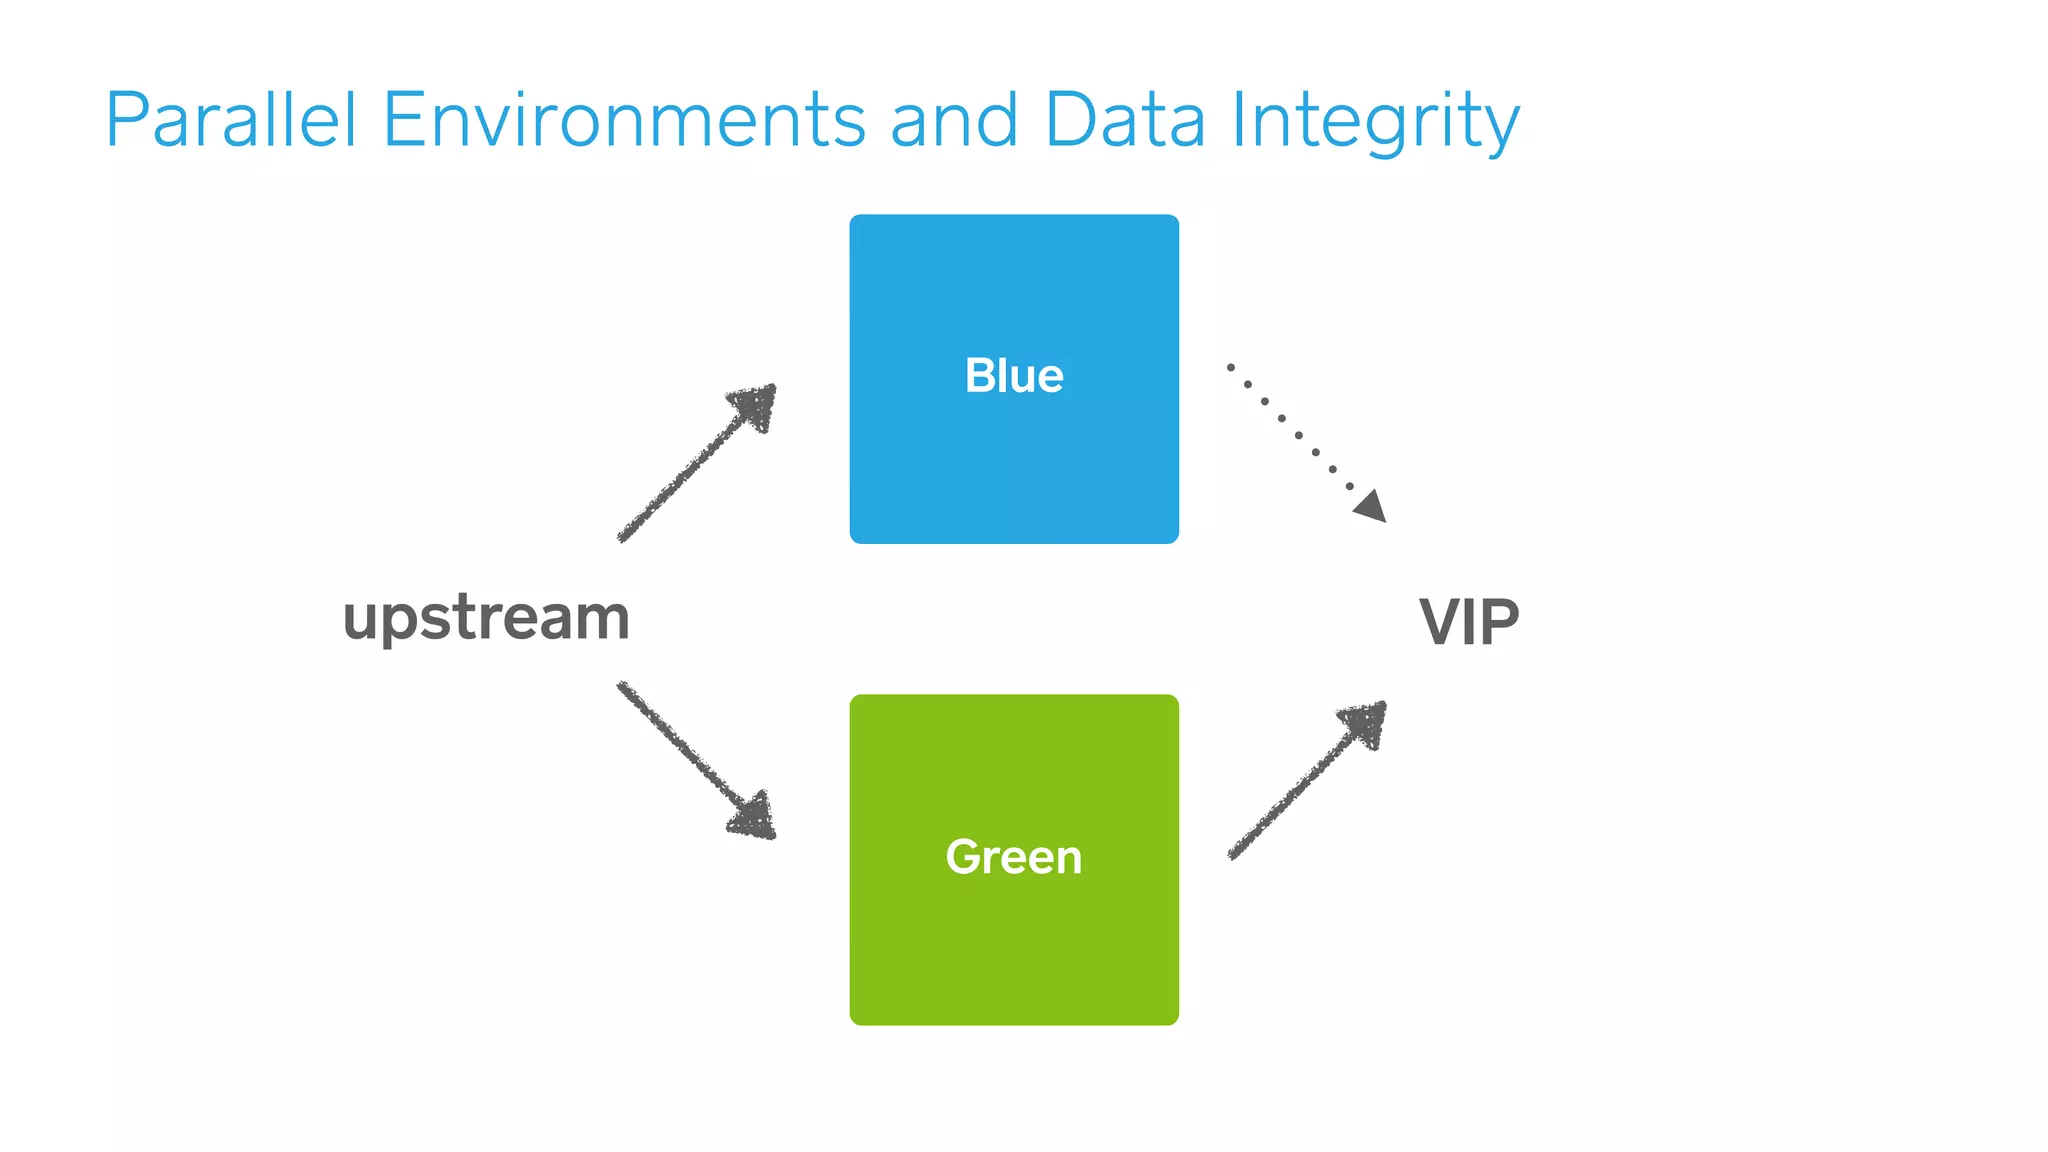
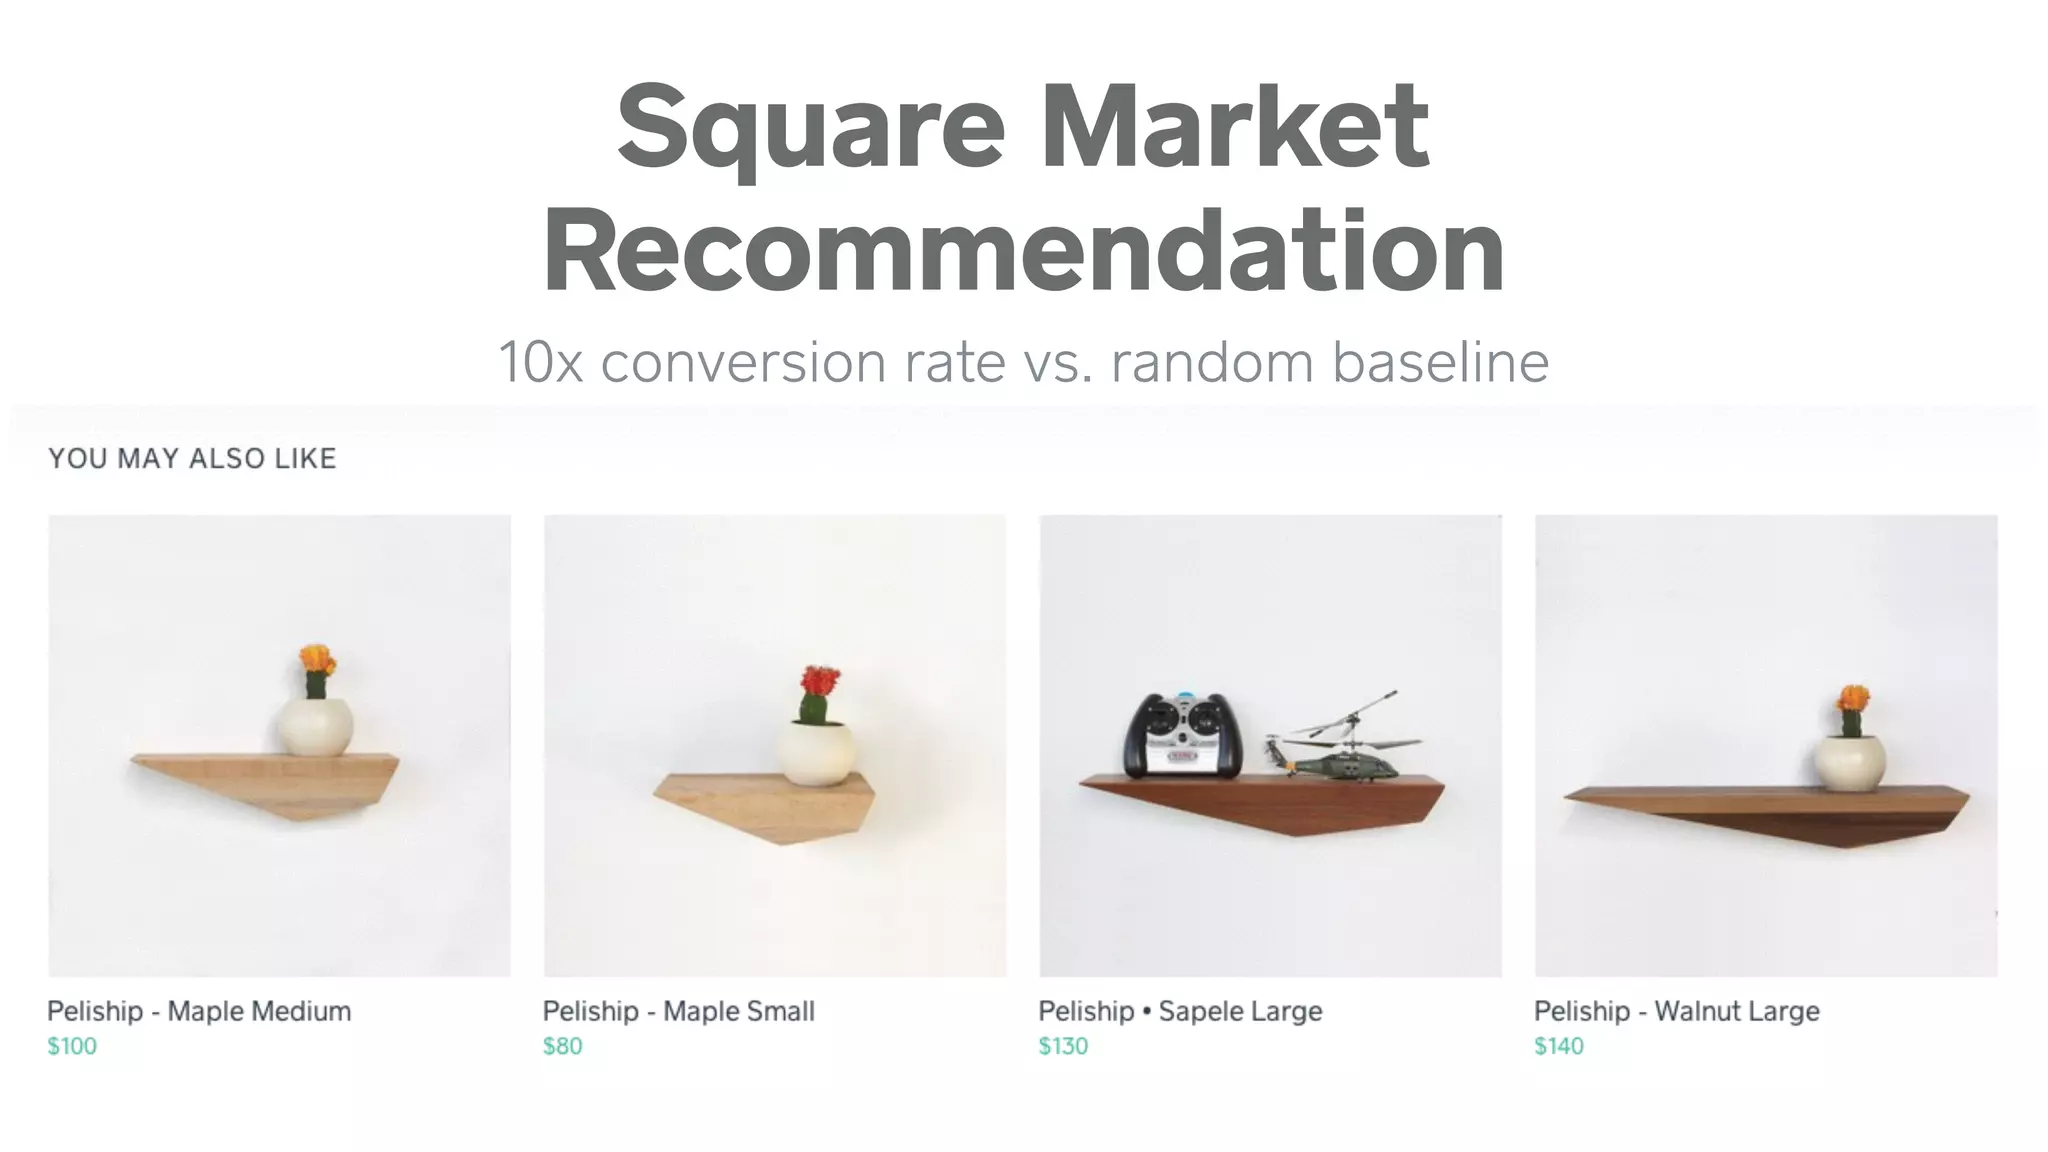

1) Square uses machine learning for fraud detection in payments and to power recommendations on its Square Market platform. 2) Random forests and gradient boosted trees are the primary algorithms used for fraud detection, achieving up to a 10-11% improvement over random forests alone. 3) Square has built scalable machine learning infrastructure including parallel environments, data transport systems, and a learning management system to support rapid model development and evaluation.


![Machine learning the high interest credit card of technical debt [PWL]](https://cdn.slidesharecdn.com/ss_thumbnails/machinelearning-thehighinterestcardoftechnicaldebtmeetup1-160911083514-thumbnail.jpg?width=640&height=640&fit=bounds)


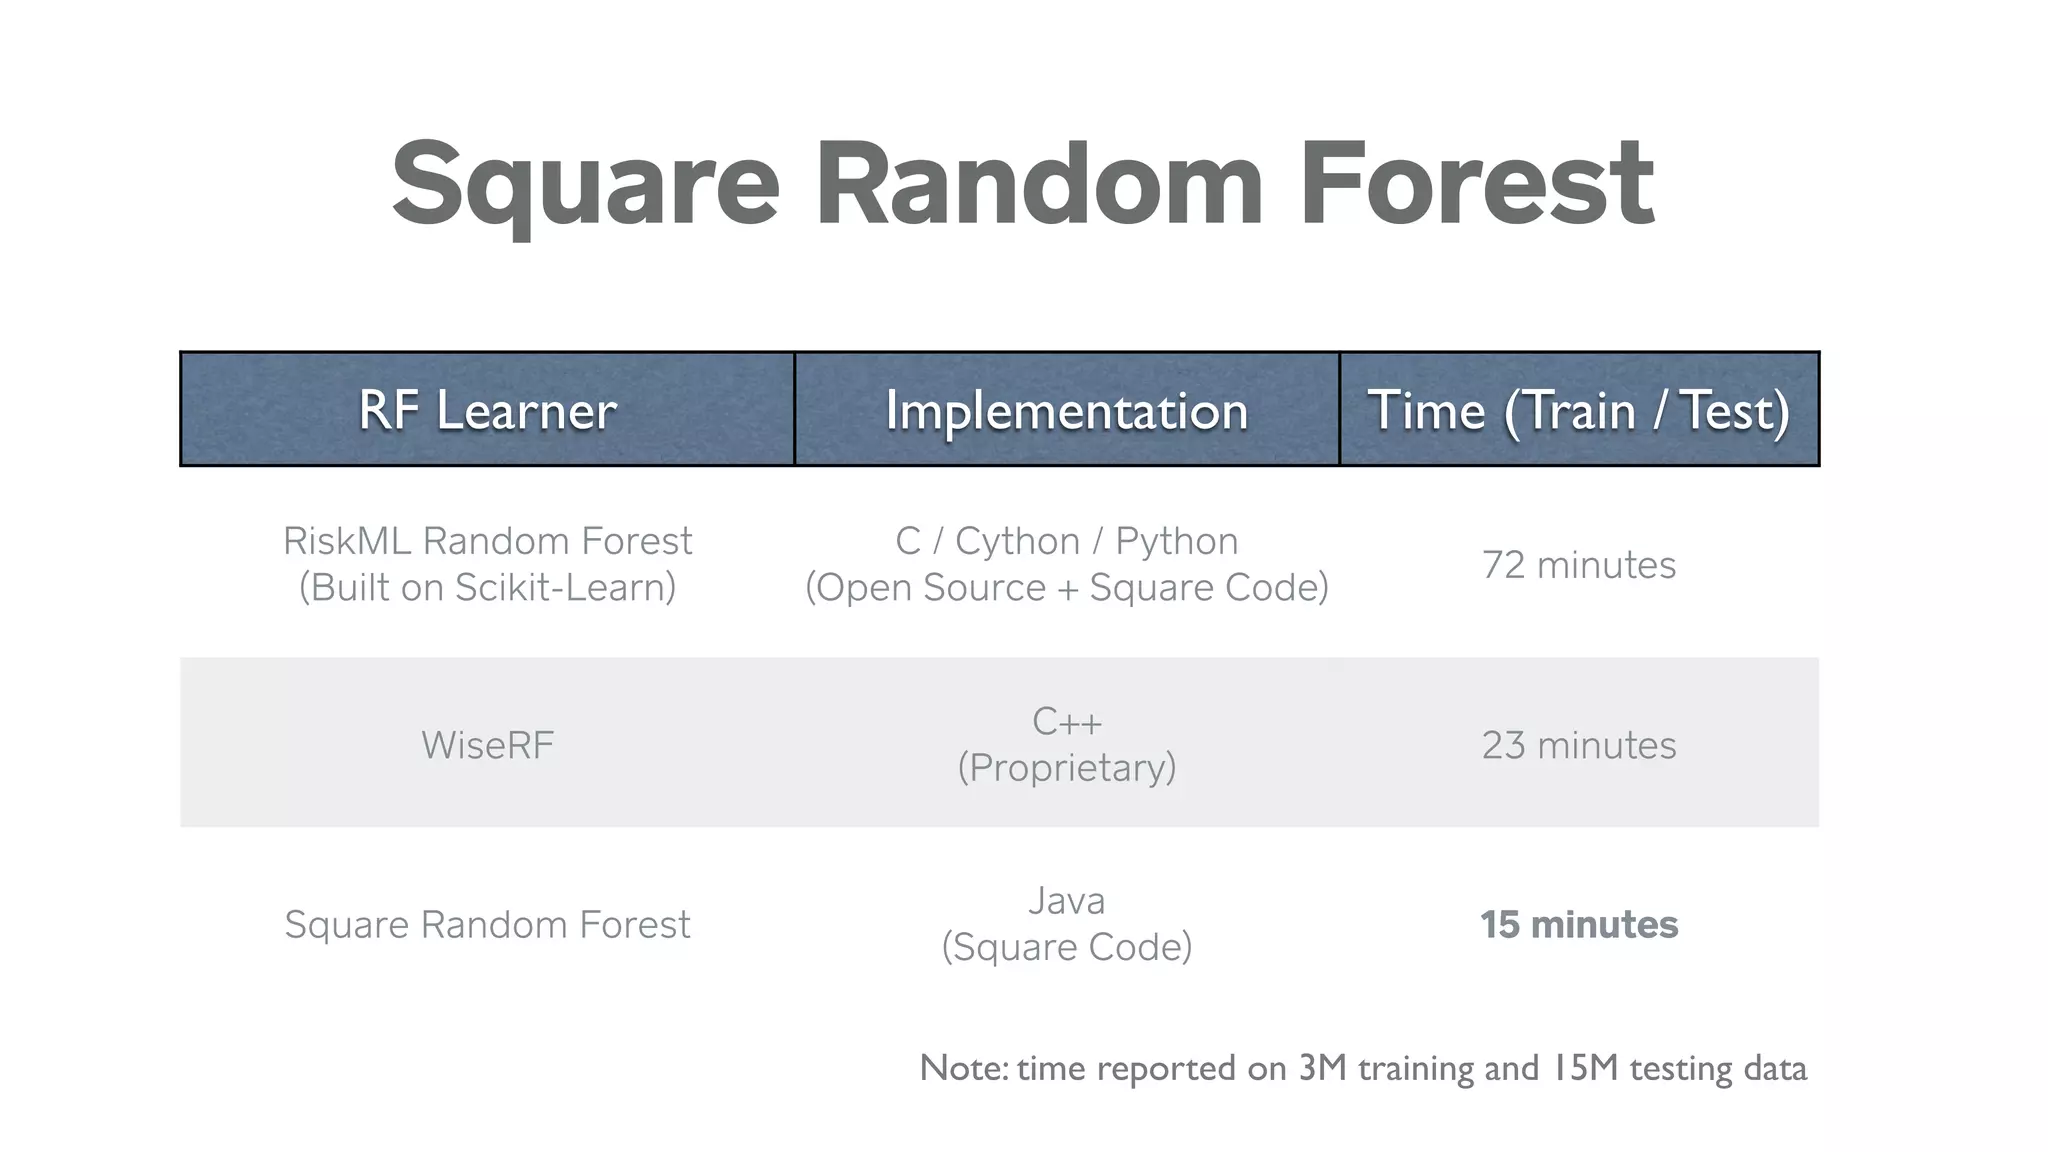
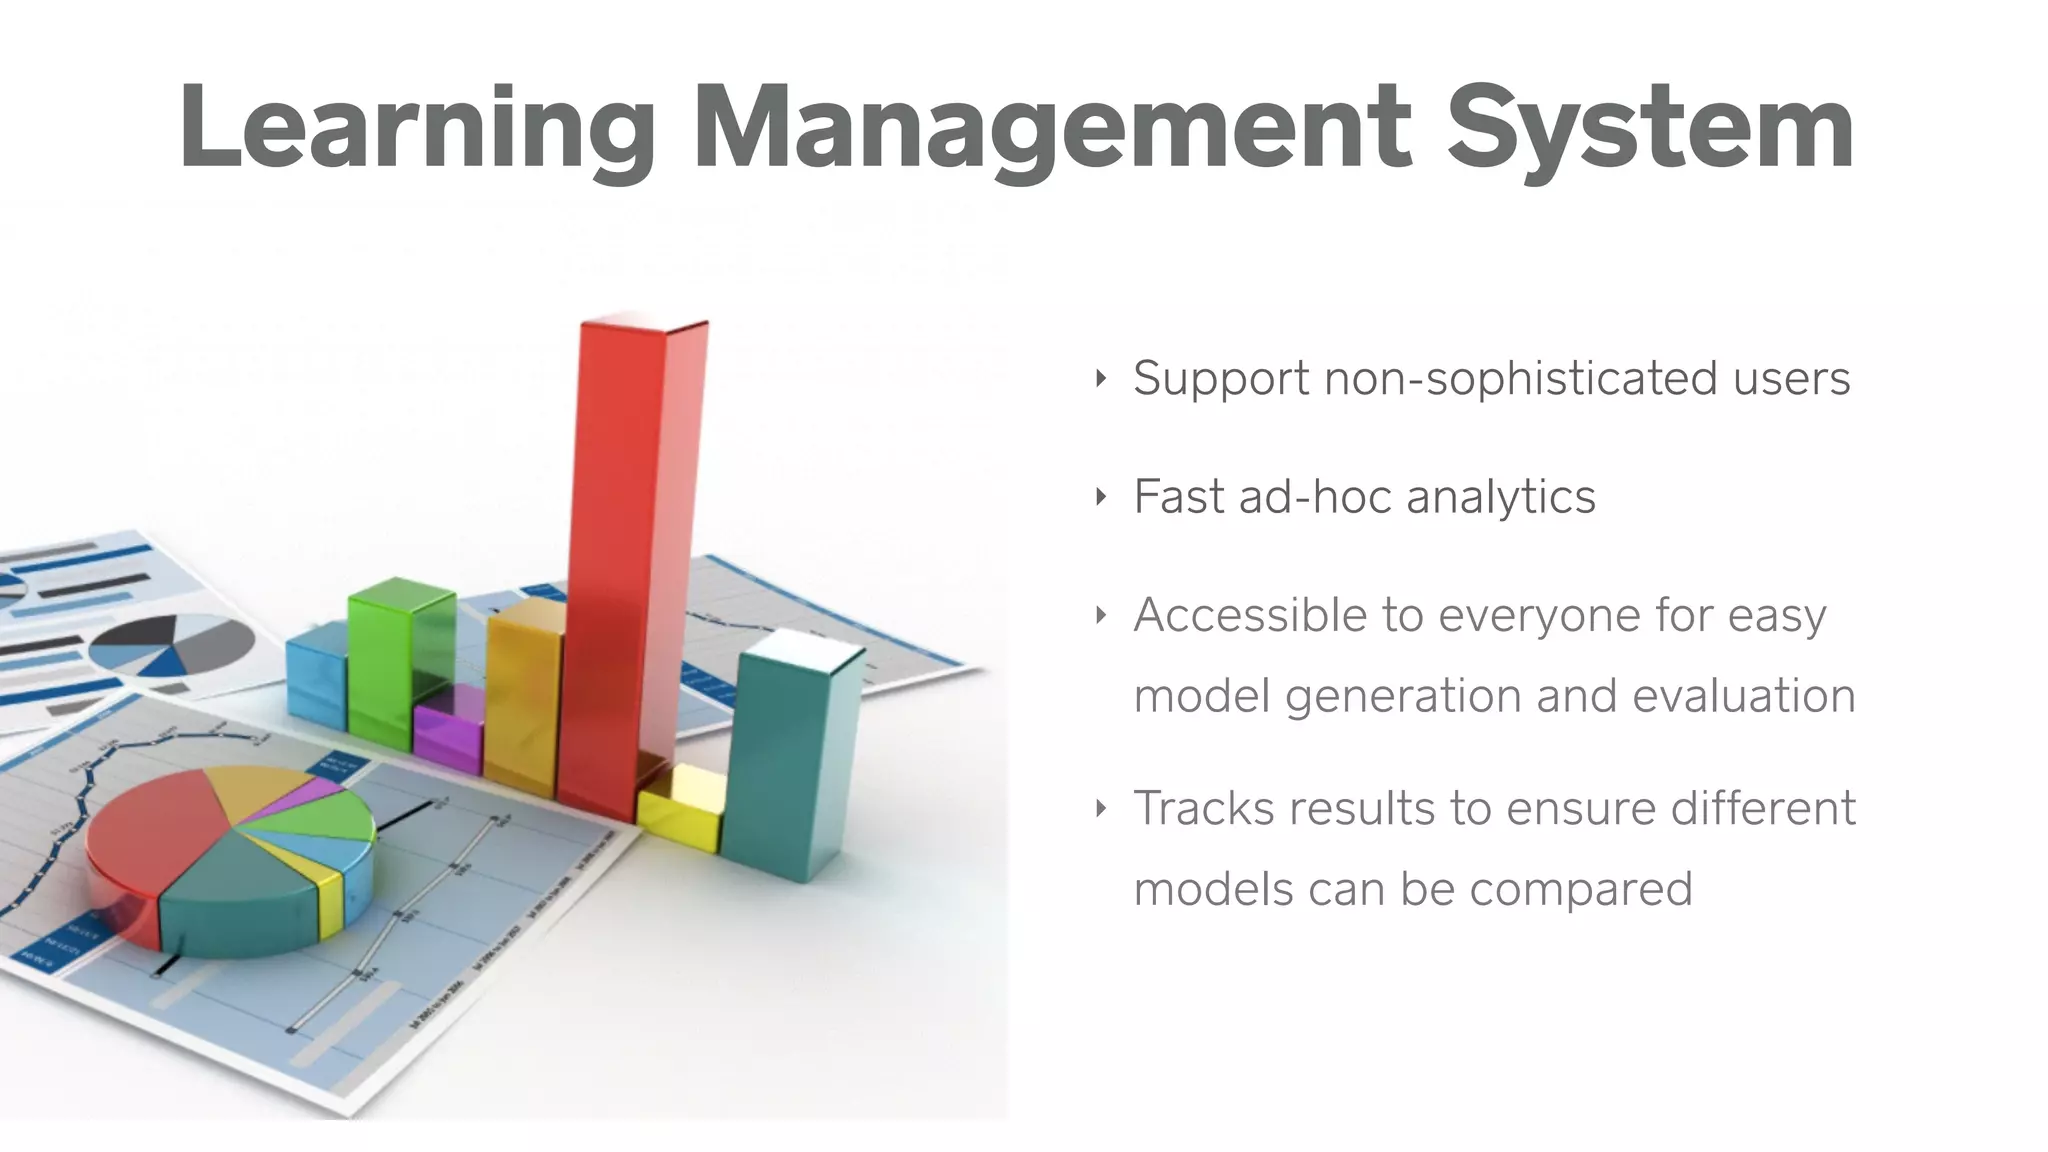
![DataEngConf SF16 - BYOMQ: Why We [re]Built IronMQ](https://cdn.slidesharecdn.com/ss_thumbnails/byomq-160414230807-thumbnail.jpg?width=640&height=640&fit=bounds)


