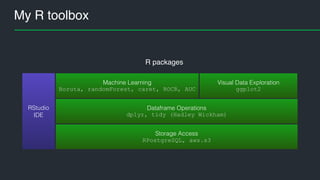
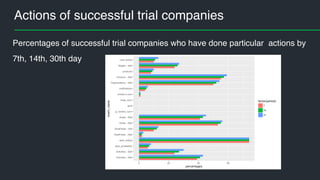
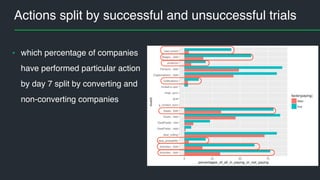
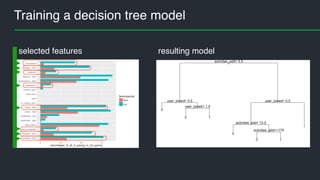
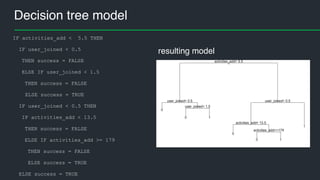
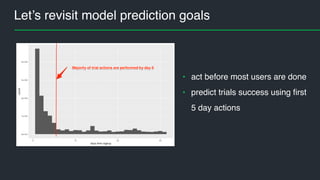
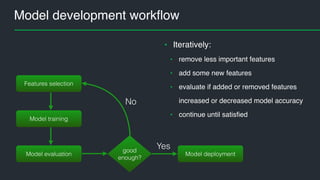
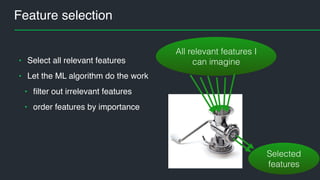
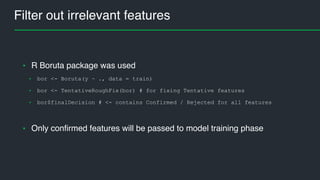
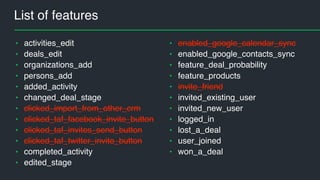
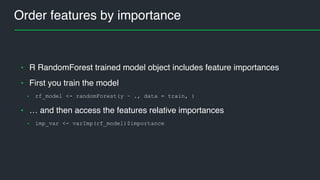
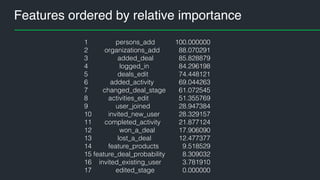
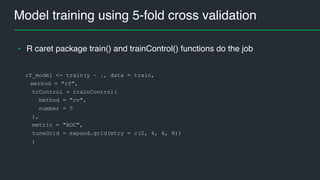
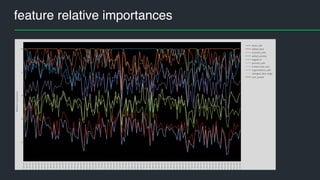
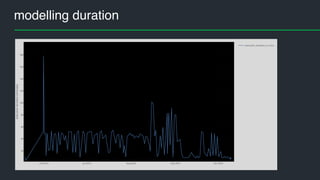
This document summarizes Andres Kull's presentation on machine learning applications at Pipedrive. Kull discusses how Pipedrive uses machine learning to predict trial conversion rates and the likelihood of deals closing. Key models include a decision tree to predict trial success based on user actions. Features are selected and ranked by importance, and a random forest model is trained with 5-fold cross-validation. The model is retrained daily and predictions are monitored for quality. Traces of model training and predictions are stored to explain results.


![Split data to training and test data
• inTrain <- createDataPartition(y = all_ev[y][,1], p = 0.7, list = FALSE)
• train <- all_ev[inTrain, ]
• test <- all_ev[-inTrain, ]
• training set: 70% of companies
• hold-out test set: 30% of companies
• R caret package createDataPartition() function was used to split data](https://image.slidesharecdn.com/machinelearninginaction-andreskull-161011183224/85/Machine-learning-in-action-at-Pipedrive-28-320.jpg)
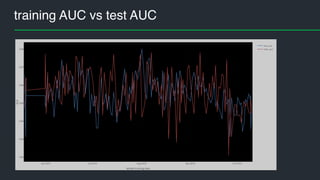
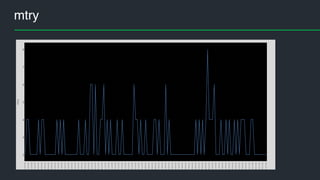
![Model evaluation
mtry <- rf_model$bestTune$mtry
train_auc <- rf_model$results$ROC[as.numeric(rownames(rf_model$bestTune))]
• model AUC on training data
• model AUC on test data
score <- predict(rf_model, newdata = test, type = "prob")
pred <- prediction(score[, 2], test[y])
test_auc <- performance(pred, "auc")
• AUC on training data 0.82..0.88
• AUC on test data 0.83..0.88
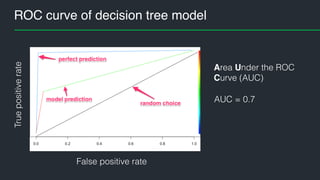
• Benchmark (decision tree) AUC = 0.7](https://image.slidesharecdn.com/machinelearninginaction-andreskull-161011183224/85/Machine-learning-in-action-at-Pipedrive-30-320.jpg)


![Hacking-Uncovered-How-People-Get-Hacked-and-How-to-Stay-Safe[1].pptx](https://cdn.slidesharecdn.com/ss_thumbnails/hacking-uncovered-how-people-get-hacked-and-how-to-stay-safe1-260130170011-4883a9c7-thumbnail.jpg?width=640&height=640&fit=bounds)


