Download as PDF, PPTX
![K-anonymity example
!mestamp customerId occupa!
on
gender amount business
2015-03-05 9218324 Engineer male 58.42 Waitrose
2015-03-06 324624 Cook female 118.90 Waitrose
2015-03-06
324624 Cook female 5.99 Abokado
Categorical bucket Day of
week
custome
rId
amount business
engineer-male,
student-male,
cook-female
Thursday 00003 [50-60] Waitrose
Friday 00012 [100--1
20]
Waitrose
Friday 00012 [0-10] Abokado](https://image.slidesharecdn.com/lanzarote-meetup-presentation-160717101218/75/The-Barclays-Data-Science-Hackathon-Building-Retail-Recommender-Systems-based-on-Customer-Shopping-Behaviour-Gianmario-Spacagna-Pirelli-11-2048.jpg)
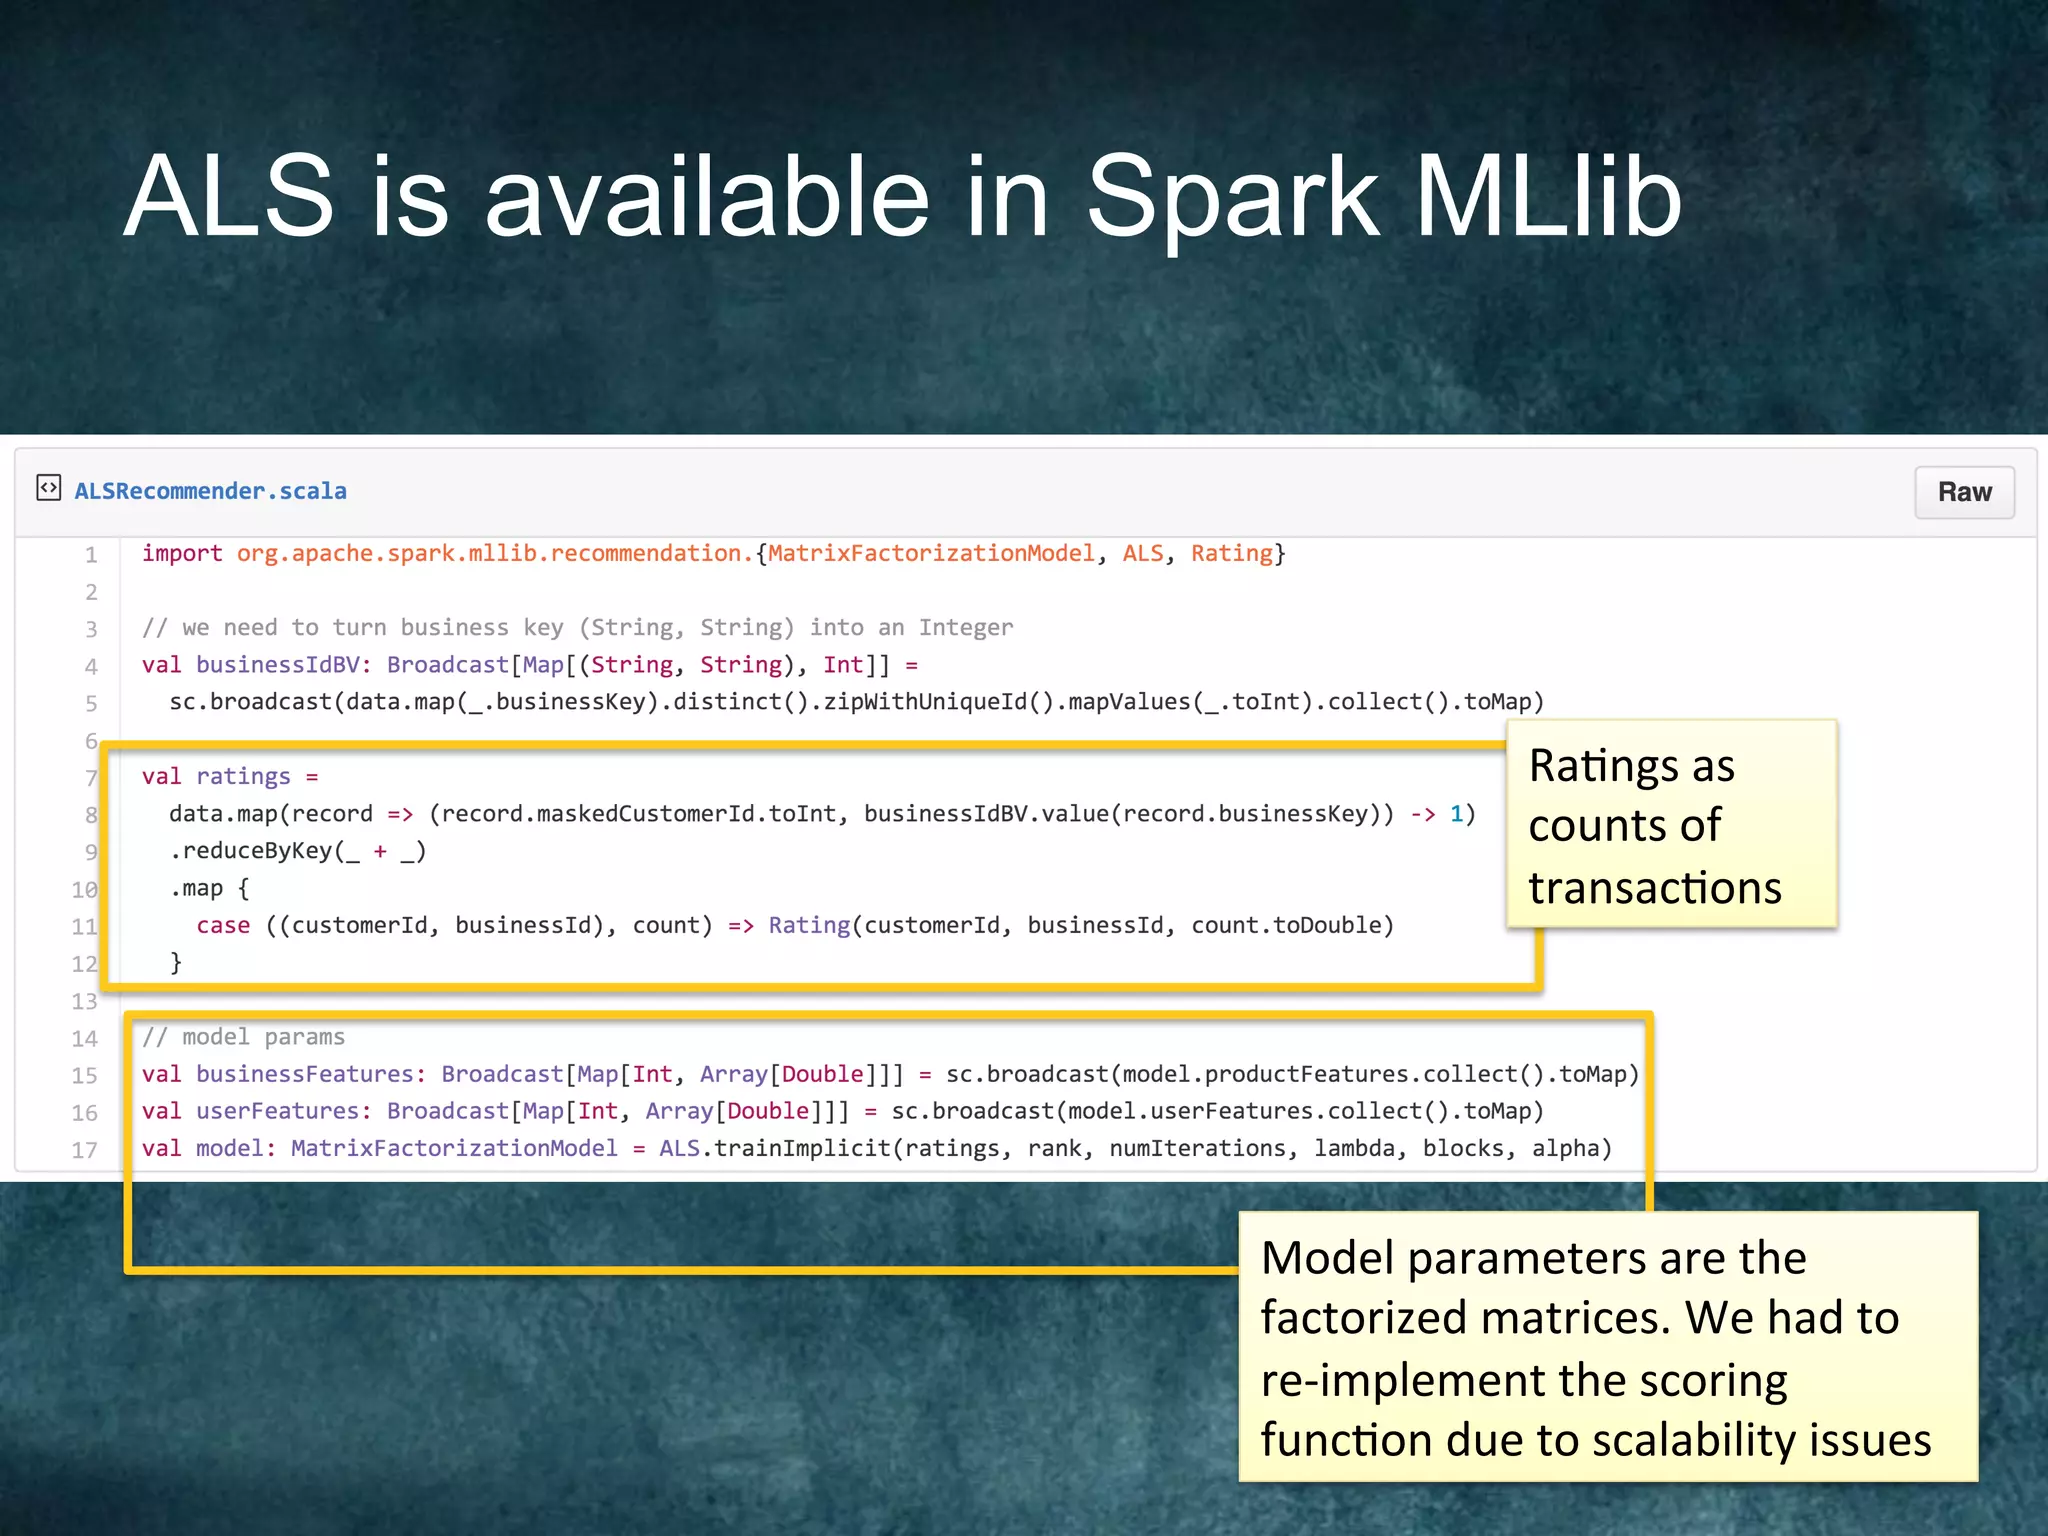

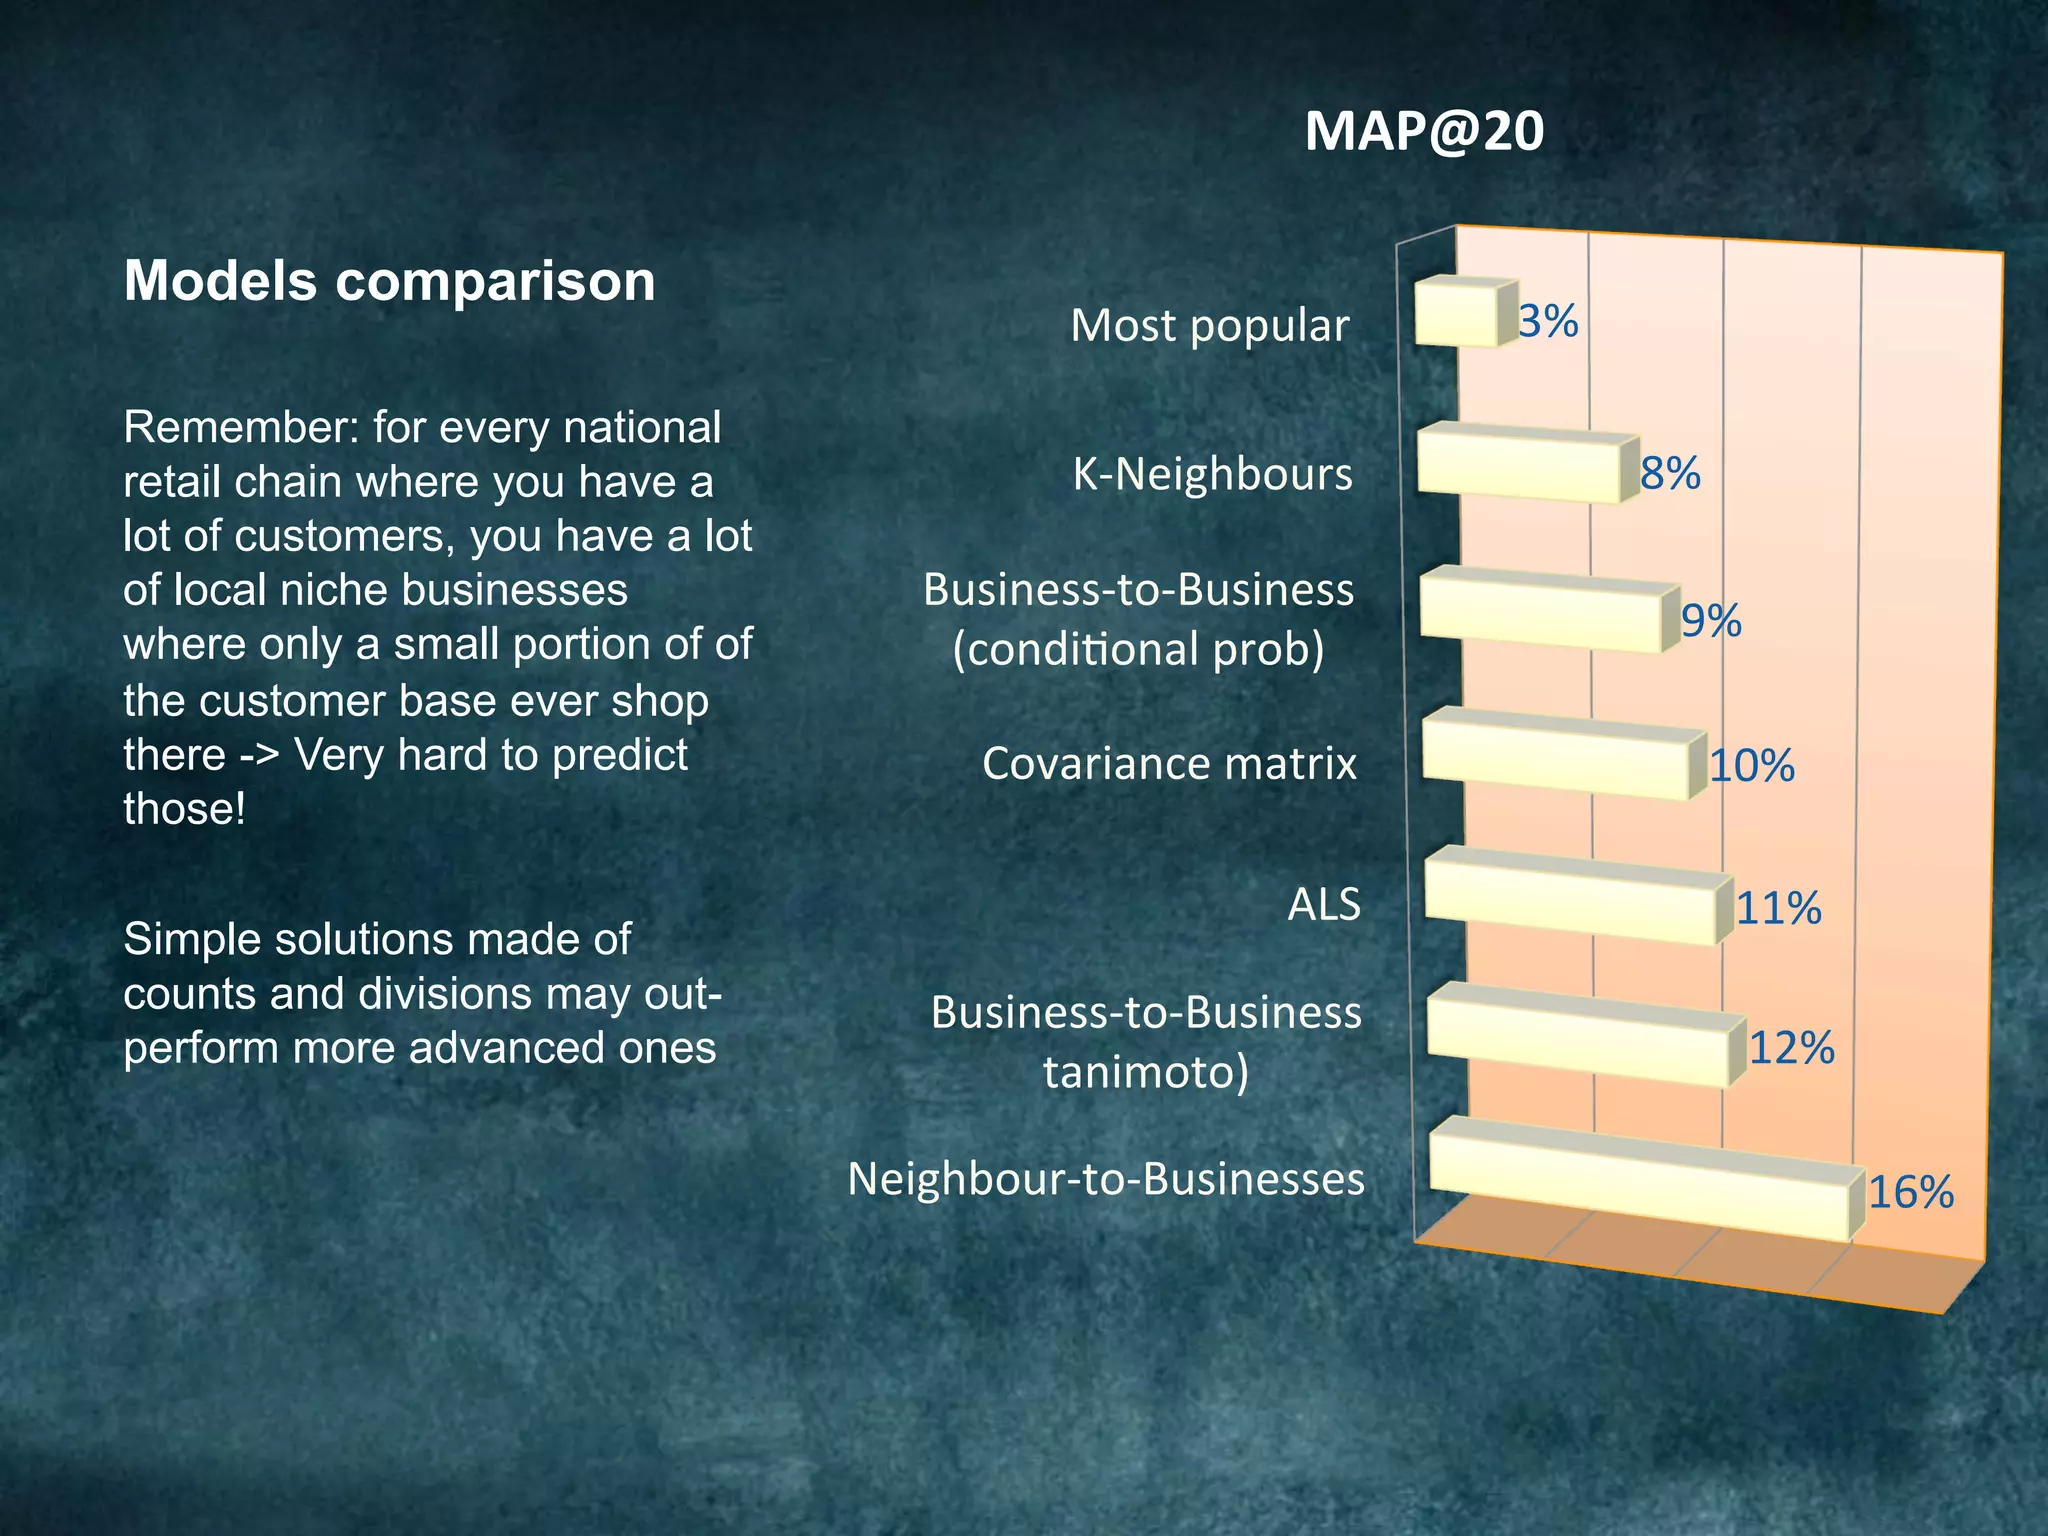

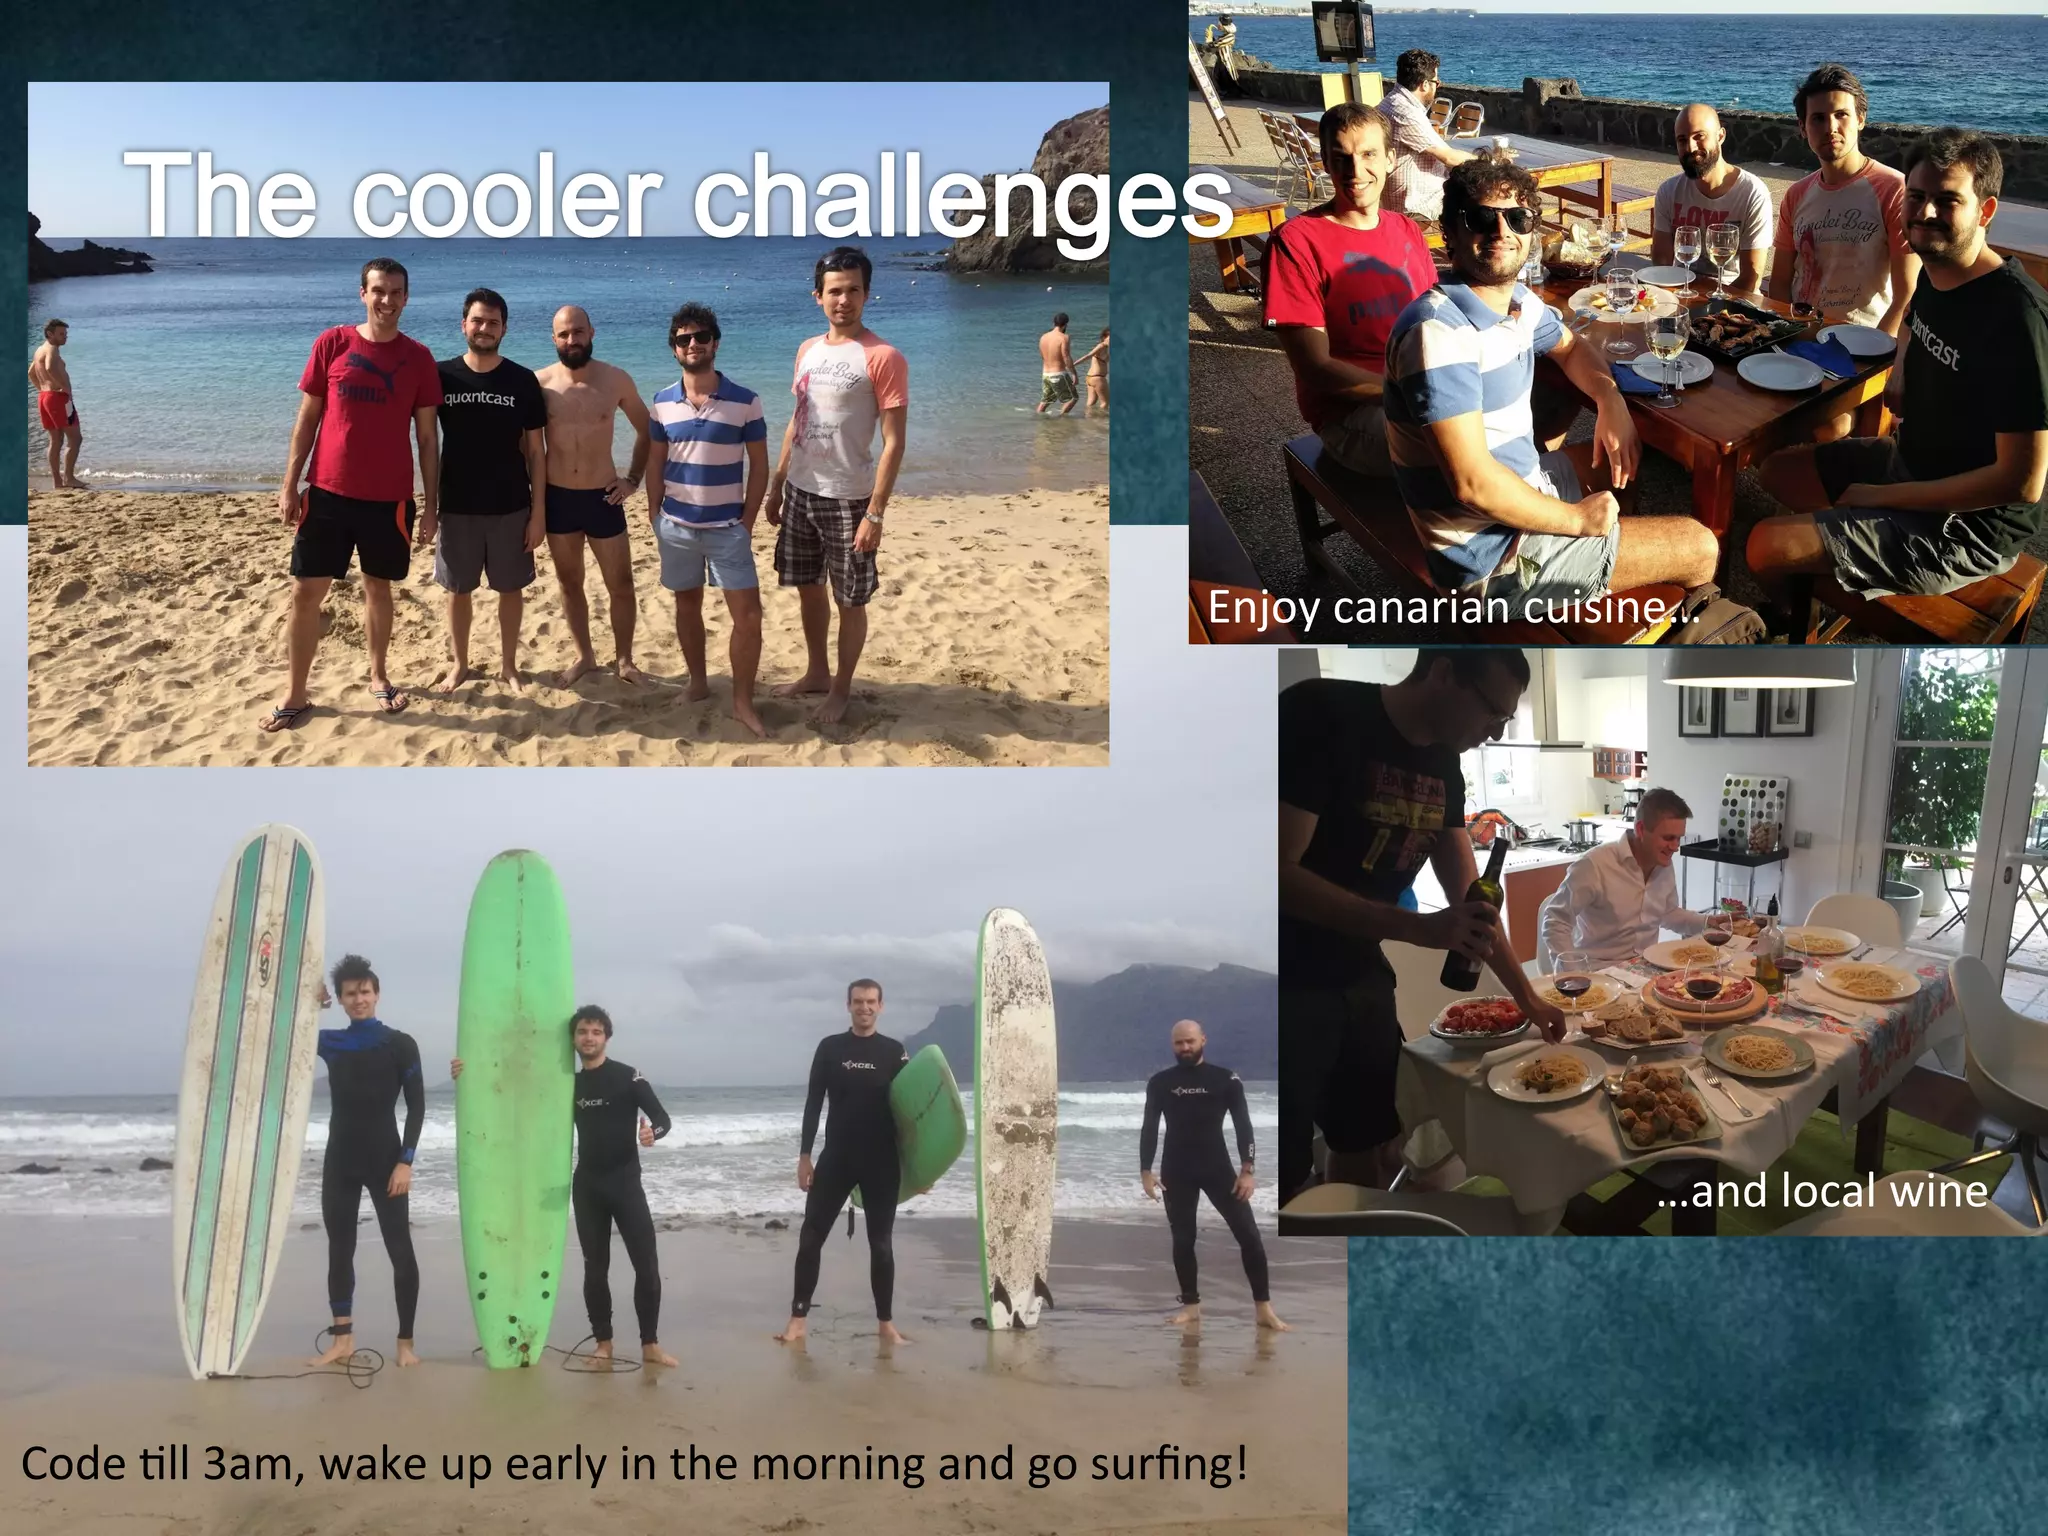
The Barclays Data Science Hackathon aimed to develop retail recommender systems based on customer shopping behavior, with a team focused on rapid prototyping using Spark and Scala. The competition involved building a recommend system in a week with technical challenges such as limited infrastructure and the need for quick development cycles. The hackathon led to innovative solutions and highlighted the importance of teamwork and creativity in a conducive environment for data science projects.


![[DSC Europe 25] Vid Stimac - Policy Parsimony: Between Oversimplifying and Ov...](https://cdn.slidesharecdn.com/ss_thumbnails/eqlepagzqp2rhg3gbluh-dsc-stimac-251120-251205090438-059e7f54-thumbnail.jpg?width=640&height=640&fit=bounds)
![[DSC Europe 25] Jim Sterne - Adopting Generative AI Capabilities Into the Ent...](https://cdn.slidesharecdn.com/ss_thumbnails/sxhpofuorcagxsaulkmt-3-251204082258-7e66bc48-thumbnail.jpg?width=640&height=640&fit=bounds)


![[DSC Europe 25] Goran Obradovic - The Rise of Sovereign AI: Building the Regi...](https://cdn.slidesharecdn.com/ss_thumbnails/7nw2xxixrxqdxvrb5wca-6-251205085714-ab09a2ac-thumbnail.jpg?width=640&height=640&fit=bounds)
![[DSC Europe 25] Nikola Rajovic - Hardware Technologies Under the Hood: RISC-V...](https://cdn.slidesharecdn.com/ss_thumbnails/o2gptrmtoyqndgoshwgq-dsc2025-tenstorrent-rajovic-251205090438-814685f5-thumbnail.jpg?width=640&height=640&fit=bounds)


