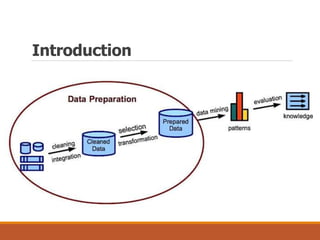
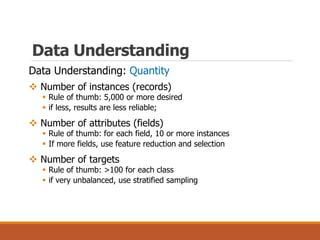
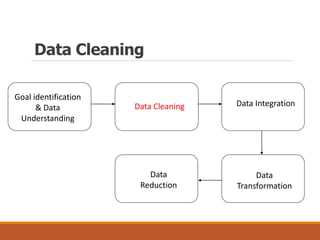
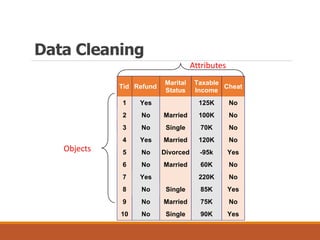
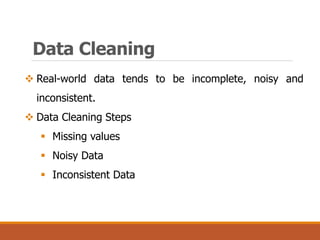
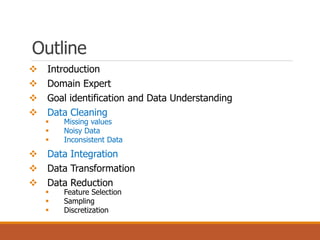
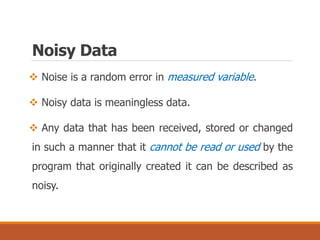
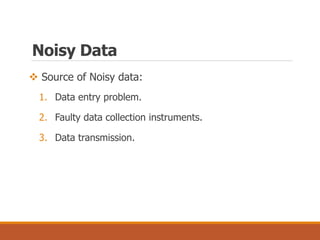
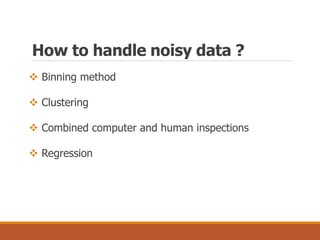
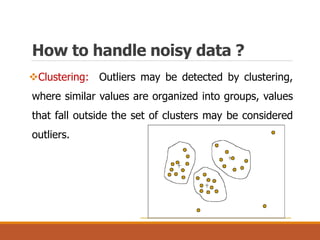
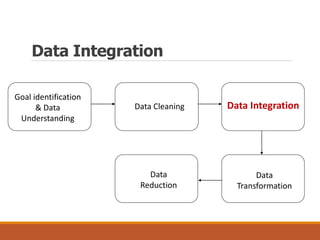
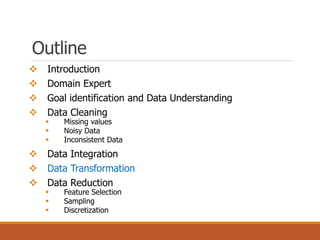
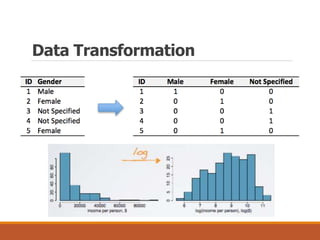
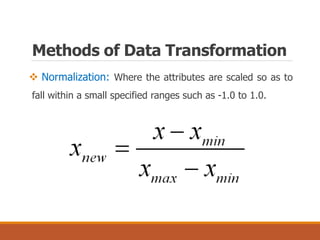
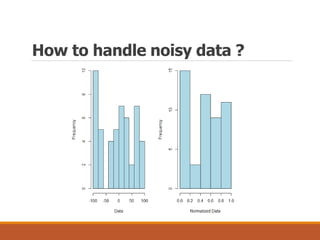
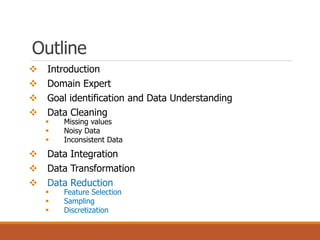
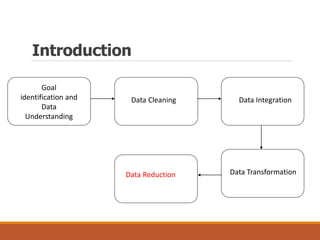
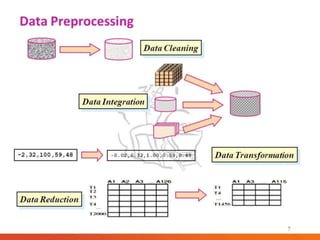
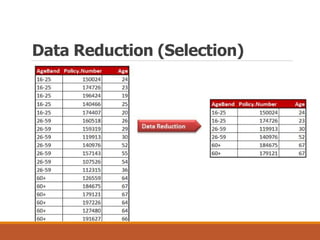
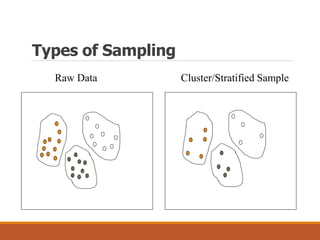
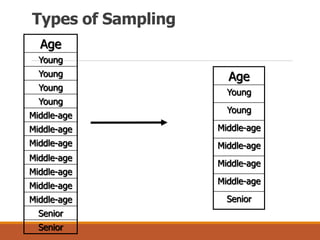
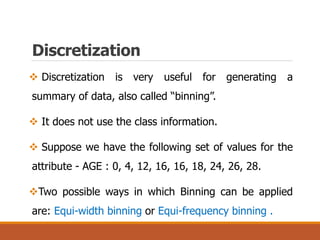
Data preparation and processing
Mahmoud Rafeek Alfarra
http://mfarra.cst.ps
University College of Science & Technology- Khan yonis
Development of computer systems
2016
Chapter 2 – Lecture 1
Outline
 Introduction
 Domain Expert
 Goal identification and Data Understanding
 Data Cleaning
 Missing values
 Noisy Data
 Inconsistent Data
 Data Integration
 Data Transformation
 Data Reduction
 Feature Selection
 Sampling
 Discretization
Introduction
 The real –world database typically used in data
mining may have millions of records and thousands of
variables. It is noisy and has missing and inconsistent
values.
Data quality is a key issue with data mining so data
preparation is a necessary step for serious, effective,
real-world data mining.
Introduction
To increase the accuracy of the mining, has to
perform data preprocessing.
Otherwise, garbage in => garbage out
Data Preparation estimated to take 70-80% of the
time and effort.
Introduction
Domain Expertise
 Data quality expert: “We found these strange records
in your database after running sophisticated
algorithms!”
 Domain Experts: “Oh, those apples - we put them
in the same baskets as oranges because there are too
few apples to bother. Not a big deal. We knew that
already.”
Domain Expertise
Domain Expertise is important for understanding the
data, the problem and interpreting the results.
“The counter resets to 0 if the number of calls exceeds N”.
“The missing values are represented by 0, but the default billed
amount is 0 too.”
Insufficient Domain Expertise is a primary cause of
poor Data Quality– data are unusable.
Goal Identification
 To obtain the highest benefit from data mining, there
must be a clear statement of the business objectives.
 The first and most important step in any targeting-
model project is to establish a clear goal and develop a
process to achieve that goal.
Goal Identification
 Example of Goal for business company are:
 You want to attract new customers
 You want to avoid high -risk customers
 You want to understand the characteristics of your current customers?
 You want to make your unprofitable customers more profitable?
 You want to retain your profitable customers?
 You want to win back your lost customers?
 You want to improve customer satisfaction?
 You want to increase sales?
 You want to reduce expenses
Data Understanding
 Starts with an initial data collection and proceeds with
activities in order to get familiar with the data, to
identify data quality problems, to discover first closes
into the data.
Data Understanding
Data Understanding: Relevance:
 What data is available for the task?
 Is this data relevant?
 Is additional relevant data available?
 How much historical data is available?
 Who is the data expert ?
Data Understanding
Data Understanding: Quantity
 Number of instances (records)
 Rule of thumb: 5,000 or more desired
 if less, results are less reliable;
 Number of attributes (fields)
 Rule of thumb: for each field, 10 or more instances
 If more fields, use feature reduction and selection
 Number of targets
 Rule of thumb: >100 for each class
 if very unbalanced, use stratified sampling
Data Cleaning
Goal identification
& Data
Understanding
Data Cleaning Data Integration
Data
Transformation
Data
Reduction
Data Cleaning
Tid Refund
Marital
Status
Taxable
Income
Cheat
1 Yes 125K No
2 No Married 100K No
3 No Single 70K No
4 Yes Married 120K No
5 No Divorced -95k Yes
6 No Married 60K No
7 Yes 220K No
8 No Single 85K Yes
9 No Married 75K No
10 No Single 90K Yes
10
Attributes
Objects
Data Cleaning
 Real-world data tends to be incomplete, noisy and
inconsistent.
 Data Cleaning Steps
 Missing values
 Noisy Data
 Inconsistent Data
Missing values
 A missing value (Mv) is an empty cell in the table
that represents a dataset.
?Instances
Attributes
Dealing with missing values
1. Ignore records with missing values:
 This is usually done when the class label is missing.
 This method is not effective, unless the record contains
several attributes with missing values.
Dealing with missing values
2. Fill in the missing value manually:
In general, this approach is time-consuming and may be not
feeble given a large data set with many missing values.
3. Fill in the missing value manually:
Replace all missing values by same constant such as
“unknown”. Although this method is simple but it is not
recommended because results with “unknown values are not
“interesting”.
Dealing with missing values
4. Use the attribute mean to fill missing values:
For example in attribute income if the mean income is 28000,
use this value to replace the missing values.
5. Use the attribute mean for all samples belonging to the
same class
For example, if classifying customers according to credit risk,
replace the missing value with the mean income value for
customers in the same credit risk category as that of the given
record.
Dealing with missing values
6. Use advanced method
such as K-nearest neighbors formalism or decision
tree to predict the missing value using other values.
Dealing with missing values
k nearest neighbors Approach
Compute the k nearest neighbors and assign a value
from them.
Dealing with missing values
k nearest neighbors Approach
 For nominal values, use the most common value
among all neighbors.
 For numerical values use the average value.
 Indeed, we need to define a proximity measure
between instances, such as euclidian distance.
Next:
Data Cleaning: Noisy Data
Data preparation and processing
Mahmoud Rafeek Alfarra
http://mfarra.cst.ps
University College of Science & Technology- Khan yonis
Development of computer systems
2016
Chapter 2 – Lecture 2
Outline
 Introduction
 Domain Expert
 Goal identification and Data Understanding
 Data Cleaning
 Missing values
 Noisy Data
 Inconsistent Data
 Data Integration
 Data Transformation
 Data Reduction
 Feature Selection
 Sampling
 Discretization
Introduction
 Noise is a random error in measured variable.
 Noisy data is meaningless data.
 Any data that has been received, stored or changed
in such a manner that it cannot be read or used by the
program that originally created it can be described as
noisy.
Noisy Data
 Source of Noisy data:
1. Data entry problem.
2. Faulty data collection instruments.
3. Data transmission.
Noisy Data
 Binning method
 Clustering
 Combined computer and human inspections
 Regression
How to handle noisy data ?
 Binning method:
1. Sort data
2. Partition into equal-frequency groups.
3. One can smooth by group means, smooth by
group median, smooth by group boundaries, etc.
How to handle noisy data ?
Sorted data for price: 4, 8, 9, 15, 21, 21, 24, 25, 26, 28, 29, 34
Partition into (equal-frequency) groups:
-G1: 4, 8, 9, 15
-G2: 21, 21, 24, 25
-G3: 26, 28, 29, 34
Smoothing by bin means:
-G1: 9, 9, 9, 9
-G2: 23, 23, 23, 23
-G3: 29, 29, 29, 29
Smoothing by bin boundaries:
-G1: 4, 4, 4, 15
-G2: 21, 21, 25, 25
-G3: 26, 26, 26, 34
How to handle noisy data ?
Clustering: Outliers may be detected by clustering,
where similar values are organized into groups, values
that fall outside the set of clusters may be considered
outliers.
How to handle noisy data ?
 Combined computer and human inspections: Outliers
may be identified by detect suspicious values and
check by human.
How to handle noisy data ?
 Regression: Data can be smoothed by fitting the
data to a function.
Inconsistent Data
 Data which is inconsistent with our models, should
be dealt with.
 Common sense can also be used to detect such kind
of inconsistency:
The same name occurring differently in an application.
Different names can appear to be the same (Dennis Vs
Denis)
Inappropriate values (Males being pregnant, or having an
negative age) Was rating “1,2,3”, now rating “A, B, C”
Difference between duplicate records
Inconsistent Data
 We want to transform all dates to the same format internally
 Some systems accept dates in many formats
 e.g. “Sep 24, 2003” , 9/24/03, 24.09.03, etc
 dates are transformed internally to a standard value
 Frequently, just the year (YYYY) is sufficient
 For more details, we may need the month, the day, the hour,
etc
 Representing date as YYYYMM or YYYYMMDD can be OK.
Data Integration
Goal identification
& Data
Understanding
Data Cleaning Data Integration
Data
Transformation
Data
Reduction
Data Integration
 Combines data from multiple sources into a coherent
store.
 Increasingly data a mining projects require data
from more than one data source.
 Such as multiple databases, data warehouse, flat
files and historical data.
Data Integration
 Data is stored in many systems across enterprise
and outside the enterprise
The source of data fall into two categories:
 Internal sources that are generated through enterprise
activities such as databases, historical data, Web sites
and warehouses.
 External sources such as credit bureaus, phone
companies and demographical information.
Data Integration
 Data Warehouse: is a structure that links information
from two or more databases.
 Data warehouse brings data from different data
sources into a central repository.
 It performs some data integration, clean-up, and
summarization, and distribute the information data
marts.
Data Integration
Next:
Data Cleaning: Noisy Data
Data preparation and processing
Mahmoud Rafeek Alfarra
http://mfarra.cst.ps
University College of Science & Technology- Khan yonis
Development of computer systems
2016
Chapter 2 – Lecture 3
Outline
 Introduction
 Domain Expert
 Goal identification and Data Understanding
 Data Cleaning
 Missing values
 Noisy Data
 Inconsistent Data
 Data Integration
 Data Transformation
 Data Reduction
 Feature Selection
 Sampling
 Discretization
Introduction
Data Transformation
 Definition 1: Transform the data into a form
appropriate for given data mining method.
 Definition 2: Data transformation is the process of
converting data or information from one format to
another, usually from the format of a source system
into the required format of a new destination system.
Data Transformation
 Methods include:
 Smoothing
 Aggregation
 Generalization
 Normalization (min-max)
Data Transformation
Methods of Data Transformation
 Normalization: Where the attributes are scaled so as to
fall within a small specified ranges such as -1.0 to 1.0.
How to handle noisy data ?
Next:
Data Reduction
Data preparation and processing
Mahmoud Rafeek Alfarra
http://mfarra.cst.ps
University College of Science & Technology- Khan yonis
Development of computer systems
2016
Chapter 2 – Lecture 4
Outline
 Introduction
 Domain Expert
 Goal identification and Data Understanding
 Data Cleaning
 Missing values
 Noisy Data
 Inconsistent Data
 Data Integration
 Data Transformation
 Data Reduction
 Feature Selection
 Sampling
 Discretization
Introduction
Goal
identification and
Data
Understanding
Data Cleaning Data Integration
Data TransformationData Reduction
Data Reduction
Data Reduction (Selection)
 Warehouse may store terabytes of data: Complex
data analysis/mining may take a very long time to run
on the complete data set.
 Data reduction: Obtains a reduced representation of
the data set that is much smaller in volume but yet
produces the same (or almost the same) analytical
results.
Data Reduction
 The choice of data representation, and selection,
reduction or transformation of features is probably the
most important issue that determines the quality of a
data-mining solution.
Data Reduction
 The three basic operations in a data-reduction
process are:
 Delete a column (feature selection).
 Delete a row (sampling).
 Reduce the number of values in a column
(Discretization).
Data Reduction
Feature Selection
 We want to choose features (attributes) that are
relevant to our data-mining application in order to
achieve maximum performance with the minimum
measurement and processing effort.
Feature Selection
1. Redundant features
 Duplicate much or all of the information contained in
one or more other attributes
 E.g., purchase price of a product and the amount of
sales tax paid.
Feature Selection
2. Irrelevant features
 Contain no information that is useful for the data
mining task at hand.
E.g., students' ID is often irrelevant to the task of
predicting students' GPA.
Feature Selection
3. Selecting Most Relevant Fields
 If there are too many fields, select a subset that is most
relevant.
Can select top N fields using some computations.
What is good N?
 Rule of thumb -- keep top 50 fields
Feature Selection
 Two types of feature selection
 Unsupervised: Reduce fields without knowing class label.
Supervised: Select fields with respect to class label.
Sampling
 Sampling: Obtaining a small sample s to represent
the whole data set N.
Allow a mining algorithm to run in complexity that is
potentially sub-linear to the size of the data.
Sampling
 Key principle: Choose a representative subset of the
data.
 Simple random sampling may have very poor
performance in the presence of skew
 Develop adaptive sampling methods, e.g., stratified
sampling.
Sampling
8000 points 2000 Points 500 Points
Sample Size
Types of Sampling
 Sampling without replacement:
 Once an object is selected, it is removed from the population.
 Sampling with replacement
 A selected object is not removed from the population.
 Stratified sampling:
 Partition the data set, and draw samples from each partition
(proportionally, i.e., approximately the same percentage of the data)
Types of Sampling(Sampling without replacement)
Raw Data
Types of Sampling(Sampling with replacement)
Raw Data
Types of Sampling
Raw Data Cluster/Stratified Sample
Types of Sampling
Age
Young
Young
Young
Young
Middle-age
Middle-age
Middle-age
Middle-age
Middle-age
Middle-age
Middle-age
Senior
Senior
Age
Young
Young
Middle-age
Middle-age
Middle-age
Middle-age
Senior
Discretization
 Discretization is very useful for generating a
summary of data, also called “binning”.
 It does not use the class information.
 Suppose we have the following set of values for the
attribute - AGE : 0, 4, 12, 16, 16, 18, 24, 26, 28.
Two possible ways in which Binning can be applied
are: Equi-width binning or Equi-frequency binning .
Next:
Practical Part

Data preparation and processing chapter 2

  • 1.
    Data preparation andprocessing Mahmoud Rafeek Alfarra http://mfarra.cst.ps University College of Science & Technology- Khan yonis Development of computer systems 2016 Chapter 2 – Lecture 1
  • 2.
    Outline  Introduction  DomainExpert  Goal identification and Data Understanding  Data Cleaning  Missing values  Noisy Data  Inconsistent Data  Data Integration  Data Transformation  Data Reduction  Feature Selection  Sampling  Discretization
  • 3.
  • 4.
     The real–world database typically used in data mining may have millions of records and thousands of variables. It is noisy and has missing and inconsistent values. Data quality is a key issue with data mining so data preparation is a necessary step for serious, effective, real-world data mining. Introduction
  • 5.
    To increase theaccuracy of the mining, has to perform data preprocessing. Otherwise, garbage in => garbage out Data Preparation estimated to take 70-80% of the time and effort. Introduction
  • 6.
    Domain Expertise  Dataquality expert: “We found these strange records in your database after running sophisticated algorithms!”  Domain Experts: “Oh, those apples - we put them in the same baskets as oranges because there are too few apples to bother. Not a big deal. We knew that already.”
  • 7.
    Domain Expertise Domain Expertiseis important for understanding the data, the problem and interpreting the results. “The counter resets to 0 if the number of calls exceeds N”. “The missing values are represented by 0, but the default billed amount is 0 too.” Insufficient Domain Expertise is a primary cause of poor Data Quality– data are unusable.
  • 8.
    Goal Identification  Toobtain the highest benefit from data mining, there must be a clear statement of the business objectives.  The first and most important step in any targeting- model project is to establish a clear goal and develop a process to achieve that goal.
  • 9.
    Goal Identification  Exampleof Goal for business company are:  You want to attract new customers  You want to avoid high -risk customers  You want to understand the characteristics of your current customers?  You want to make your unprofitable customers more profitable?  You want to retain your profitable customers?  You want to win back your lost customers?  You want to improve customer satisfaction?  You want to increase sales?  You want to reduce expenses
  • 10.
    Data Understanding  Startswith an initial data collection and proceeds with activities in order to get familiar with the data, to identify data quality problems, to discover first closes into the data.
  • 11.
    Data Understanding Data Understanding:Relevance:  What data is available for the task?  Is this data relevant?  Is additional relevant data available?  How much historical data is available?  Who is the data expert ?
  • 12.
    Data Understanding Data Understanding:Quantity  Number of instances (records)  Rule of thumb: 5,000 or more desired  if less, results are less reliable;  Number of attributes (fields)  Rule of thumb: for each field, 10 or more instances  If more fields, use feature reduction and selection  Number of targets  Rule of thumb: >100 for each class  if very unbalanced, use stratified sampling
  • 13.
    Data Cleaning Goal identification &Data Understanding Data Cleaning Data Integration Data Transformation Data Reduction
  • 14.
    Data Cleaning Tid Refund Marital Status Taxable Income Cheat 1Yes 125K No 2 No Married 100K No 3 No Single 70K No 4 Yes Married 120K No 5 No Divorced -95k Yes 6 No Married 60K No 7 Yes 220K No 8 No Single 85K Yes 9 No Married 75K No 10 No Single 90K Yes 10 Attributes Objects
  • 15.
    Data Cleaning  Real-worlddata tends to be incomplete, noisy and inconsistent.  Data Cleaning Steps  Missing values  Noisy Data  Inconsistent Data
  • 16.
    Missing values  Amissing value (Mv) is an empty cell in the table that represents a dataset. ?Instances Attributes
  • 17.
    Dealing with missingvalues 1. Ignore records with missing values:  This is usually done when the class label is missing.  This method is not effective, unless the record contains several attributes with missing values.
  • 18.
    Dealing with missingvalues 2. Fill in the missing value manually: In general, this approach is time-consuming and may be not feeble given a large data set with many missing values. 3. Fill in the missing value manually: Replace all missing values by same constant such as “unknown”. Although this method is simple but it is not recommended because results with “unknown values are not “interesting”.
  • 19.
    Dealing with missingvalues 4. Use the attribute mean to fill missing values: For example in attribute income if the mean income is 28000, use this value to replace the missing values. 5. Use the attribute mean for all samples belonging to the same class For example, if classifying customers according to credit risk, replace the missing value with the mean income value for customers in the same credit risk category as that of the given record.
  • 20.
    Dealing with missingvalues 6. Use advanced method such as K-nearest neighbors formalism or decision tree to predict the missing value using other values.
  • 21.
    Dealing with missingvalues k nearest neighbors Approach Compute the k nearest neighbors and assign a value from them.
  • 22.
    Dealing with missingvalues k nearest neighbors Approach  For nominal values, use the most common value among all neighbors.  For numerical values use the average value.  Indeed, we need to define a proximity measure between instances, such as euclidian distance.
  • 23.
  • 24.
    Data preparation andprocessing Mahmoud Rafeek Alfarra http://mfarra.cst.ps University College of Science & Technology- Khan yonis Development of computer systems 2016 Chapter 2 – Lecture 2
  • 25.
    Outline  Introduction  DomainExpert  Goal identification and Data Understanding  Data Cleaning  Missing values  Noisy Data  Inconsistent Data  Data Integration  Data Transformation  Data Reduction  Feature Selection  Sampling  Discretization
  • 26.
  • 27.
     Noise isa random error in measured variable.  Noisy data is meaningless data.  Any data that has been received, stored or changed in such a manner that it cannot be read or used by the program that originally created it can be described as noisy. Noisy Data
  • 28.
     Source ofNoisy data: 1. Data entry problem. 2. Faulty data collection instruments. 3. Data transmission. Noisy Data
  • 29.
     Binning method Clustering  Combined computer and human inspections  Regression How to handle noisy data ?
  • 30.
    How to handlenoisy data ?  Binning method: 1. Sort data 2. Partition into equal-frequency groups. 3. One can smooth by group means, smooth by group median, smooth by group boundaries, etc.
  • 31.
    How to handlenoisy data ? Sorted data for price: 4, 8, 9, 15, 21, 21, 24, 25, 26, 28, 29, 34 Partition into (equal-frequency) groups: -G1: 4, 8, 9, 15 -G2: 21, 21, 24, 25 -G3: 26, 28, 29, 34 Smoothing by bin means: -G1: 9, 9, 9, 9 -G2: 23, 23, 23, 23 -G3: 29, 29, 29, 29 Smoothing by bin boundaries: -G1: 4, 4, 4, 15 -G2: 21, 21, 25, 25 -G3: 26, 26, 26, 34
  • 32.
    How to handlenoisy data ? Clustering: Outliers may be detected by clustering, where similar values are organized into groups, values that fall outside the set of clusters may be considered outliers.
  • 33.
    How to handlenoisy data ?  Combined computer and human inspections: Outliers may be identified by detect suspicious values and check by human.
  • 34.
    How to handlenoisy data ?  Regression: Data can be smoothed by fitting the data to a function.
  • 35.
    Inconsistent Data  Datawhich is inconsistent with our models, should be dealt with.  Common sense can also be used to detect such kind of inconsistency: The same name occurring differently in an application. Different names can appear to be the same (Dennis Vs Denis) Inappropriate values (Males being pregnant, or having an negative age) Was rating “1,2,3”, now rating “A, B, C” Difference between duplicate records
  • 36.
    Inconsistent Data  Wewant to transform all dates to the same format internally  Some systems accept dates in many formats  e.g. “Sep 24, 2003” , 9/24/03, 24.09.03, etc  dates are transformed internally to a standard value  Frequently, just the year (YYYY) is sufficient  For more details, we may need the month, the day, the hour, etc  Representing date as YYYYMM or YYYYMMDD can be OK.
  • 37.
    Data Integration Goal identification &Data Understanding Data Cleaning Data Integration Data Transformation Data Reduction
  • 38.
    Data Integration  Combinesdata from multiple sources into a coherent store.  Increasingly data a mining projects require data from more than one data source.  Such as multiple databases, data warehouse, flat files and historical data.
  • 39.
    Data Integration  Datais stored in many systems across enterprise and outside the enterprise The source of data fall into two categories:  Internal sources that are generated through enterprise activities such as databases, historical data, Web sites and warehouses.  External sources such as credit bureaus, phone companies and demographical information.
  • 40.
    Data Integration  DataWarehouse: is a structure that links information from two or more databases.  Data warehouse brings data from different data sources into a central repository.  It performs some data integration, clean-up, and summarization, and distribute the information data marts.
  • 41.
  • 42.
  • 43.
    Data preparation andprocessing Mahmoud Rafeek Alfarra http://mfarra.cst.ps University College of Science & Technology- Khan yonis Development of computer systems 2016 Chapter 2 – Lecture 3
  • 44.
    Outline  Introduction  DomainExpert  Goal identification and Data Understanding  Data Cleaning  Missing values  Noisy Data  Inconsistent Data  Data Integration  Data Transformation  Data Reduction  Feature Selection  Sampling  Discretization
  • 45.
  • 46.
  • 47.
     Definition 1:Transform the data into a form appropriate for given data mining method.  Definition 2: Data transformation is the process of converting data or information from one format to another, usually from the format of a source system into the required format of a new destination system. Data Transformation
  • 48.
     Methods include: Smoothing  Aggregation  Generalization  Normalization (min-max) Data Transformation
  • 49.
    Methods of DataTransformation  Normalization: Where the attributes are scaled so as to fall within a small specified ranges such as -1.0 to 1.0.
  • 50.
    How to handlenoisy data ?
  • 51.
  • 52.
    Data preparation andprocessing Mahmoud Rafeek Alfarra http://mfarra.cst.ps University College of Science & Technology- Khan yonis Development of computer systems 2016 Chapter 2 – Lecture 4
  • 53.
    Outline  Introduction  DomainExpert  Goal identification and Data Understanding  Data Cleaning  Missing values  Noisy Data  Inconsistent Data  Data Integration  Data Transformation  Data Reduction  Feature Selection  Sampling  Discretization
  • 54.
    Introduction Goal identification and Data Understanding Data CleaningData Integration Data TransformationData Reduction
  • 55.
  • 56.
  • 57.
     Warehouse maystore terabytes of data: Complex data analysis/mining may take a very long time to run on the complete data set.  Data reduction: Obtains a reduced representation of the data set that is much smaller in volume but yet produces the same (or almost the same) analytical results. Data Reduction
  • 58.
     The choiceof data representation, and selection, reduction or transformation of features is probably the most important issue that determines the quality of a data-mining solution. Data Reduction
  • 59.
     The threebasic operations in a data-reduction process are:  Delete a column (feature selection).  Delete a row (sampling).  Reduce the number of values in a column (Discretization). Data Reduction
  • 60.
    Feature Selection  Wewant to choose features (attributes) that are relevant to our data-mining application in order to achieve maximum performance with the minimum measurement and processing effort.
  • 61.
    Feature Selection 1. Redundantfeatures  Duplicate much or all of the information contained in one or more other attributes  E.g., purchase price of a product and the amount of sales tax paid.
  • 62.
    Feature Selection 2. Irrelevantfeatures  Contain no information that is useful for the data mining task at hand. E.g., students' ID is often irrelevant to the task of predicting students' GPA.
  • 63.
    Feature Selection 3. SelectingMost Relevant Fields  If there are too many fields, select a subset that is most relevant. Can select top N fields using some computations. What is good N?  Rule of thumb -- keep top 50 fields
  • 64.
    Feature Selection  Twotypes of feature selection  Unsupervised: Reduce fields without knowing class label. Supervised: Select fields with respect to class label.
  • 65.
    Sampling  Sampling: Obtaininga small sample s to represent the whole data set N. Allow a mining algorithm to run in complexity that is potentially sub-linear to the size of the data.
  • 66.
    Sampling  Key principle:Choose a representative subset of the data.  Simple random sampling may have very poor performance in the presence of skew  Develop adaptive sampling methods, e.g., stratified sampling.
  • 67.
    Sampling 8000 points 2000Points 500 Points Sample Size
  • 68.
    Types of Sampling Sampling without replacement:  Once an object is selected, it is removed from the population.  Sampling with replacement  A selected object is not removed from the population.  Stratified sampling:  Partition the data set, and draw samples from each partition (proportionally, i.e., approximately the same percentage of the data)
  • 69.
    Types of Sampling(Samplingwithout replacement) Raw Data
  • 70.
    Types of Sampling(Samplingwith replacement) Raw Data
  • 71.
    Types of Sampling RawData Cluster/Stratified Sample
  • 72.
  • 73.
    Discretization  Discretization isvery useful for generating a summary of data, also called “binning”.  It does not use the class information.  Suppose we have the following set of values for the attribute - AGE : 0, 4, 12, 16, 16, 18, 24, 26, 28. Two possible ways in which Binning can be applied are: Equi-width binning or Equi-frequency binning .
  • 74.