Downloaded 17 times


![BigML, Inc #DutchMLSchool 28
• Most AD papers only evaluate on a few datasets
• Often proprietary or very easy (e.g., KDD 1999)
• ML community needs a large and growing collection of public
anomaly benchmarks
Anomaly Detection Benchmarking Study
[Emmott, Das, Dietterich, Fern, Wong, 2013; KDD ODD-2013]
[Emmott, Das, Dietterich, Fern, Wong. 2016; arXiv 1503.01158v2]](https://image.slidesharecdn.com/dutchmlschooltechnicalperspectivetdietterich190710-190710085350/75/DutchMLSchool-ML-A-Technical-Perspective-28-2048.jpg)


![BigML, Inc #DutchMLSchool
• Only make a prediction
if the query 𝑥 has a
low anomaly score
• Liu, et al. 2018
showed how to set 𝜏 to
guarantee detecting
new category queries
with high probability
Open Category Detection
𝑥
Anomaly
Detector
𝐴 𝑥 𝜏?
Classifier 𝑓
Training
Examples
𝑥 , 𝑦 no
𝑦 𝑓 𝑥
yes
reject
[Liu, Garrepalli, Fern, Dietterich, ICML 2018]
31](https://image.slidesharecdn.com/dutchmlschooltechnicalperspectivetdietterich190710-190710085350/75/DutchMLSchool-ML-A-Technical-Perspective-31-2048.jpg)


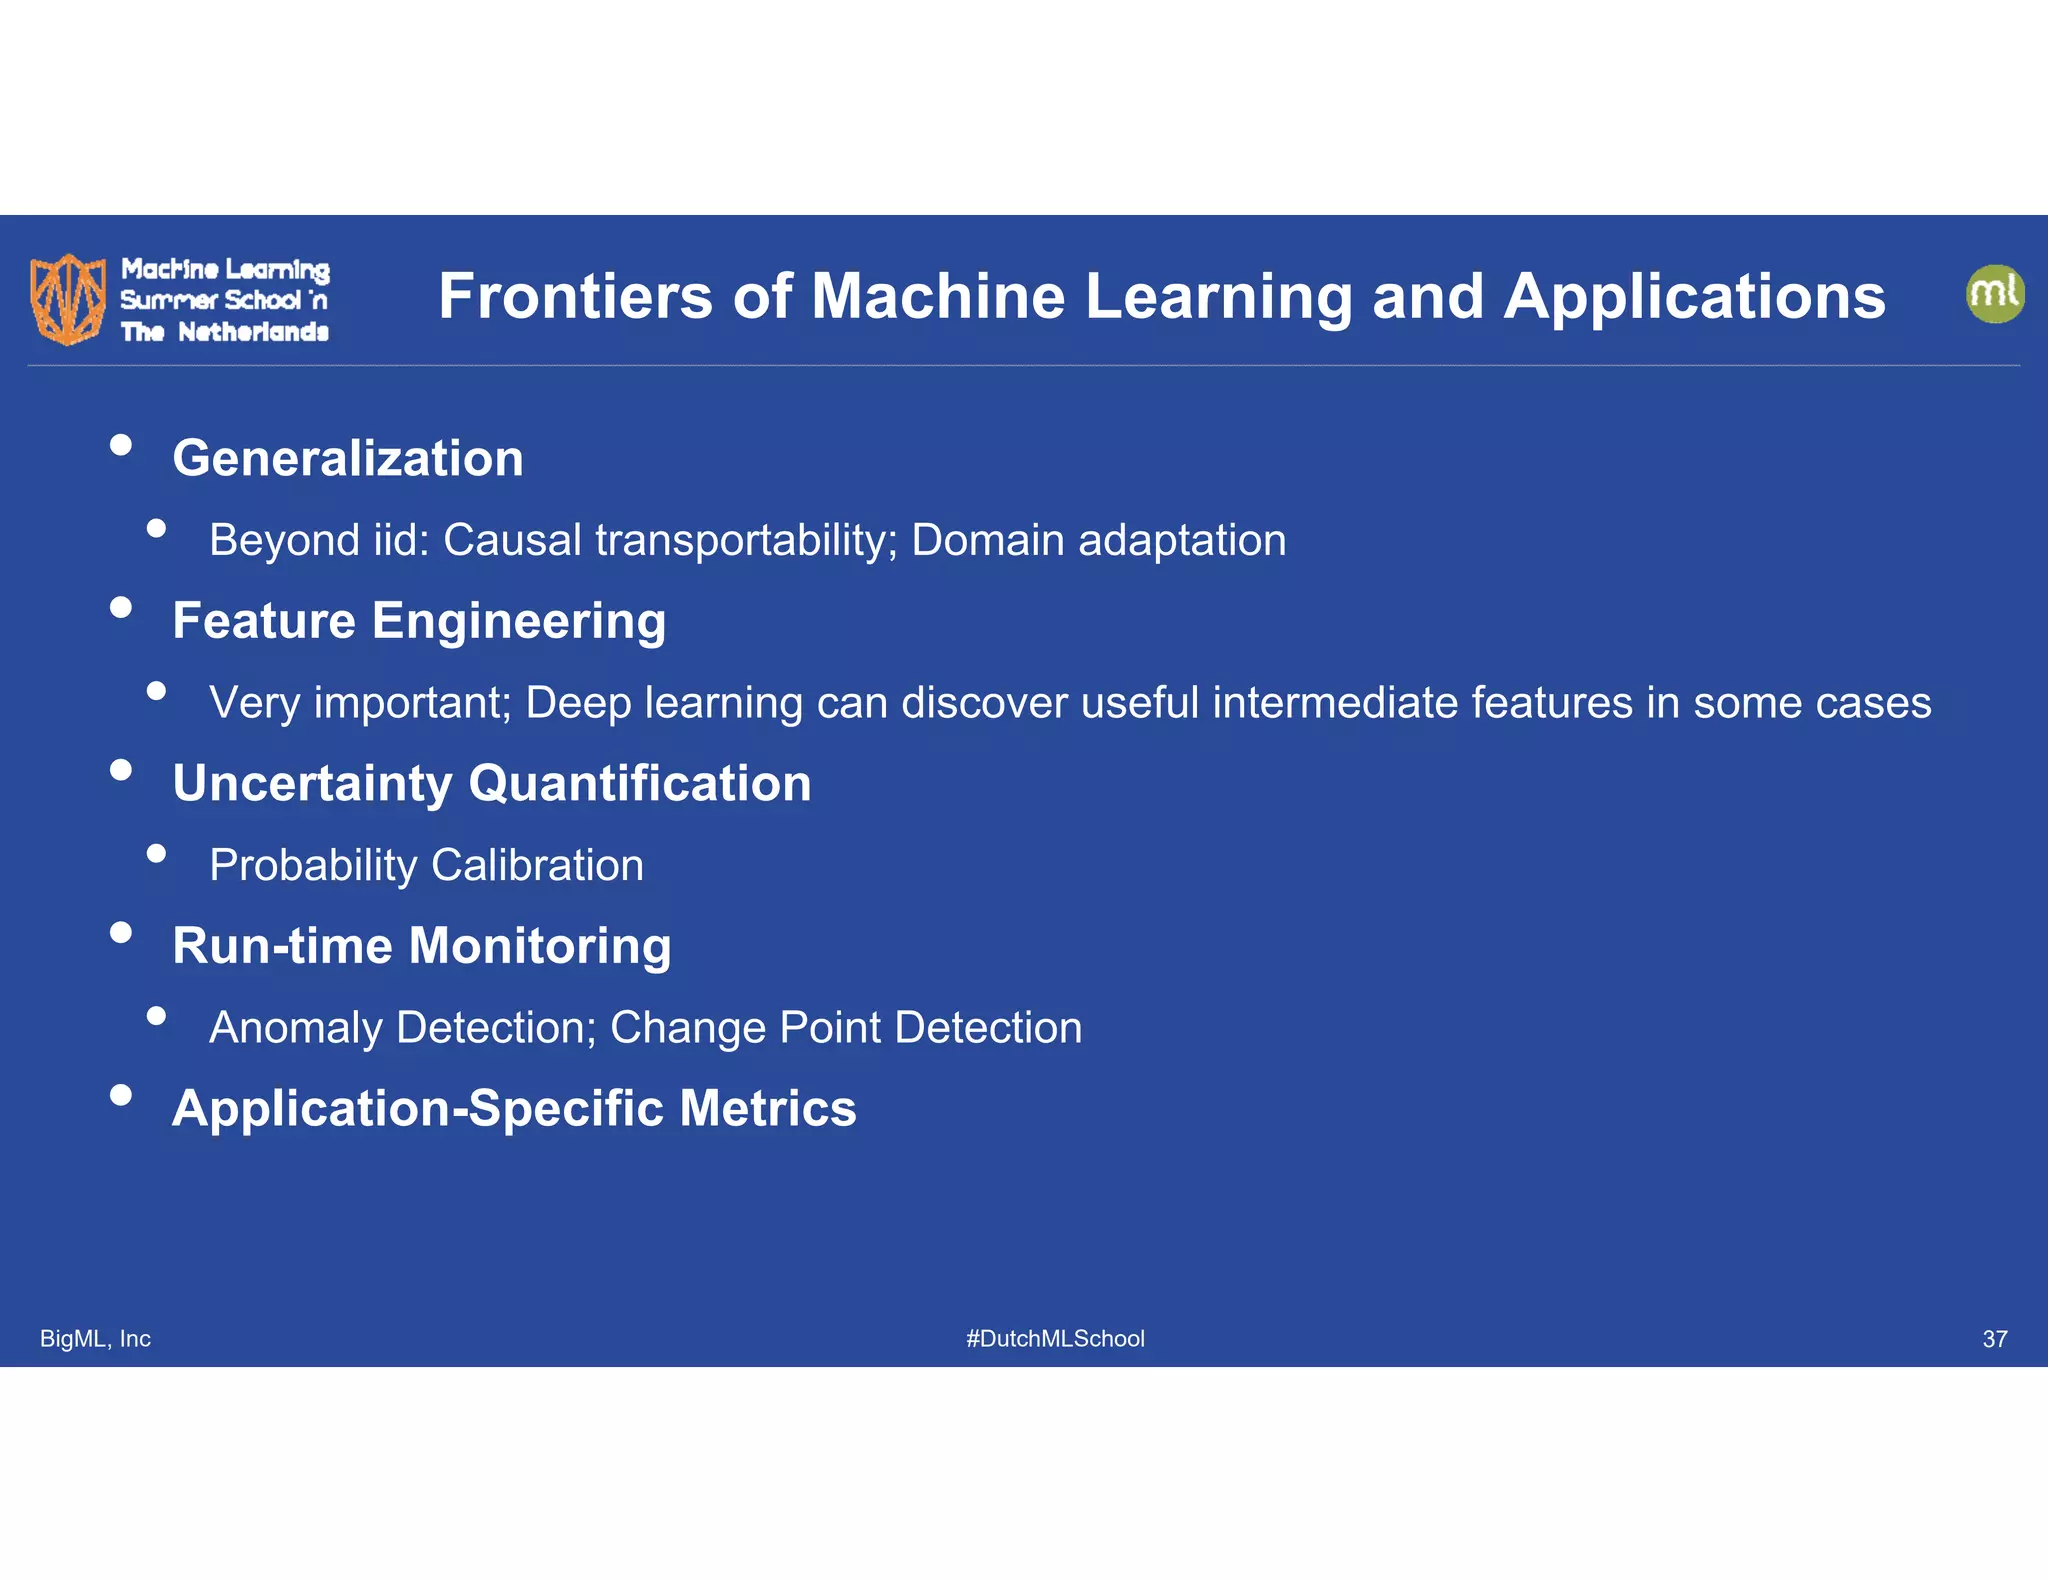

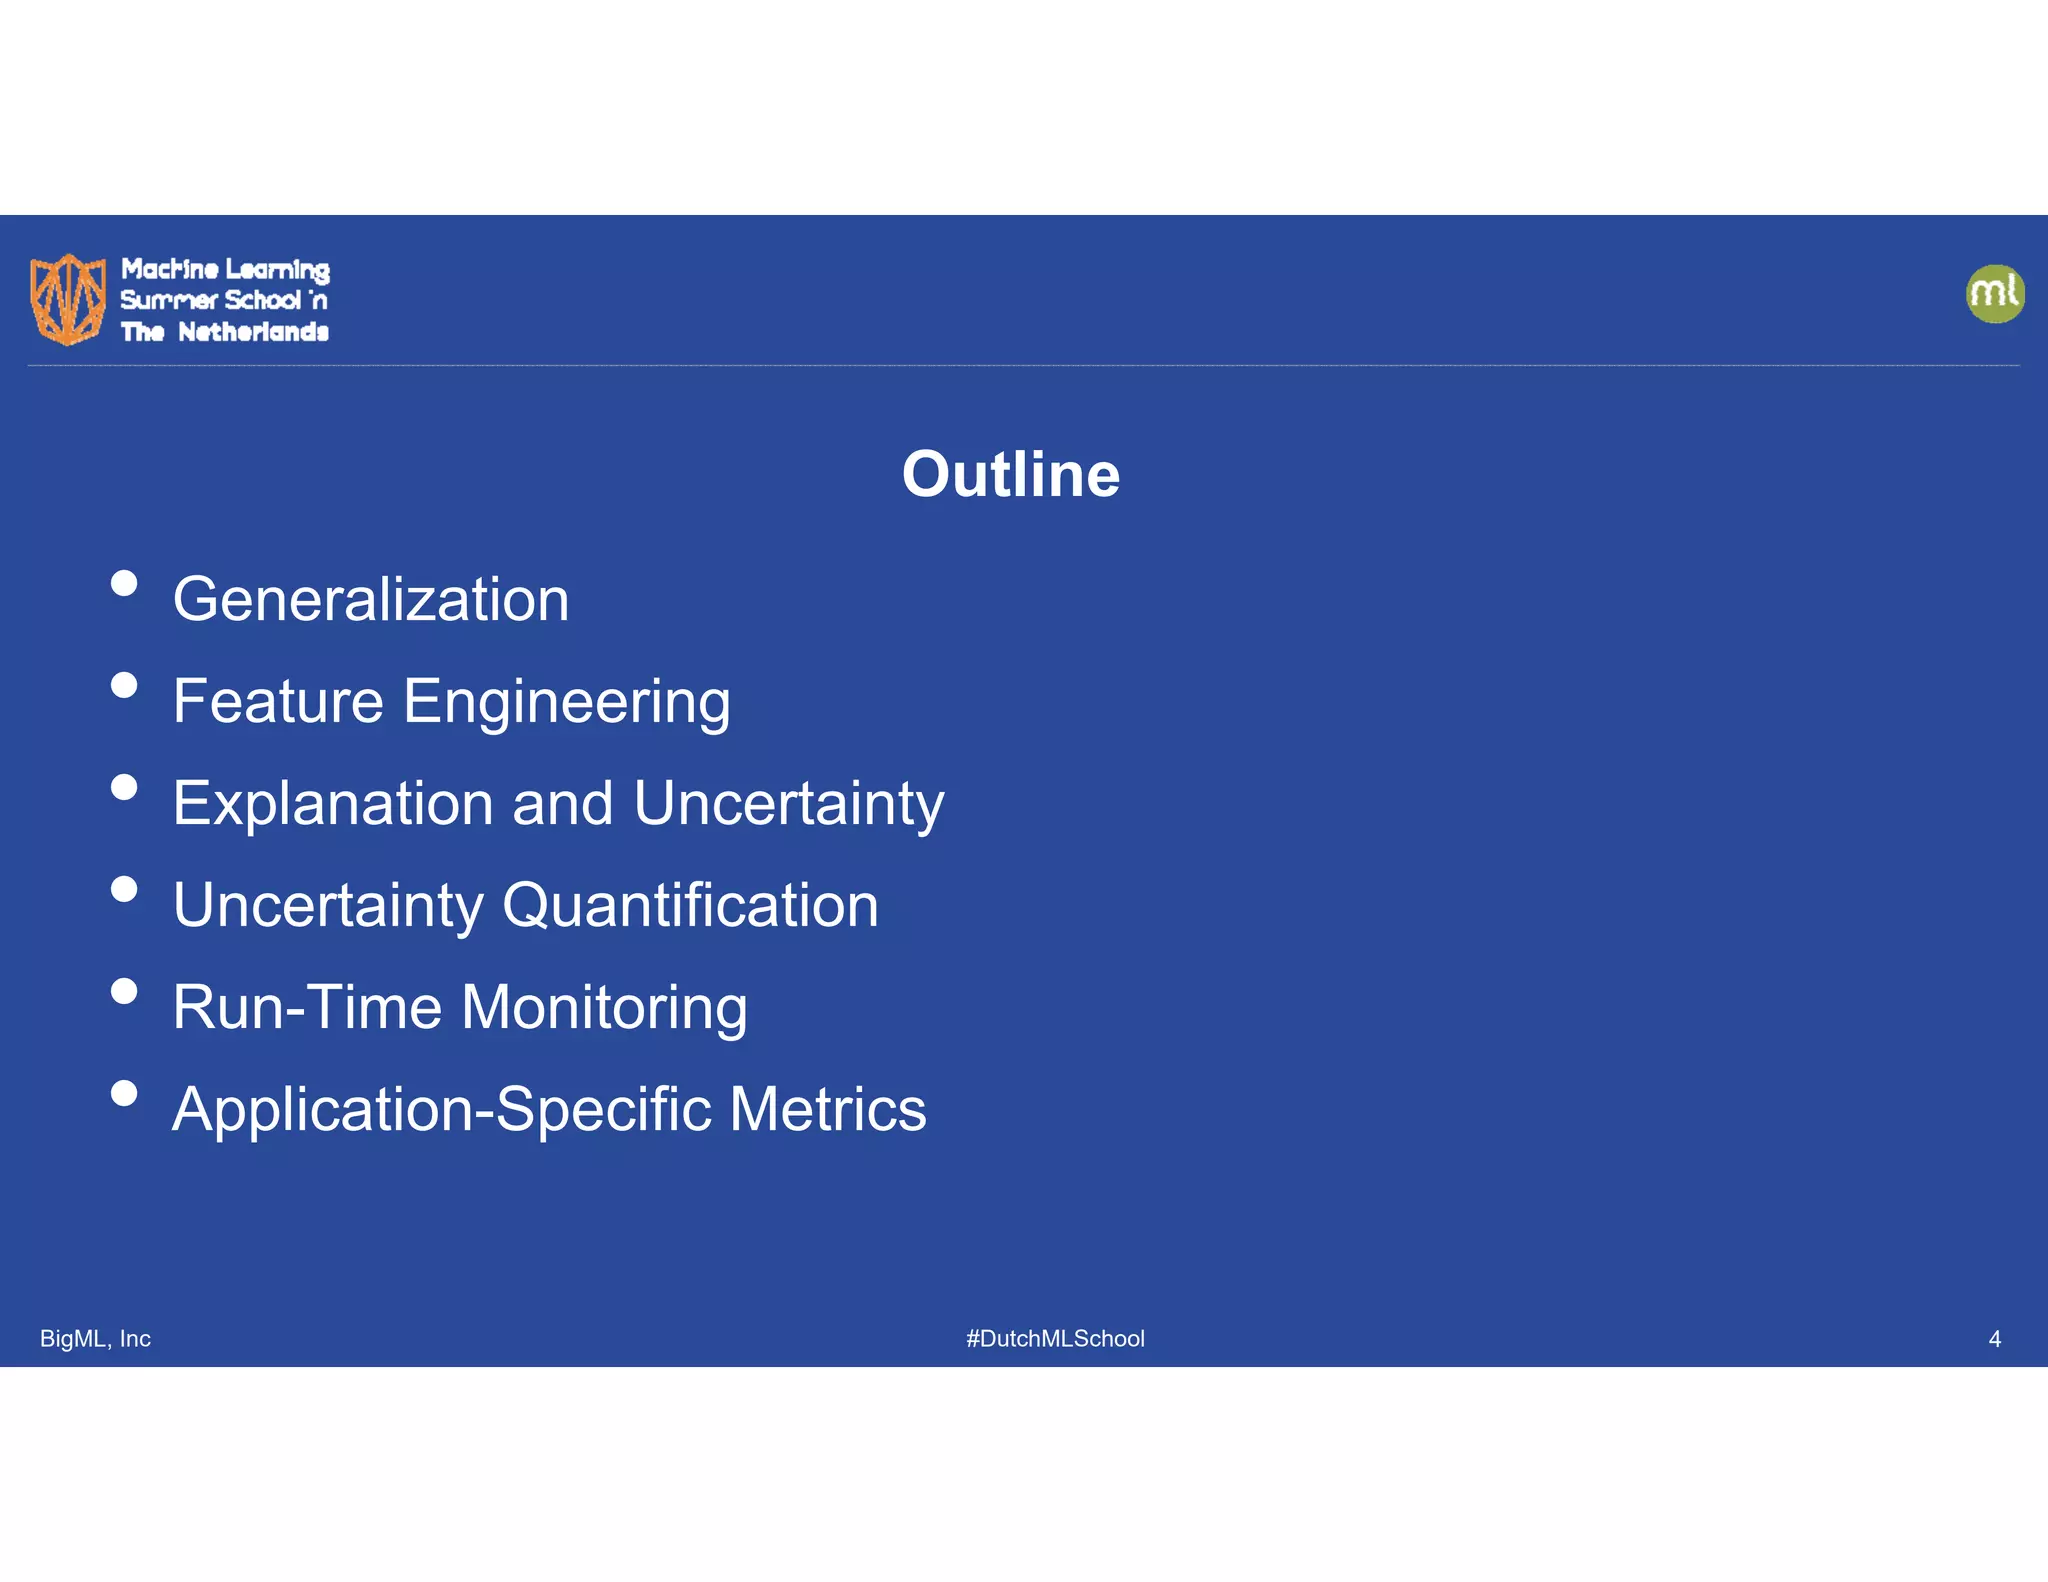
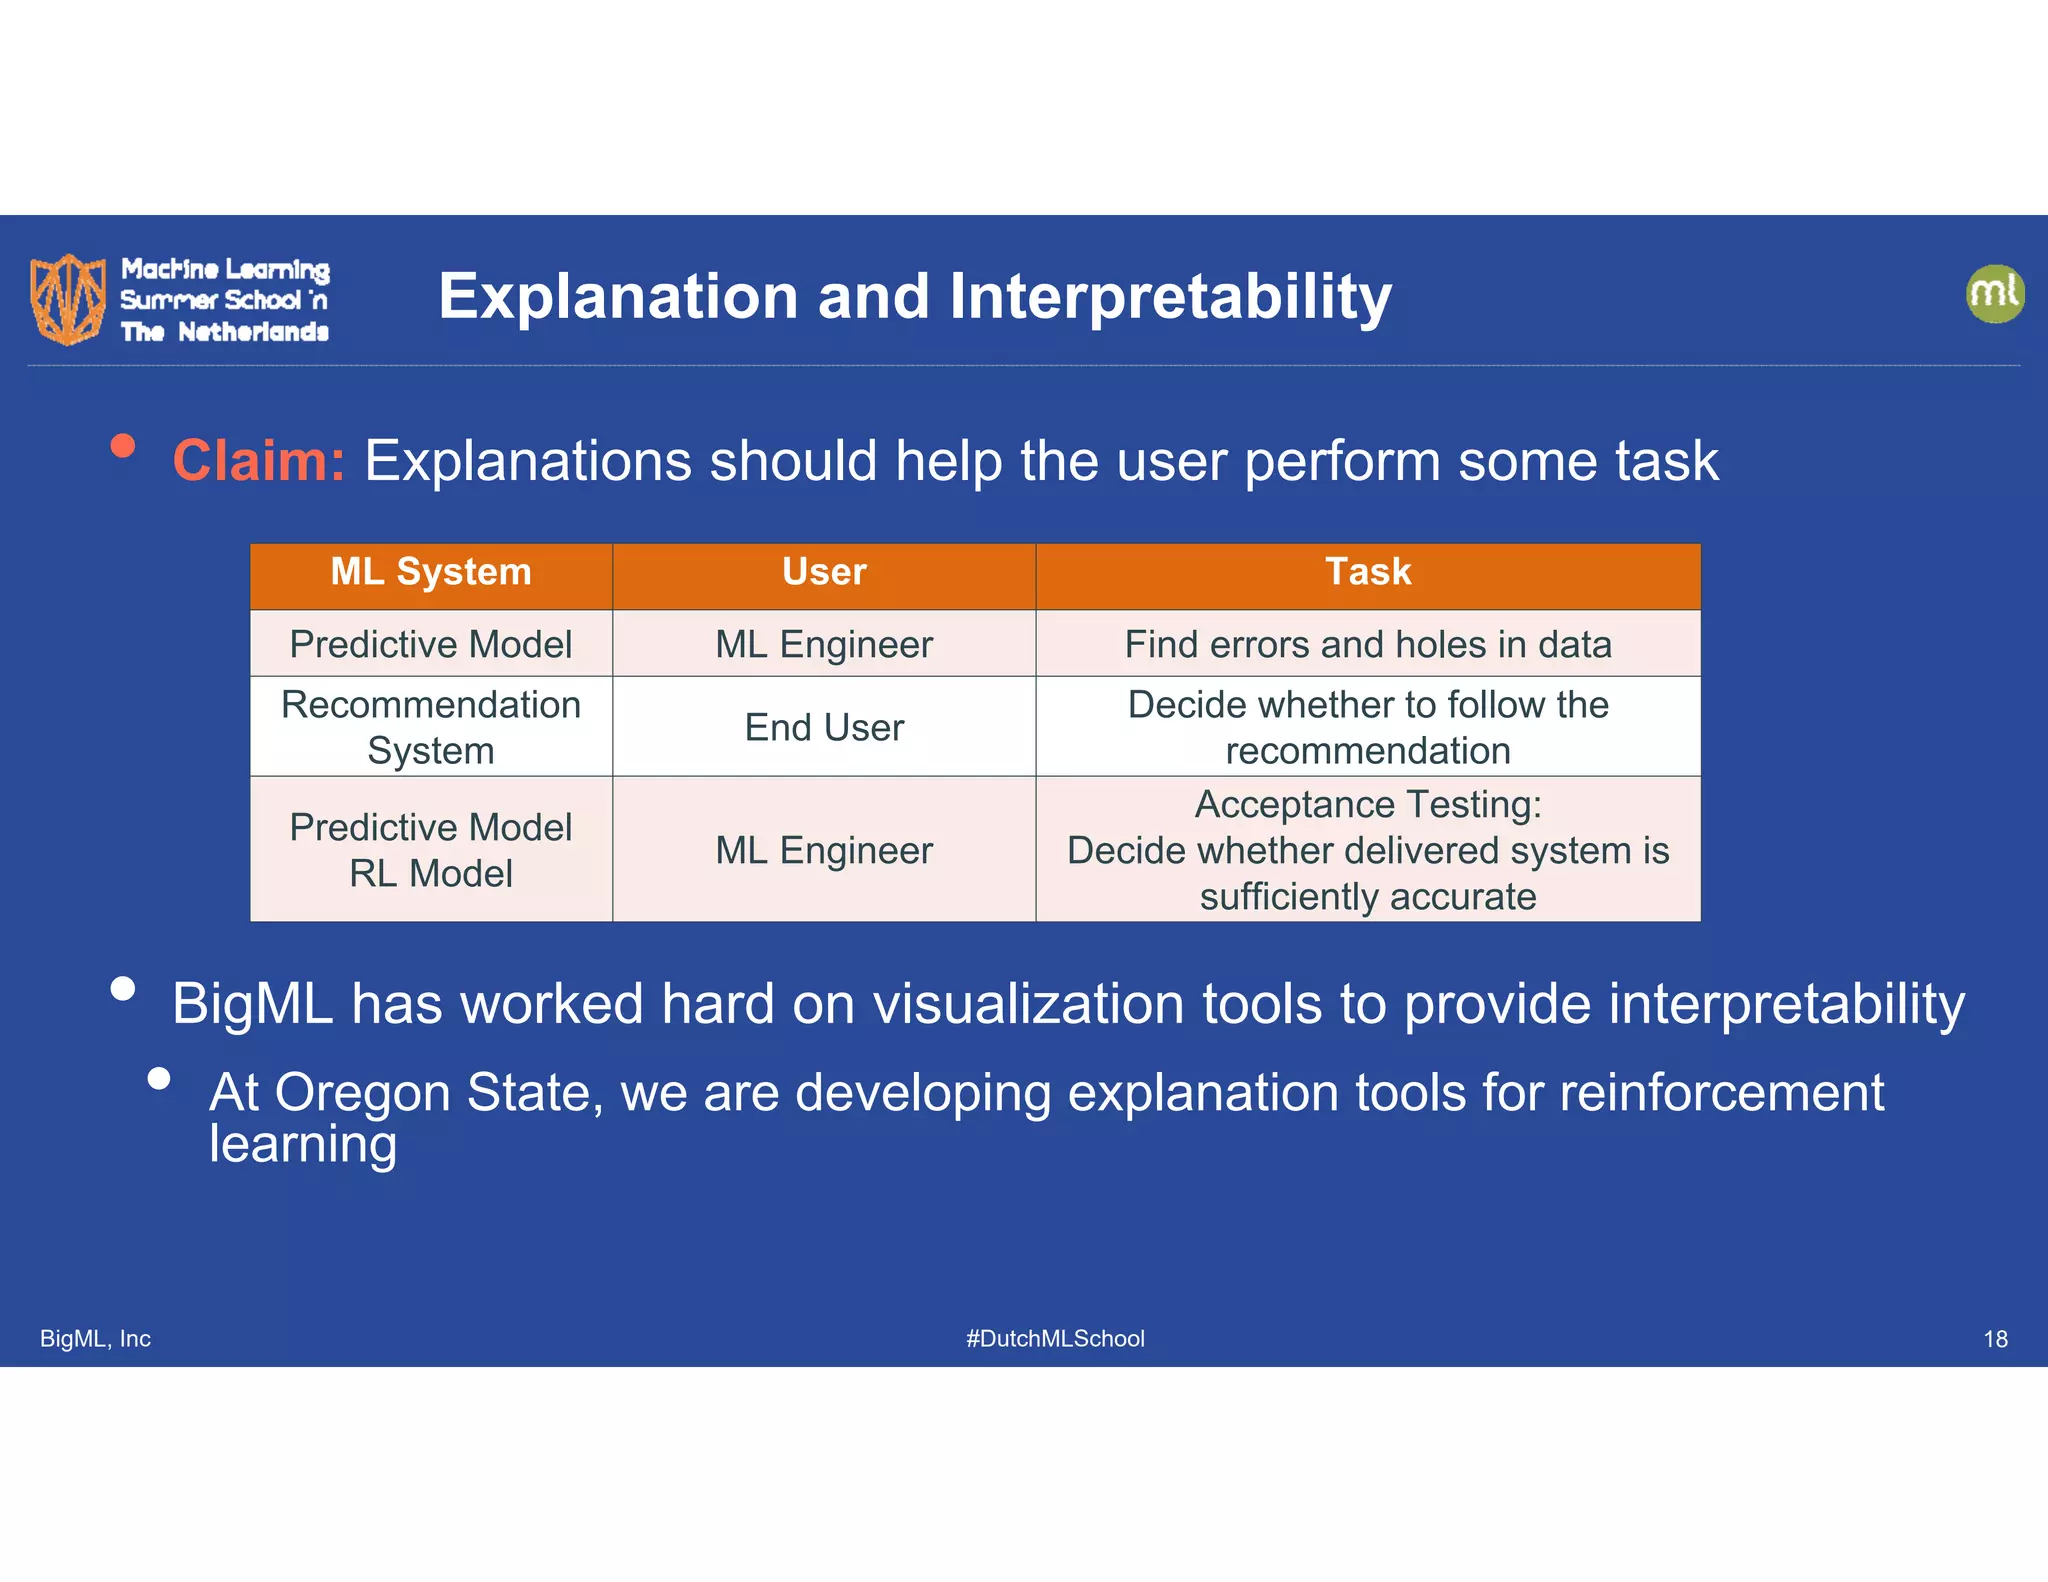
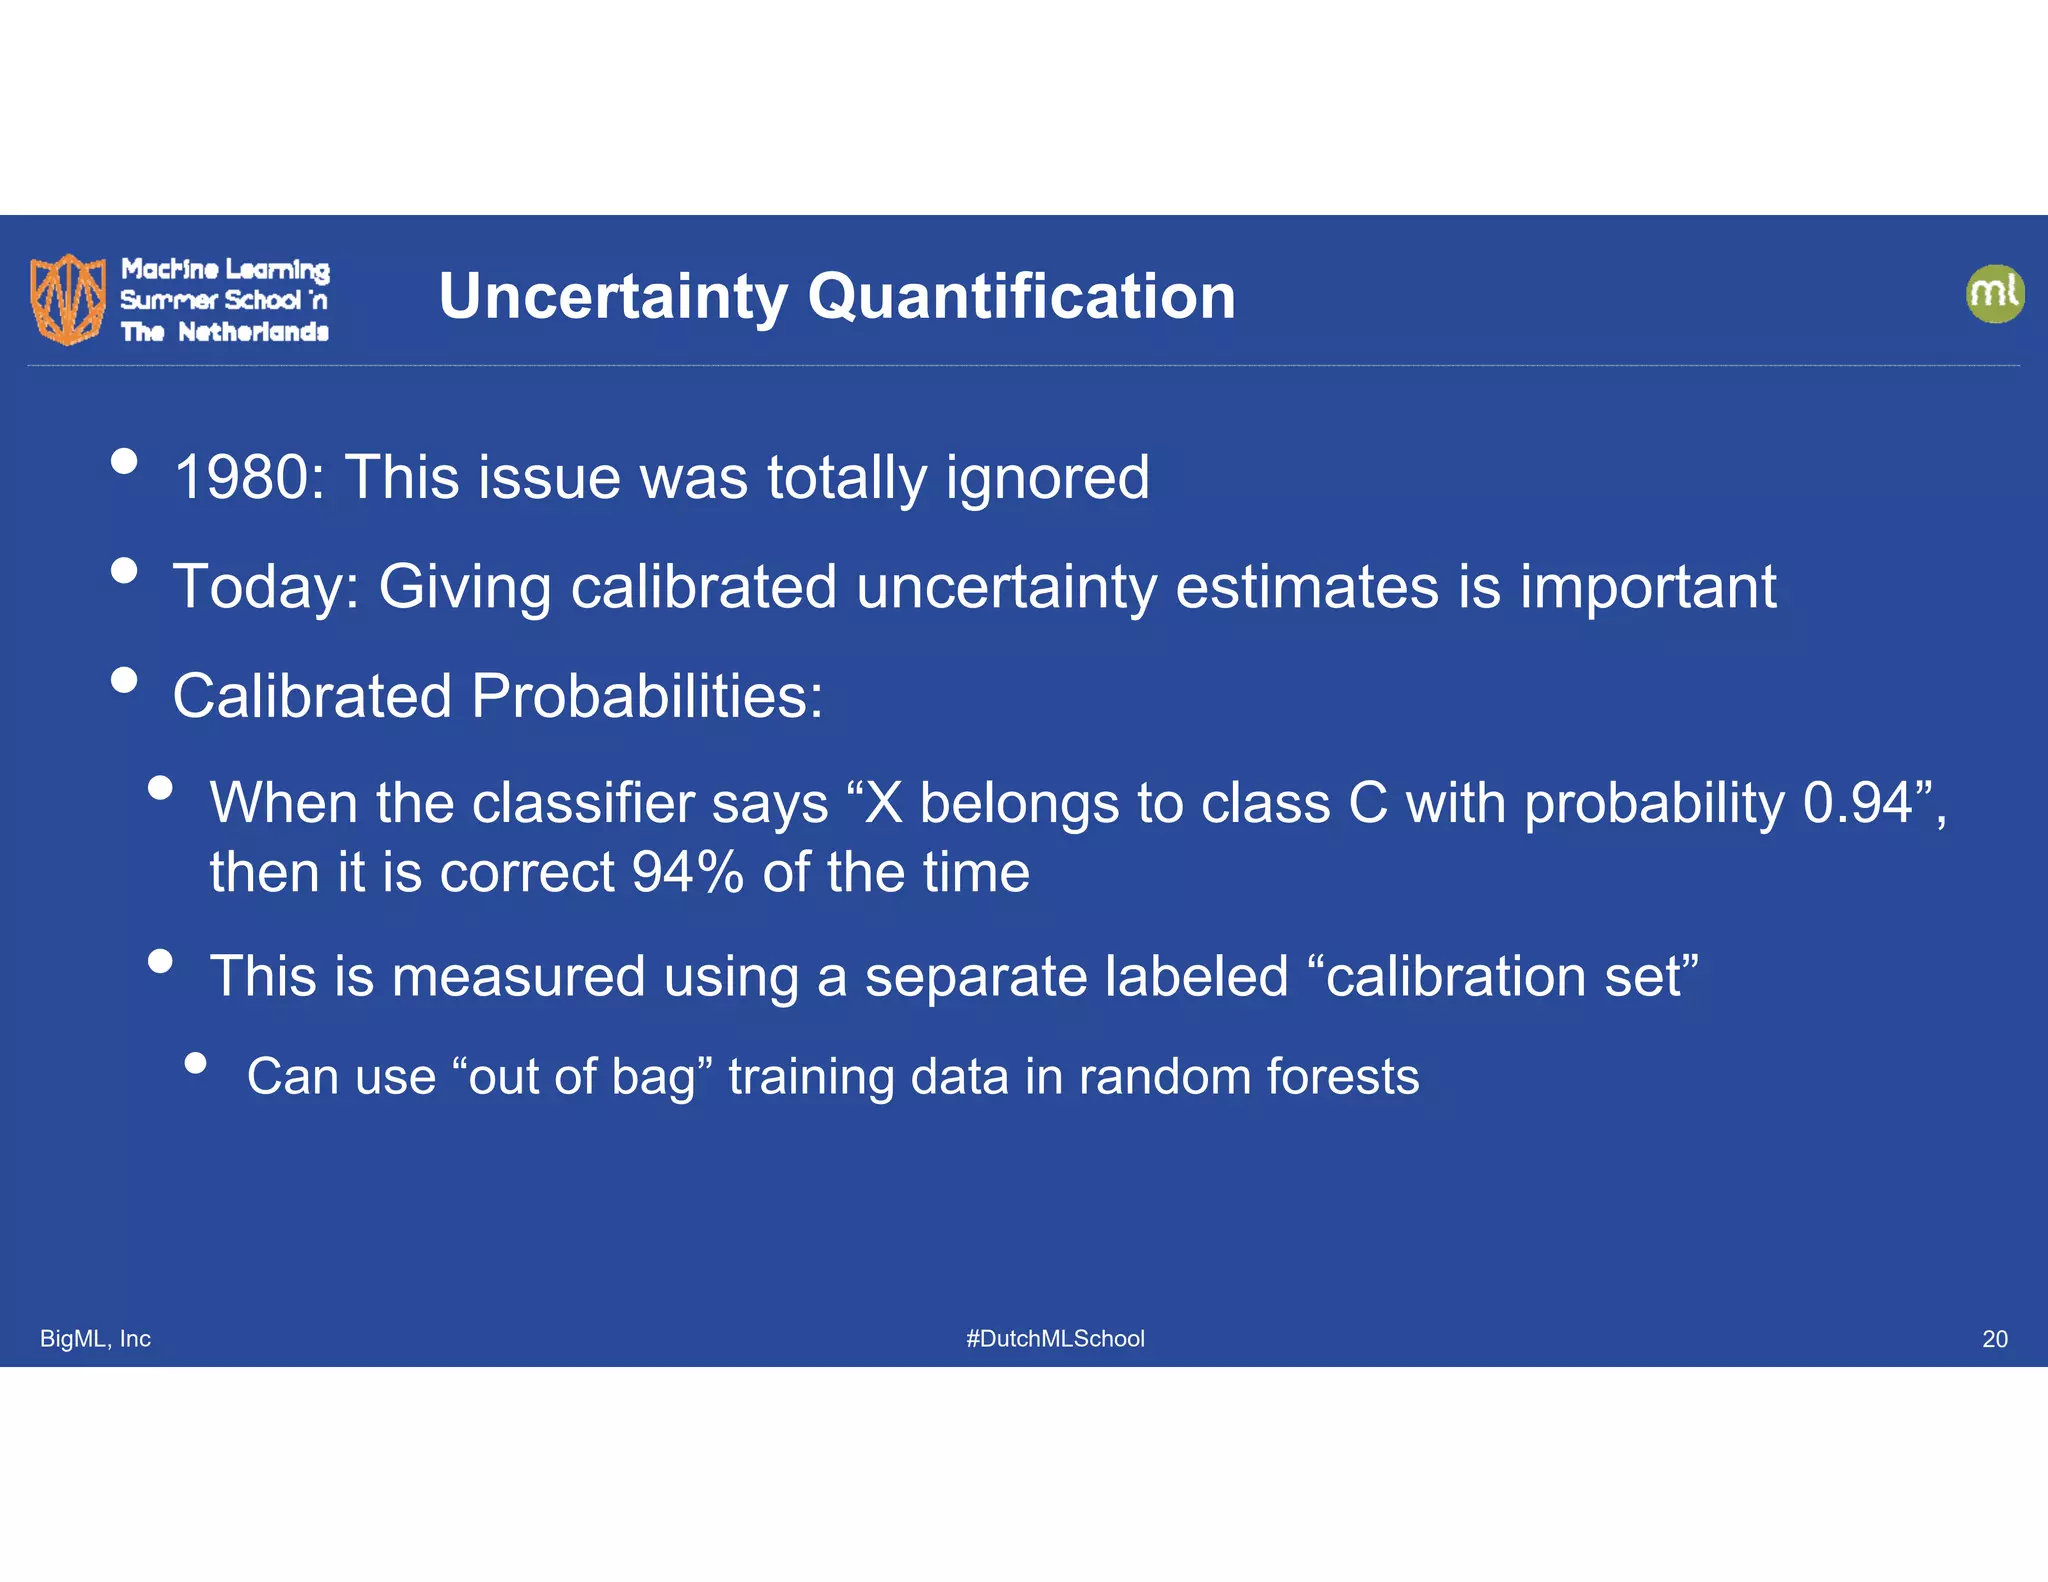
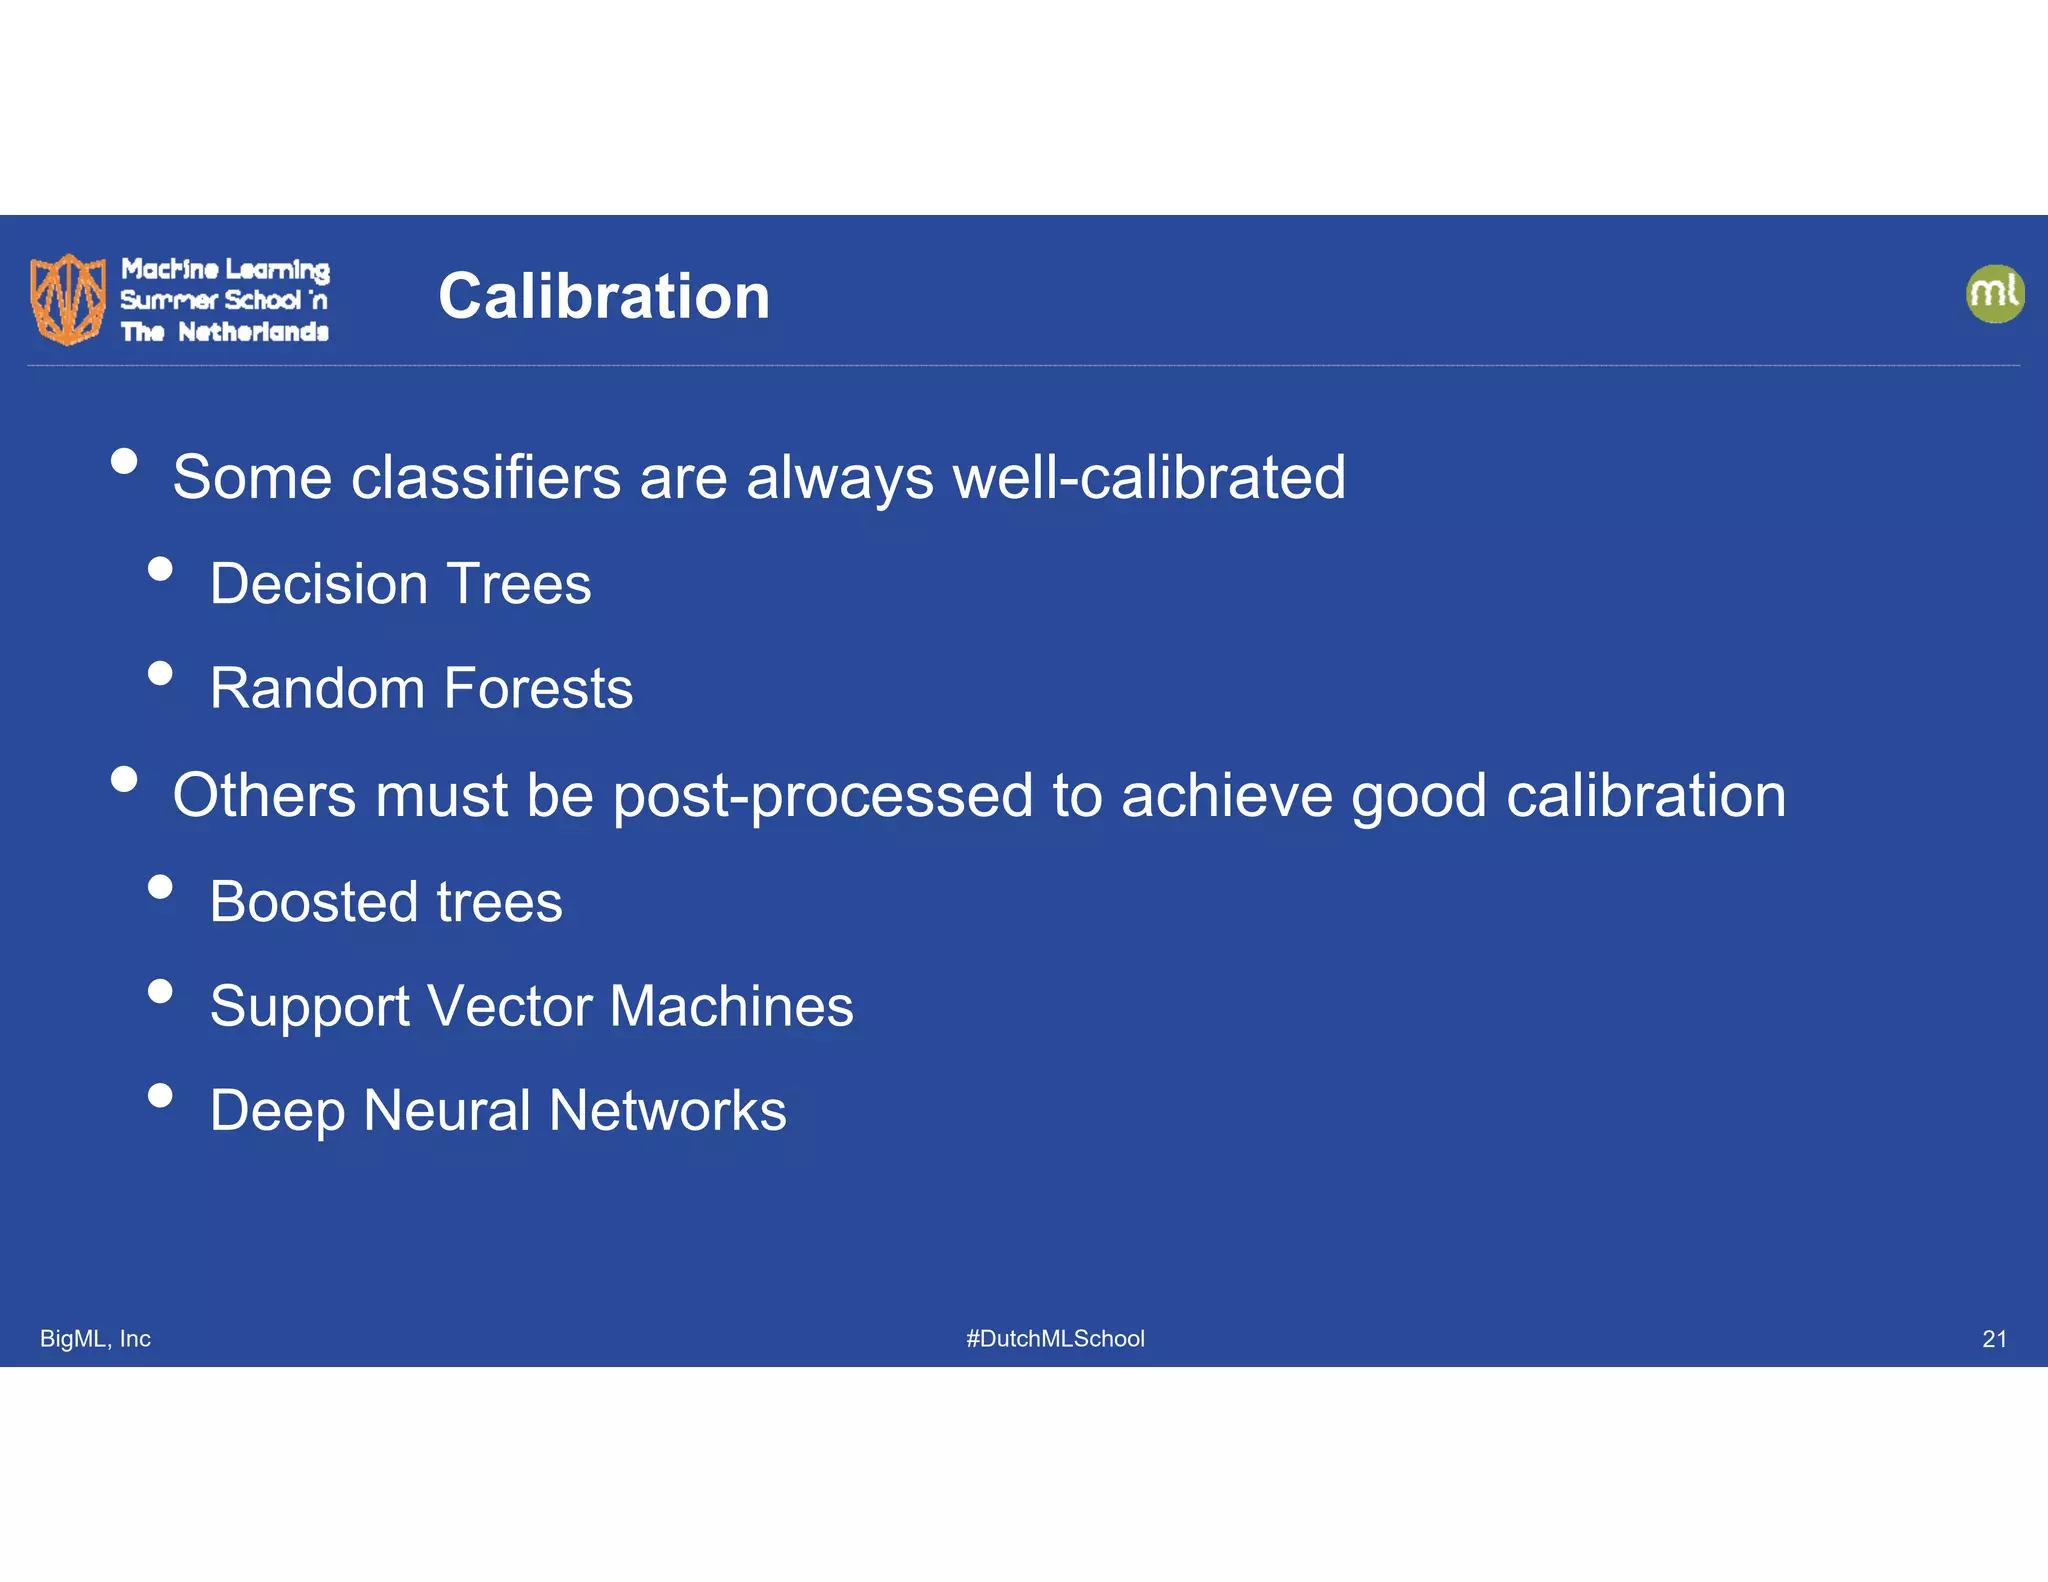
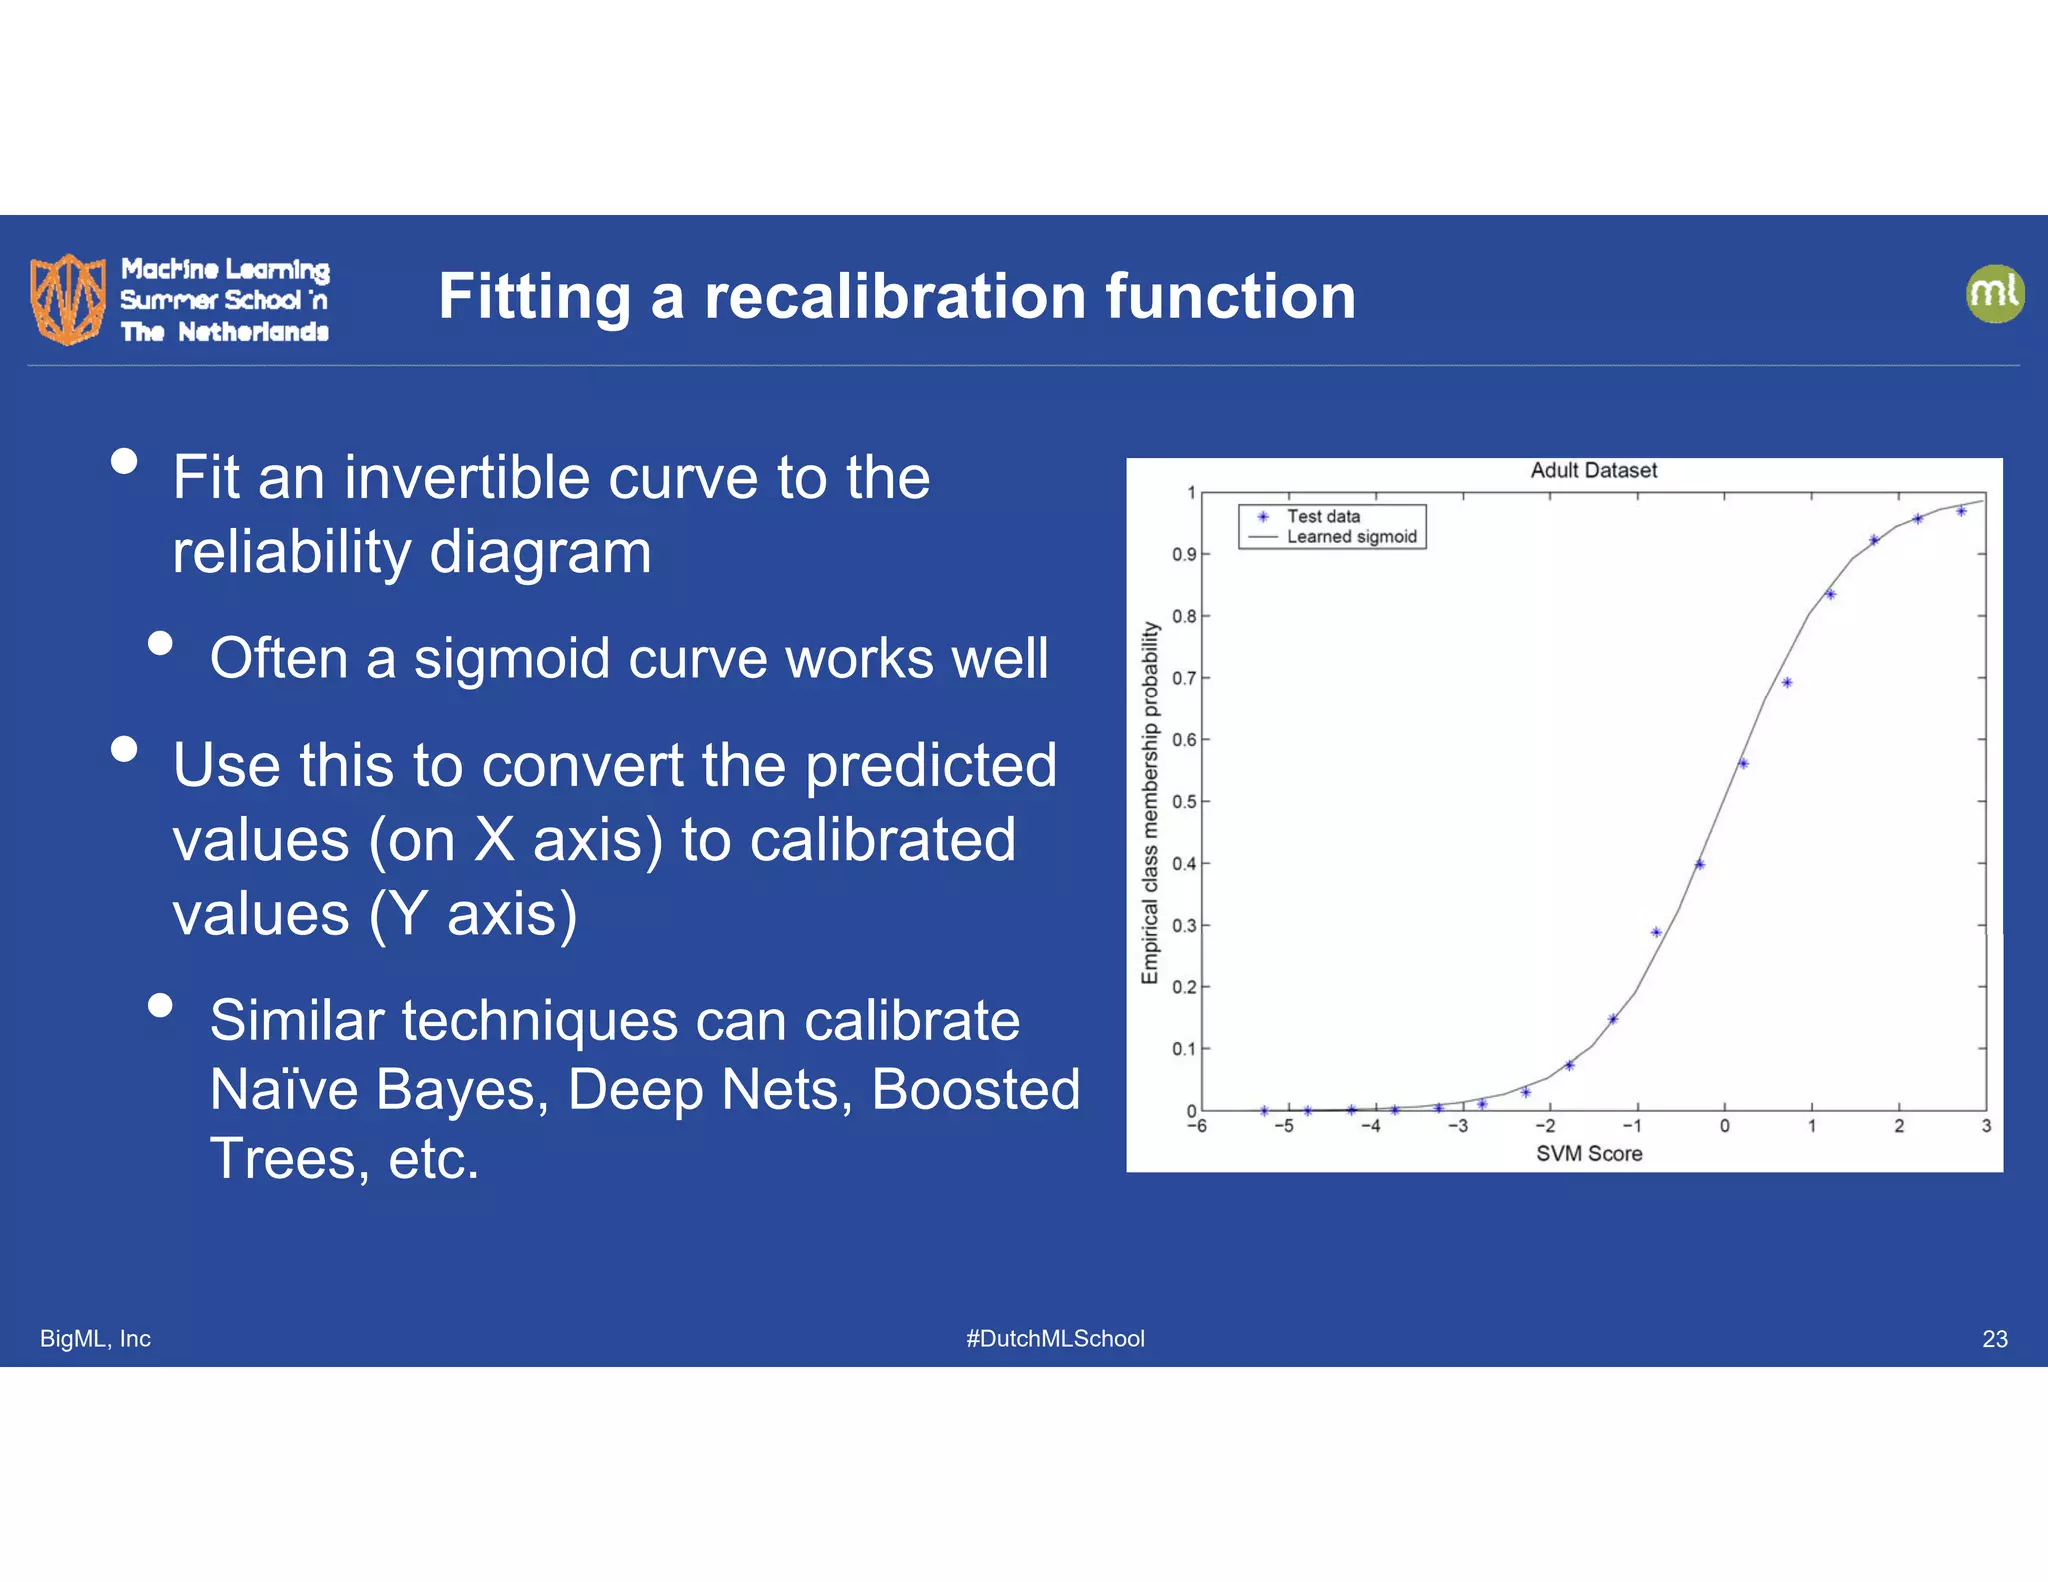
This document discusses the evolution and challenges in machine learning since its inception, covering topics such as generalization, feature engineering, explanation, uncertainty quantification, run-time monitoring, and evaluation metrics. It emphasizes the significance of causal transportability, the careful design of features, the necessity for uncertainty calibration, and the importance of application-specific evaluation metrics. The document highlights ongoing research and practical implications in addressing these challenges within the machine learning field.


![[DSC Europe 25] Branko Dzakula - From Defense to Attack: How AI Redefines Cyb...](https://cdn.slidesharecdn.com/ss_thumbnails/80bdzdxpr3ky2g0qvyk9-8-251211083048-ce5fc1ee-thumbnail.jpg?width=640&height=640&fit=bounds)
![[DSC Europe 25] Bassam Maharmeh - Artificial Intelligence: Opportunities and ...](https://cdn.slidesharecdn.com/ss_thumbnails/thhfmr2fqpawzj7hsjpg-5-251211083048-2c23204f-thumbnail.jpg?width=640&height=640&fit=bounds)


![[DSC Europe 25] Katherine Forrest - AI NOW: Understanding the Velocity of Cha...](https://cdn.slidesharecdn.com/ss_thumbnails/wvvbruqfrci0sfq9xwgb-4-251212104007-e5ad1987-thumbnail.jpg?width=640&height=640&fit=bounds)

![[DSC Europe 25] Branko Urosevic -Rethinking Financial Talent: Integrating Cod...](https://cdn.slidesharecdn.com/ss_thumbnails/8jjrus8ttko6qj64f58f-3-251212103250-642c6374-thumbnail.jpg?width=640&height=640&fit=bounds)


![[DSC Europe 25] Dunja Adzic Jovanovic - AI and Cybersecurity: Defending Data ...](https://cdn.slidesharecdn.com/ss_thumbnails/o1zylpbhrtwnixxq2xj8-7-251211083048-185086f6-thumbnail.jpg?width=640&height=640&fit=bounds)

![[DSC Europe 25] Danica Soc - The Science Behind Marketing: Experimentation me...](https://cdn.slidesharecdn.com/ss_thumbnails/c0nofsggs9gw5ucmallr-3-251216103155-56bd64d1-thumbnail.jpg?width=640&height=640&fit=bounds)
![[DSC Europe 25] Dusan Nesic - Securing Tomorrow’s Infrastructure: Why Cyber-P...](https://cdn.slidesharecdn.com/ss_thumbnails/qikbszfftyowjm2q6duw-1-251211083848-8f2ead6b-thumbnail.jpg?width=640&height=640&fit=bounds)
![[DSC Europe 25] Nikolay Burlutskiy - Best Practices for Building Enterprise M...](https://cdn.slidesharecdn.com/ss_thumbnails/uirvaiuvq8y1w8hzd9tx-7-251212103249-2619edb4-thumbnail.jpg?width=640&height=640&fit=bounds)


