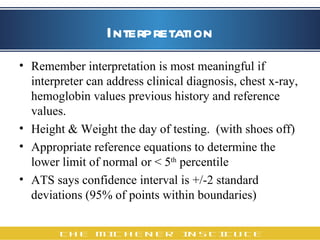
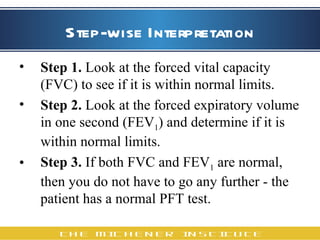
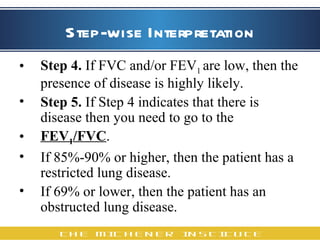
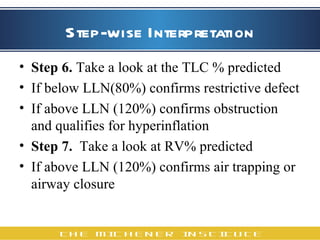
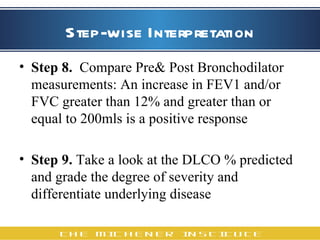
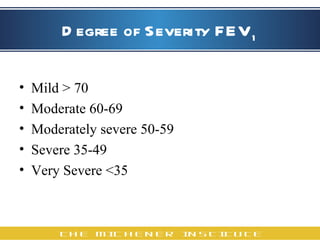
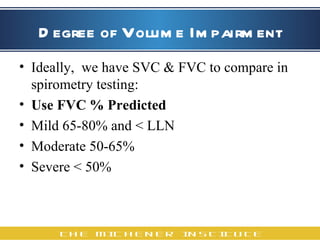
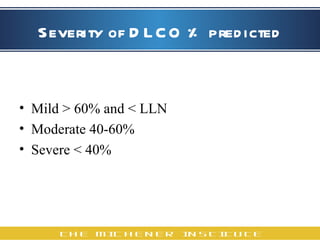
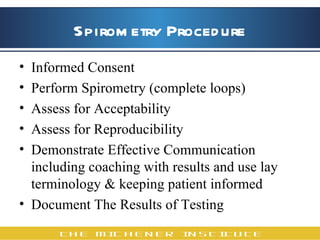
Spirometry Workshop
Today…. Review Spirometry-Video Notes on BB Indications/Contraindications Informed Consent, How many?  ATS criteria for acceptability & reproducibility Reporting Values & Looking at the Loops  Coaching with Efforts & Comments Interpretation of Testing & Steps  Live Testing
Interpretation Remember interpretation is most meaningful if interpreter can address clinical diagnosis, chest x-ray, hemoglobin values previous history and reference values. Height & Weight the day of testing.  (with shoes off) Appropriate reference equations to determine the lower limit of normal or < 5 th  percentile  ATS says confidence interval is +/-2 standard deviations (95% of points within boundaries)
Step-wise Interpretation Step 1.  Look at the forced vital capacity (FVC) to see if it is within normal limits.  Step 2.  Look at the forced expiratory volume in one second (FEV 1 ) and determine if it is within normal limits.  Step 3.  If both FVC and FEV 1  are normal, then you do not have to go any further - the patient has a normal PFT test.
Step-wise Interpretation Step 4.  If FVC and/or FEV 1  are low, then the presence of disease is highly likely.   Step 5.  If Step 4 indicates that there is disease then you need to go to the  FEV 1 /FVC .   If 85%-90% or higher, then the patient has a restricted lung disease.  If 69% or lower, then the patient has an obstructed lung disease.
Step-wise Interpretation Step 6.  Take a look at the TLC % predicted If below LLN(80%) confirms restrictive defect If above LLN (120%) confirms obstruction and qualifies for hyperinflation  Step 7.   Take a look at RV% predicted  If above LLN (120%) confirms air trapping or airway closure
Step-wise Interpretation Step 8.   Compare Pre& Post Bronchodilator measurements: An increase in FEV1 and/or FVC greater than 12% and greater than or equal to 200mls is a positive response   Step 9.  Take a look at the DLCO % predicted  and grade the degree of severity and differentiate underlying disease
Degree of Severity FEV 1 Mild > 70 Moderate 60-69 Moderately severe 50-59 Severe 35-49 Very Severe <35
Degree of Volume Impairment Ideally,  we have SVC & FVC to compare in spirometry testing:  Use FVC % Predicted Mild 65-80% and < LLN Moderate 50-65% Severe < 50%
Severity of DLCO % predicted Mild > 60% and < LLN Moderate 40-60% Severe < 40%
Spirometry Procedure Informed Consent Perform Spirometry (complete loops)  Assess for Acceptability Assess for Reproducibility Demonstrate Effective Communication including coaching with results and use lay terminology & keeping patient informed Document The Results of Testing
References The Ontario Lung Association-HC Providers CD-Interactive Spirometry in Primary Care ATS/ERS Interpretive Strategies for Lung Function Tests  http://www.thoracic.org/sections/publications/statements/pages/pfet/pft5.html

Spirometry workshop

  • 1.
  • 2.
    Today…. Review Spirometry-VideoNotes on BB Indications/Contraindications Informed Consent, How many? ATS criteria for acceptability & reproducibility Reporting Values & Looking at the Loops Coaching with Efforts & Comments Interpretation of Testing & Steps Live Testing
  • 3.
    Interpretation Remember interpretationis most meaningful if interpreter can address clinical diagnosis, chest x-ray, hemoglobin values previous history and reference values. Height & Weight the day of testing. (with shoes off) Appropriate reference equations to determine the lower limit of normal or < 5 th percentile ATS says confidence interval is +/-2 standard deviations (95% of points within boundaries)
  • 4.
    Step-wise Interpretation Step1. Look at the forced vital capacity (FVC) to see if it is within normal limits. Step 2. Look at the forced expiratory volume in one second (FEV 1 ) and determine if it is within normal limits. Step 3. If both FVC and FEV 1 are normal, then you do not have to go any further - the patient has a normal PFT test.
  • 5.
    Step-wise Interpretation Step4. If FVC and/or FEV 1 are low, then the presence of disease is highly likely. Step 5. If Step 4 indicates that there is disease then you need to go to the FEV 1 /FVC . If 85%-90% or higher, then the patient has a restricted lung disease. If 69% or lower, then the patient has an obstructed lung disease.
  • 6.
    Step-wise Interpretation Step6. Take a look at the TLC % predicted If below LLN(80%) confirms restrictive defect If above LLN (120%) confirms obstruction and qualifies for hyperinflation Step 7. Take a look at RV% predicted If above LLN (120%) confirms air trapping or airway closure
  • 7.
    Step-wise Interpretation Step8. Compare Pre& Post Bronchodilator measurements: An increase in FEV1 and/or FVC greater than 12% and greater than or equal to 200mls is a positive response Step 9. Take a look at the DLCO % predicted and grade the degree of severity and differentiate underlying disease
  • 8.
    Degree of SeverityFEV 1 Mild > 70 Moderate 60-69 Moderately severe 50-59 Severe 35-49 Very Severe <35
  • 9.
    Degree of VolumeImpairment Ideally, we have SVC & FVC to compare in spirometry testing: Use FVC % Predicted Mild 65-80% and < LLN Moderate 50-65% Severe < 50%
  • 10.
    Severity of DLCO% predicted Mild > 60% and < LLN Moderate 40-60% Severe < 40%
  • 11.
    Spirometry Procedure InformedConsent Perform Spirometry (complete loops) Assess for Acceptability Assess for Reproducibility Demonstrate Effective Communication including coaching with results and use lay terminology & keeping patient informed Document The Results of Testing
  • 12.
    References The OntarioLung Association-HC Providers CD-Interactive Spirometry in Primary Care ATS/ERS Interpretive Strategies for Lung Function Tests http://www.thoracic.org/sections/publications/statements/pages/pfet/pft5.html