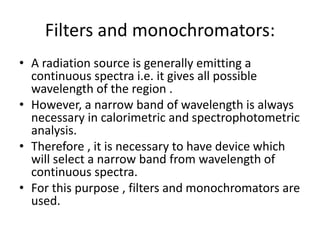
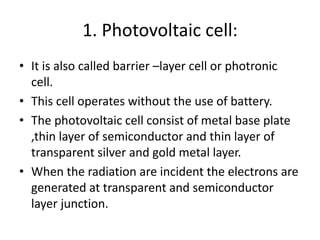
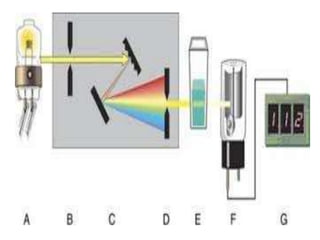
1. A spectrophotometer is an instrument that measures the intensity of light at different wavelengths absorbed by a sample. It uses a monochromator to select specific wavelengths and a detector such as a phototube to measure the intensity of transmitted light.
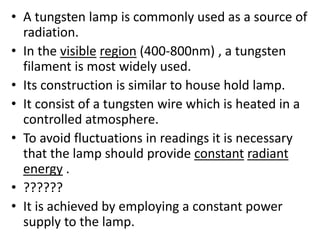
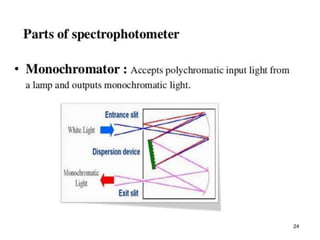
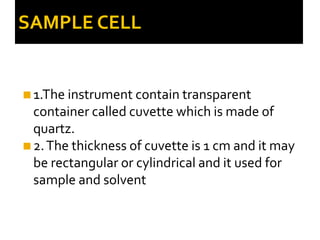
2. Key components include a radiant light source, monochromator to select wavelengths, a sample cell, and a detector. Common light sources are tungsten lamps and detectors include phototubes and photomultiplier tubes.
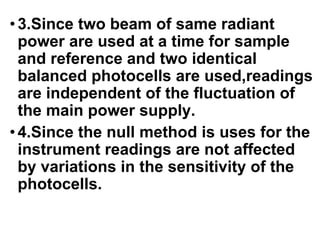
3. Spectrophotometers can be used for quantitative analysis using Beer's Law. The absorbance measured is directly proportional to the concentration of absorbing substances and path length. Double beam instruments compensate for fluctuations and noise in


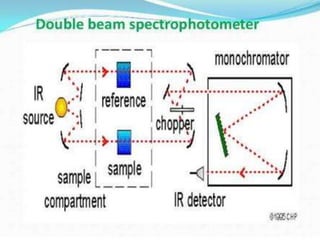


![▶ The geometrical isomerism of complexs can be
easily distinguished from their visible absorption
spectra.
▶ Example-
▶ The cis isomer of [Co(en)2 F2]NO3 is violet where
as the trans isomer is green.
Geometrical isomerism](https://image.slidesharecdn.com/spectrophotometry-191218095634/85/Spectrophotometry-120-320.jpg)
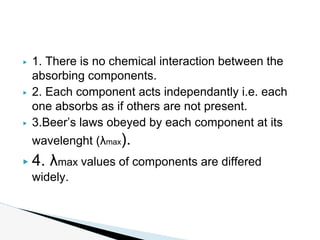
![▶ The change in colour in cis [Ni (trisethylene
diamine) (H2O)2]²+ from blue to yellow on adding
inert salt to the solution has been shown from
absorption spectra to involve an equilibrium
between octahedral and planar configurations.
Octahedral – planar equilibrium](https://image.slidesharecdn.com/spectrophotometry-191218095634/85/Spectrophotometry-121-320.jpg)


![▶ 1.A] position and intensity of absorption band
and chromophore –
▶ The term chromophore can be define as any
group in the molecule which exhibits absorption of
electromagnetic radiation in the visible or UV
reagion.
Qualitative analysis](https://image.slidesharecdn.com/spectrophotometry-191218095634/85/Spectrophotometry-124-320.jpg)


