SlideShare a Scribd company logo
Método dos Quadrados Mínimos
Lista 4 no Canvas
Método dos Quadrados Mínimos (ou Mínimos
Quadrados)
Vimos que a interpolação polinomial pode ser usada
para aproximar uma função por outra. Usamos quando:
1) não temos a expressão da função (só um conjunto de
pontos tabelados) ou
2) temos a expressão mas ela é bem complicada
E queremos obter valores dentro do intervalo de
tabelamento.
A interpolação polinomial respeita a igualdade
pn(xi) = f(xi) onde xi são os pontos escolhidos para a
aproximação.
Porém a interpolação não é aconselhável quando:
a) queremos prever um valor fora do intervalo de tabelamento ou
b) queremos por exemplo usar 10 pontos para aproximar por uma reta.
Como fazer isso? Se a reta só precisa de 2 pontos?
Nesses casos vamos usar M.Q.M. → método de ajuste de curvas
0
2
4
6
8
10
12
14
16
18
0 2 4 6 8 10 12
x f(x)
1 1,3
2 3,5
3 4,2
4 5
5 7
6 8,8
7 10,1
8 12,5
9 13
10 15,6
Caso Discreto:
Dados os pontos tabelados (x1,f(x1)), (x2,f(x2)) , ..., (xm,f(xm)) queremos determinar os
coeficientes 1, 2,..., n tal que g(x) se aproxime ao máximo de f(x) nos pontos k = 1, .., m
sendo g x = 𝛼1. 𝑔1 𝑥 + 𝛼2. 𝑔2 𝑥 + ⋯ + 𝛼𝑛. 𝑔𝑛 𝑥
• E quem são essas funções gi(x)? São as funções que iremos escolher para aproximar pelo
M.Q.M.
• Como escolher? Na maioria dos casos olhando o gráfico de dispersão e em alguns casos, se já
soubermos o comportamento dos dados, usamos a função pré-escolhida para aproximar.
• Olhando o exemplo anterior conseguimos ver que o comportamento do gráfico se parece
com uma reta. Nesse caso teremos g(x) = 𝛼1. 𝑥 + 𝛼2. 1 ou seja,
g1(x) = x e g2(x) = 1.
• E como achar os ’s?
• A ideia do M.Q.M. é que g(x) seja o mais próximo possível de f(x) nos pontos tabelados. Isso
significa que a diferença entre g(x) e f(x) em cada ponto xk deve ser mínima, ou seja,
𝑑𝑘 = f 𝑥𝑘 − g 𝑥𝑘 deve ser mínima.
• O M.Q.M. consiste em minimizar a soma dos quadrados dessas diferenças, isto é:
෍
𝑘=1
𝑚
𝑓 𝑥𝑘 − 𝑔(𝑥𝑘) 2
Vamos chamar essa diferença de F(1, 2,..., n). Então:
F(α1, α2, … , α𝑛) = ෍
𝑘=1
𝑚
𝑓 𝑥𝑘 − 𝑔(𝑥𝑘) 2
F(α1, α2, … , α𝑛) = ෍
𝑘=1
𝑚
𝑓 𝑥𝑘 − 𝛼1. 𝑔1 𝑥𝑘 − 𝛼2. 𝑔2 𝑥𝑘 − ⋯ − 𝛼𝑛. 𝑔𝑛 𝑥𝑘
2
Sabemos que para obter um ponto de mínimo de F(1, 2,..., n) temos que
determinar seus pontos críticos, isto é,
𝜕𝐹 𝛼1,𝛼2,…,𝛼𝑛
𝜕𝛼𝑖
= 0 para i = 1,2,...,n [1]
• Ao desenvolvermos [1] para cada derivada parcial de i (usando regra da cadeia)
teremos:
𝜕𝐹 𝛼1,𝛼2,…,𝛼𝑛
𝜕𝛼𝑖
= 2. σ𝑘=1
𝑚
𝑓 𝑥𝑘 − 𝛼1. 𝑔1 𝑥𝑘 − ⋯ − 𝛼𝑛. 𝑔𝑛 𝑥𝑘 . (−𝑔𝑖(𝑥𝑘))
• Ao desenvolvermos [1] para cada derivada parcial de i (usando regra da cadeia) teremos:
𝜕𝐹 𝛼1,𝛼2,…,𝛼𝑛
𝜕𝛼𝑖
= 2. σ𝑘=1
𝑚
𝑓 𝑥𝑘 − 𝛼1. 𝑔1 𝑥𝑘 − ⋯ − 𝛼𝑛. 𝑔𝑛 𝑥𝑘 . (−𝑔𝑖(𝑥𝑘))
Fazendo para todos os ’s e agrupando teremos um sistema linear em  com n equações e n
incógnitas (os ’s )
A. = b onde A = [aij]nxn e b = [bi] são dados por:
𝑎𝑖𝑗 = ෍
𝑘=1
𝑚
𝑔𝑖 𝑥𝑘 . 𝑔𝑗 𝑥𝑘 = 𝑎𝑗𝑖
(matriz A é simétrica)
𝑏𝑖 = ෍
𝑘=1
𝑚
𝑔𝑖 𝑥𝑘 . 𝑓(𝑥𝑘)
• E os ’s serão obtidos resolvendo um sistema linear por algum método que já conhecem.
• Vamos ver um Exemplo.
• Exemplo: Considere a tabela:
Aproximar f(x) usando M.Q.M.
a) uma reta
b) um polinômio de grau 2 completo (ou parábola completa)
130
135
140
145
150
155
160
0 0,05 0,1 0,15 0,2 0,25 0,3 0,35
f(x)
x f(x)
0 132
0,2 148
0,3 157
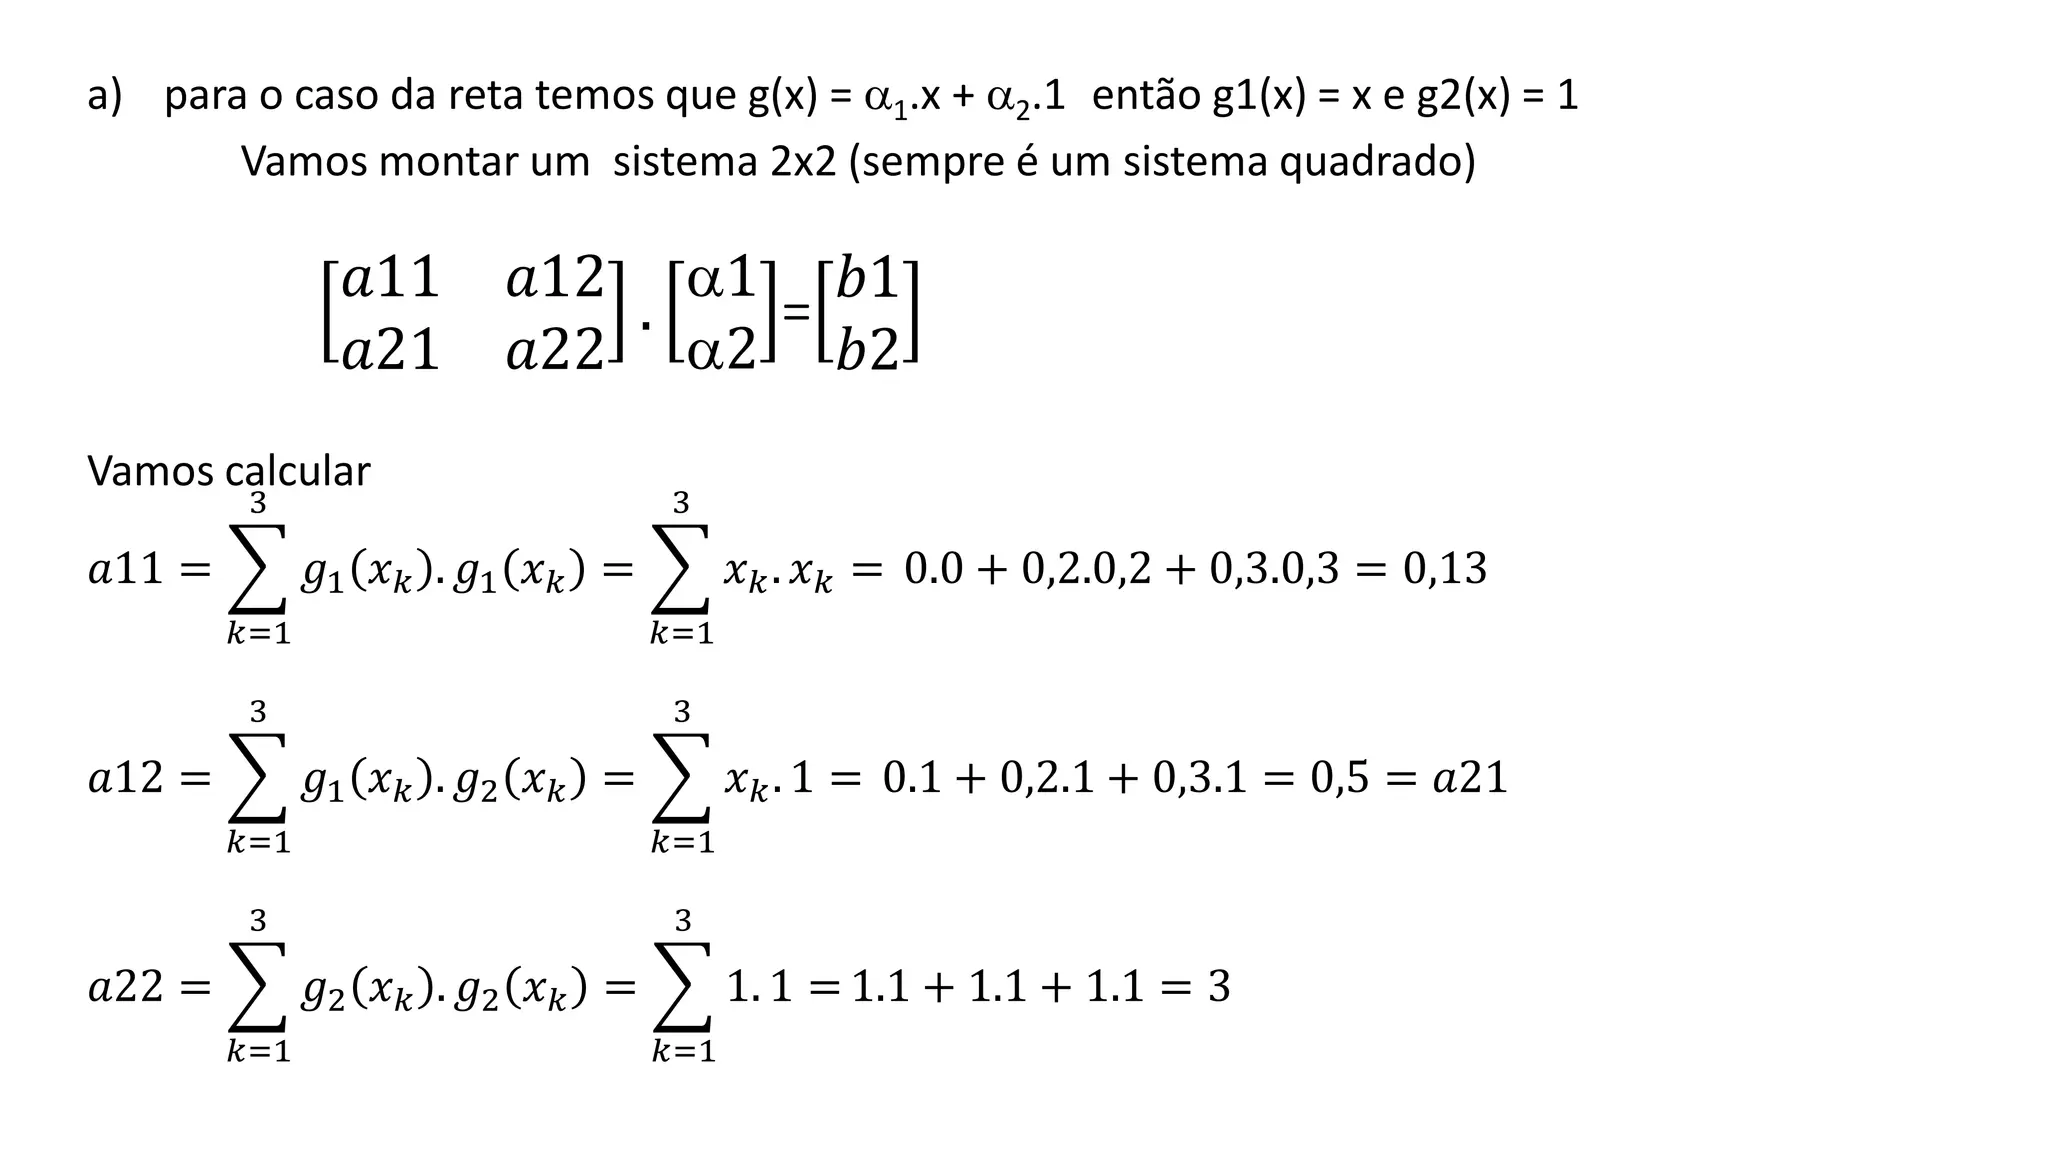
a) para o caso da reta temos que g(x) = 1.x + 2.1 então g1(x) = x e g2(x) = 1
Vamos montar um sistema 2x2 (sempre é um sistema quadrado)
𝑎11 𝑎12
𝑎21 𝑎22
.
1
2
=
𝑏1
𝑏2
Vamos calcular
𝑎11 =
𝑎12 =
𝑎22 =
b1 =
b2 =
a) para o caso da reta temos que g(x) = 1.x + 2.1 então g1(x) = x e g2(x) = 1
Vamos montar um sistema 2x2 (sempre é um sistema quadrado)
𝑎11 𝑎12
𝑎21 𝑎22
.
1
2
=
𝑏1
𝑏2
Vamos calcular
𝑎11 = ෍
𝑘=1
3
𝑔1 𝑥𝑘 . 𝑔1 𝑥𝑘 = ෍
𝑘=1
3
𝑥𝑘. 𝑥𝑘 = 0.0 + 0,2.0,2 + 0,3.0,3 = 0,13
𝑎12 = ෍
𝑘=1
3
𝑔1 𝑥𝑘 . 𝑔2 𝑥𝑘 = ෍
𝑘=1
3
𝑥𝑘. 1 = 0.1 + 0,2.1 + 0,3.1 = 0,5 = 𝑎21
𝑎22 = ෍
𝑘=1
3
𝑔2 𝑥𝑘 . 𝑔2 𝑥𝑘 = ෍
𝑘=1
3
1. 1 = 1.1 + 1.1 + 1.1 = 3
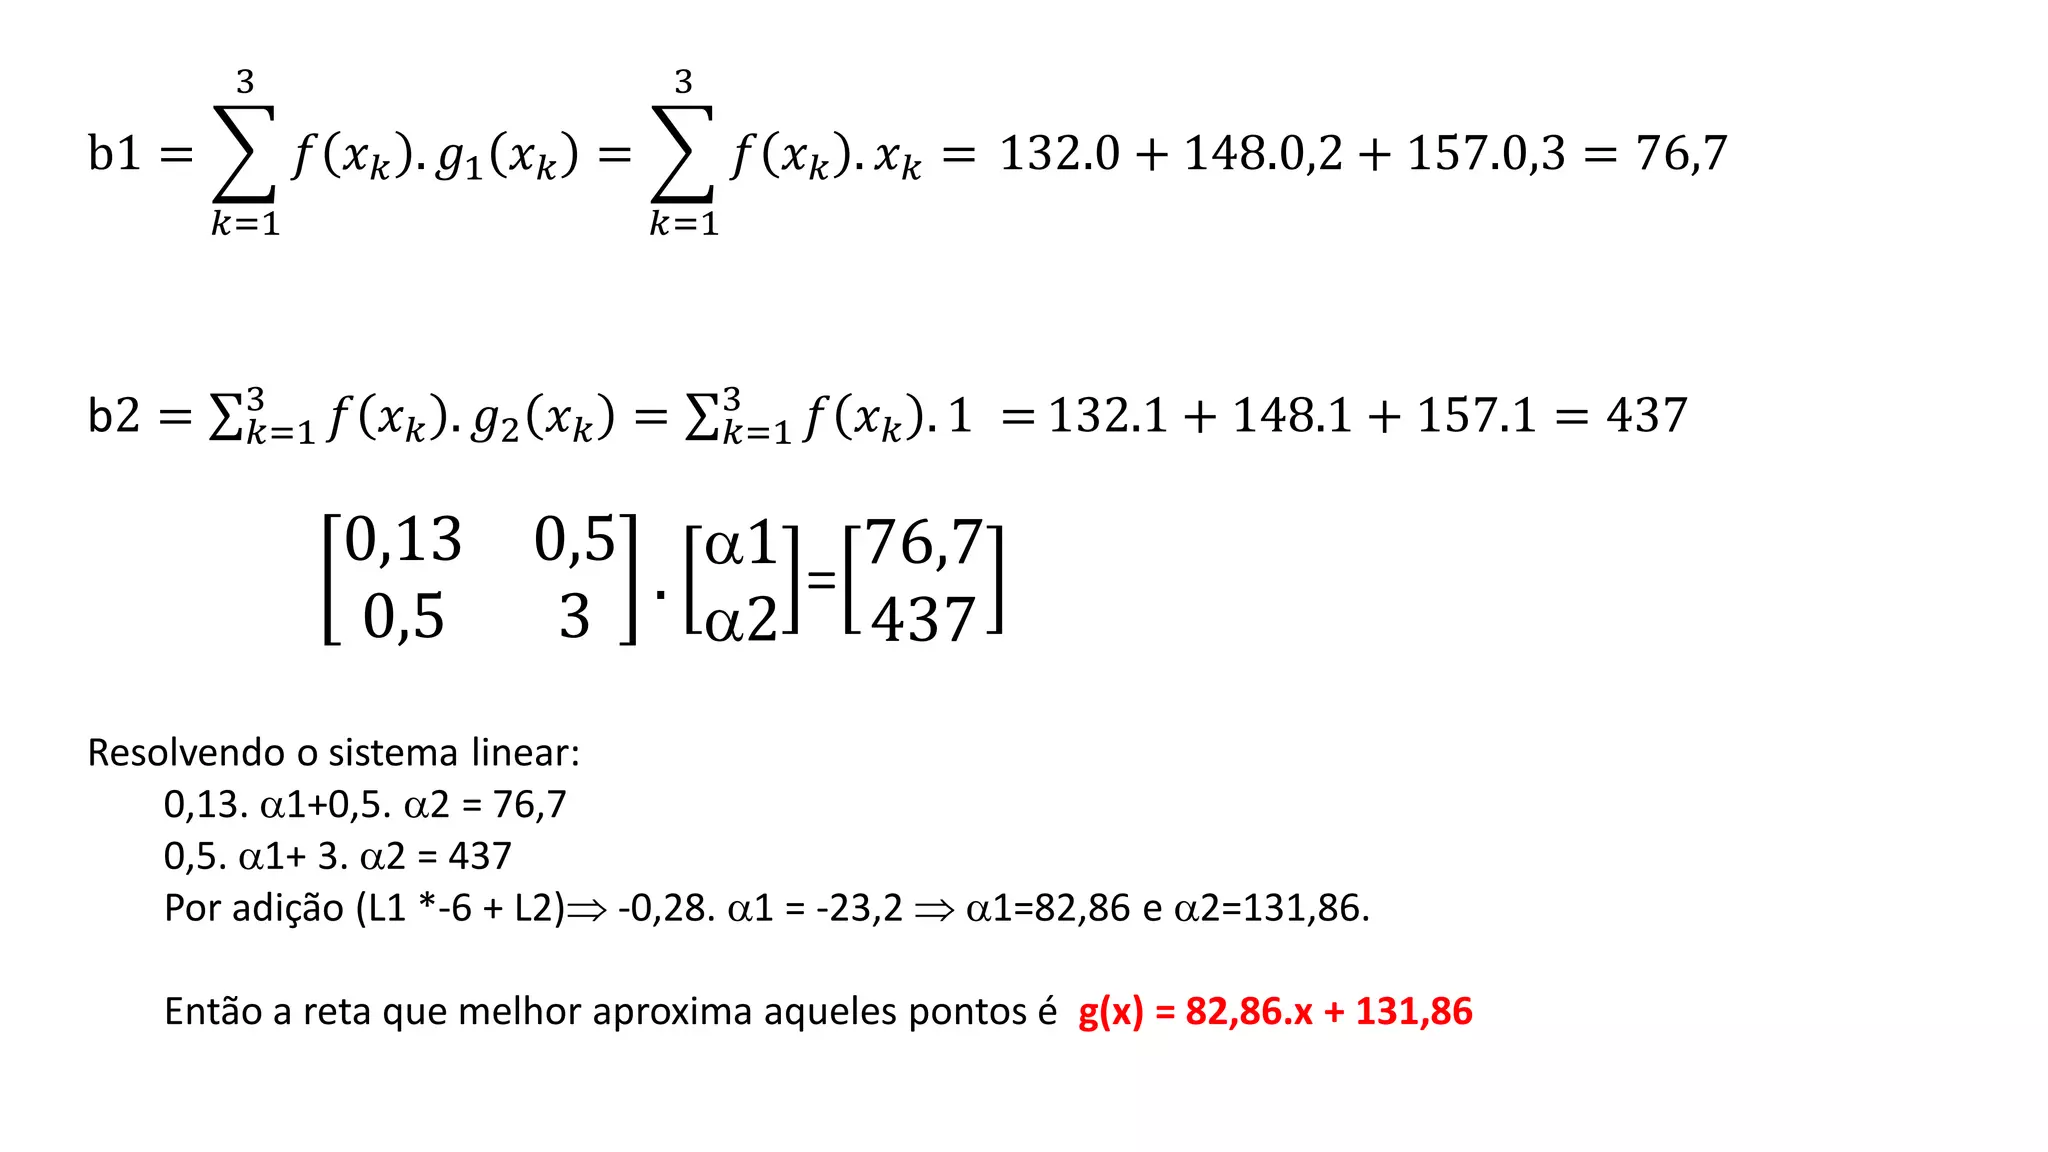
b1 = ෍
𝑘=1
3
𝑓 𝑥𝑘 . 𝑔1 𝑥𝑘 = ෍
𝑘=1
3
𝑓 𝑥𝑘 . 𝑥𝑘 = 132.0 + 148.0,2 + 157.0,3 = 76,7
b2 = σ𝑘=1
3
𝑓 𝑥𝑘 . 𝑔2 𝑥𝑘 = σ𝑘=1
3
𝑓 𝑥𝑘 . 1 = 132.1 + 148.1 + 157.1 = 437
0,13 0,5
0,5 3
.
1
2
=
76,7
437
Resolvendo o sistema linear:
0,13. 1+0,5. 2 = 76,7
0,5. 1+ 3. 2 = 437
Por adição (L1 *-6 + L2) -0,28. 1 = -23,2  1=82,86 e 2=131,86.
Então a reta que melhor aproxima aqueles pontos é g(x) = 82,86.x + 131,86
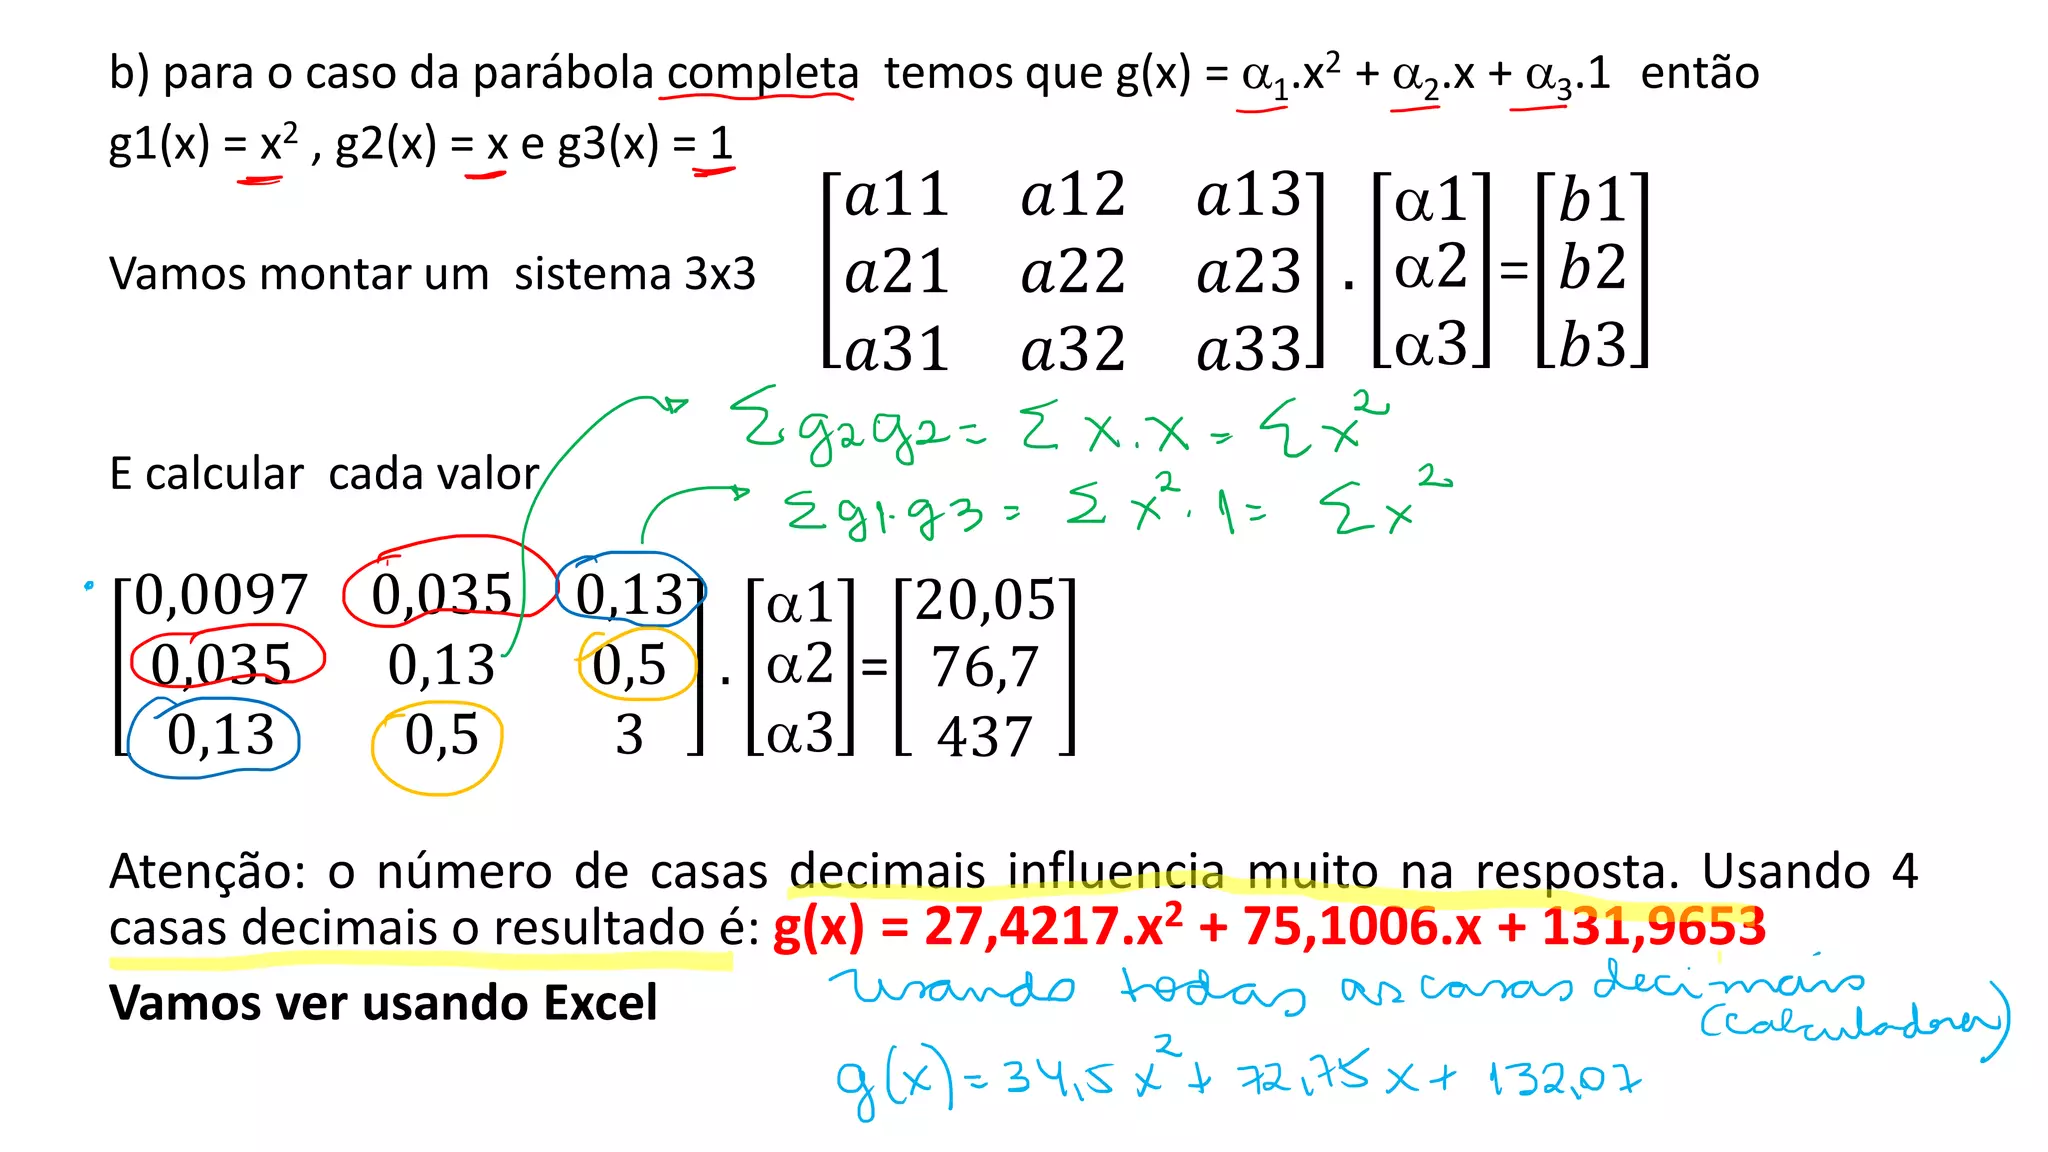
b) para o caso da parábola completa temos que g(x) = 1.x2 + 2.x + 3.1 então
g1(x) = x2 , g2(x) = x e g3(x) = 1
Vamos montar um sistema 3x3
𝑎11 𝑎12 𝑎13
𝑎21 𝑎22 𝑎23
𝑎31 𝑎32 𝑎33
.
1
2
3
=
𝑏1
𝑏2
𝑏3
E calcular cada valor
0,0097 0,035 0,13
0,035 0,13 0,5
0,13 0,5 3
.
1
2
3
=
20,05
76,7
437
Atenção: o número de casas decimais influencia muito na resposta. Usando 4
casas decimais o resultado é: g(x) = 27,4217.x2 + 75,1006.x + 131,9653
Vamos ver usando Excel
Excel – monta tabela/marca os dados/ inserir gráfico de
dispersão/clicar em um dos pontos do gráfico com lado direito do
mouse/adicionar linha de tendência + escolher modelo de ajuste +
mostrar equação no gráfico + mostrar R2.
R2 – coeficiente de determinação. Mede a qualidade do ajuste
obtido, ou seja, mede o ajustamento de um modelo em relação aos
valores plotados. Varia de 0≤R2≤1. Quanto mais perto de 1 melhor o
ajuste!!
Vejam que no Excel o item b) do exemplo vai dar
g(x) = 33,333.x2 + 73,333.x + 132
Temos vários tipos de ajuste no Excel.
Obs: Exs da Lista 4 - com parábola incompleta só usaremos 2
alfas (Ex1, Ex2 b), Ex 4)

More Related Content

What's hot

Methods3 types of functions1
Methods3  types of functions1Methods3  types of functions1
Methods3 types of functions1kmcmullen
 
6.4 Graphing Polynomials (Relative Max/Min, Zeros)
6.4 Graphing Polynomials (Relative Max/Min, Zeros)6.4 Graphing Polynomials (Relative Max/Min, Zeros)
6.4 Graphing Polynomials (Relative Max/Min, Zeros)swartzje
 
Quadratic functions
Quadratic functionsQuadratic functions
Quadratic functions
Ivy Estrella
 
6.2 vertex form
6.2 vertex form6.2 vertex form
6.2 vertex formhisema01
 
Area between curves
Area between curvesArea between curves
Area between curves
Shaun Wilson
 
Area between curves
Area between curvesArea between curves
Area between curves
djfromal
 
Functions 1 - Math Academy - JC H2 maths A levels
Functions 1 - Math Academy - JC H2 maths A levelsFunctions 1 - Math Academy - JC H2 maths A levels
Functions 1 - Math Academy - JC H2 maths A levels
Math Academy Singapore
 
Definite Integral Review
Definite Integral ReviewDefinite Integral Review
Definite Integral ReviewSharon Henry
 
Areas between curves
Areas between curvesAreas between curves
Areas between curves
MoloyGorai
 
Area Under the Curve
Area Under the CurveArea Under the Curve
Area Under the Curvealexbeja
 
Lesson 10 techniques of integration
Lesson 10 techniques of integrationLesson 10 techniques of integration
Lesson 10 techniques of integration
Lawrence De Vera
 
3 Forms Of A Quadratic Function
3 Forms Of A Quadratic Function3 Forms Of A Quadratic Function
3 Forms Of A Quadratic Functionguestc8e5bb
 
Secant Method
Secant MethodSecant Method
Secant Method
Nasima Akhtar
 
Quadratics Final
Quadratics FinalQuadratics Final
Quadratics Finalpelican24
 

What's hot (17)

Methods3 types of functions1
Methods3  types of functions1Methods3  types of functions1
Methods3 types of functions1
 
6.4 Graphing Polynomials (Relative Max/Min, Zeros)
6.4 Graphing Polynomials (Relative Max/Min, Zeros)6.4 Graphing Polynomials (Relative Max/Min, Zeros)
6.4 Graphing Polynomials (Relative Max/Min, Zeros)
 
Quadratic functions
Quadratic functionsQuadratic functions
Quadratic functions
 
6.2 vertex form
6.2 vertex form6.2 vertex form
6.2 vertex form
 
Quadratic
QuadraticQuadratic
Quadratic
 
Area between curves
Area between curvesArea between curves
Area between curves
 
Graphing polynomials
Graphing polynomialsGraphing polynomials
Graphing polynomials
 
Area between curves
Area between curvesArea between curves
Area between curves
 
Functions 1 - Math Academy - JC H2 maths A levels
Functions 1 - Math Academy - JC H2 maths A levelsFunctions 1 - Math Academy - JC H2 maths A levels
Functions 1 - Math Academy - JC H2 maths A levels
 
L6 continuity
L6 continuityL6 continuity
L6 continuity
 
Definite Integral Review
Definite Integral ReviewDefinite Integral Review
Definite Integral Review
 
Areas between curves
Areas between curvesAreas between curves
Areas between curves
 
Area Under the Curve
Area Under the CurveArea Under the Curve
Area Under the Curve
 
Lesson 10 techniques of integration
Lesson 10 techniques of integrationLesson 10 techniques of integration
Lesson 10 techniques of integration
 
3 Forms Of A Quadratic Function
3 Forms Of A Quadratic Function3 Forms Of A Quadratic Function
3 Forms Of A Quadratic Function
 
Secant Method
Secant MethodSecant Method
Secant Method
 
Quadratics Final
Quadratics FinalQuadratics Final
Quadratics Final
 

Similar to Mqm em

Prova global 2 correção
Prova global 2 correçãoProva global 2 correção
Prova global 2 correção
Alexandra Oliveira, MBA
 
Natural and Clamped Cubic Splines
Natural and Clamped Cubic SplinesNatural and Clamped Cubic Splines
Natural and Clamped Cubic SplinesMark Brandao
 
Act_Fin_RMT
Act_Fin_RMTAct_Fin_RMT
Act_Fin_RMT
RobertoMartnezTapia
 
WEEK-4-Piecewise-Function-and-Rational-Function.pptx
WEEK-4-Piecewise-Function-and-Rational-Function.pptxWEEK-4-Piecewise-Function-and-Rational-Function.pptx
WEEK-4-Piecewise-Function-and-Rational-Function.pptx
ExtremelyDarkness2
 
Act_Fin_IAMT
Act_Fin_IAMTAct_Fin_IAMT
Act_Fin_IAMT
RobertoMartnezTapia
 
Analytic Geometry Period 1
Analytic Geometry Period 1Analytic Geometry Period 1
Analytic Geometry Period 1
ingroy
 
Matlab lab manual
Matlab lab manualMatlab lab manual
Matlab lab manual
nmahi96
 
Numeros reales y_plano_numerico1.1_compressed
Numeros reales y_plano_numerico1.1_compressedNumeros reales y_plano_numerico1.1_compressed
Numeros reales y_plano_numerico1.1_compressed
AntonelaSantana1
 
Calculus And Its Applications 10th Edition Bittinger Solutions Manual
Calculus And Its Applications 10th Edition Bittinger Solutions ManualCalculus And Its Applications 10th Edition Bittinger Solutions Manual
Calculus And Its Applications 10th Edition Bittinger Solutions Manual
fujumazaja
 
De la grafica a la funcion
De la grafica a la funcionDe la grafica a la funcion
De la grafica a la funcion
Ana Faraco
 
INTRODUCTION TO MATLAB presentation.pptx
INTRODUCTION TO MATLAB presentation.pptxINTRODUCTION TO MATLAB presentation.pptx
INTRODUCTION TO MATLAB presentation.pptx
Devaraj Chilakala
 
Quadratic equations
Quadratic equationsQuadratic equations
Quadratic equations
Mervin Dayrit
 
Maths iii quick review by Dr Asish K Mukhopadhyay
Maths iii quick review by Dr Asish K MukhopadhyayMaths iii quick review by Dr Asish K Mukhopadhyay
Maths iii quick review by Dr Asish K Mukhopadhyay
Dr. Asish K Mukhopadhyay
 
Solutions Manual for College Algebra Concepts Through Functions 3rd Edition b...
Solutions Manual for College Algebra Concepts Through Functions 3rd Edition b...Solutions Manual for College Algebra Concepts Through Functions 3rd Edition b...
Solutions Manual for College Algebra Concepts Through Functions 3rd Edition b...
RhiannonBanksss
 
C2 st lecture 2 handout
C2 st lecture 2 handoutC2 st lecture 2 handout
C2 st lecture 2 handoutfatima d
 
6.7 quadratic inequalities
6.7 quadratic inequalities6.7 quadratic inequalities
6.7 quadratic inequalitiesJessica Garcia
 
Introduction to Functions
Introduction to FunctionsIntroduction to Functions
Introduction to Functions
Melanie Loslo
 
Recurrence
RecurrenceRecurrence
Anderson expresiones
Anderson expresionesAnderson expresiones
Anderson expresiones
andersonmendoza22
 
Ca 1.6
Ca 1.6Ca 1.6
Ca 1.6
salamhello
 

Similar to Mqm em (20)

Prova global 2 correção
Prova global 2 correçãoProva global 2 correção
Prova global 2 correção
 
Natural and Clamped Cubic Splines
Natural and Clamped Cubic SplinesNatural and Clamped Cubic Splines
Natural and Clamped Cubic Splines
 
Act_Fin_RMT
Act_Fin_RMTAct_Fin_RMT
Act_Fin_RMT
 
WEEK-4-Piecewise-Function-and-Rational-Function.pptx
WEEK-4-Piecewise-Function-and-Rational-Function.pptxWEEK-4-Piecewise-Function-and-Rational-Function.pptx
WEEK-4-Piecewise-Function-and-Rational-Function.pptx
 
Act_Fin_IAMT
Act_Fin_IAMTAct_Fin_IAMT
Act_Fin_IAMT
 
Analytic Geometry Period 1
Analytic Geometry Period 1Analytic Geometry Period 1
Analytic Geometry Period 1
 
Matlab lab manual
Matlab lab manualMatlab lab manual
Matlab lab manual
 
Numeros reales y_plano_numerico1.1_compressed
Numeros reales y_plano_numerico1.1_compressedNumeros reales y_plano_numerico1.1_compressed
Numeros reales y_plano_numerico1.1_compressed
 
Calculus And Its Applications 10th Edition Bittinger Solutions Manual
Calculus And Its Applications 10th Edition Bittinger Solutions ManualCalculus And Its Applications 10th Edition Bittinger Solutions Manual
Calculus And Its Applications 10th Edition Bittinger Solutions Manual
 
De la grafica a la funcion
De la grafica a la funcionDe la grafica a la funcion
De la grafica a la funcion
 
INTRODUCTION TO MATLAB presentation.pptx
INTRODUCTION TO MATLAB presentation.pptxINTRODUCTION TO MATLAB presentation.pptx
INTRODUCTION TO MATLAB presentation.pptx
 
Quadratic equations
Quadratic equationsQuadratic equations
Quadratic equations
 
Maths iii quick review by Dr Asish K Mukhopadhyay
Maths iii quick review by Dr Asish K MukhopadhyayMaths iii quick review by Dr Asish K Mukhopadhyay
Maths iii quick review by Dr Asish K Mukhopadhyay
 
Solutions Manual for College Algebra Concepts Through Functions 3rd Edition b...
Solutions Manual for College Algebra Concepts Through Functions 3rd Edition b...Solutions Manual for College Algebra Concepts Through Functions 3rd Edition b...
Solutions Manual for College Algebra Concepts Through Functions 3rd Edition b...
 
C2 st lecture 2 handout
C2 st lecture 2 handoutC2 st lecture 2 handout
C2 st lecture 2 handout
 
6.7 quadratic inequalities
6.7 quadratic inequalities6.7 quadratic inequalities
6.7 quadratic inequalities
 
Introduction to Functions
Introduction to FunctionsIntroduction to Functions
Introduction to Functions
 
Recurrence
RecurrenceRecurrence
Recurrence
 
Anderson expresiones
Anderson expresionesAnderson expresiones
Anderson expresiones
 
Ca 1.6
Ca 1.6Ca 1.6
Ca 1.6
 

Recently uploaded

ML for identifying fraud using open blockchain data.pptx
ML for identifying fraud using open blockchain data.pptxML for identifying fraud using open blockchain data.pptx
ML for identifying fraud using open blockchain data.pptx
Vijay Dialani, PhD
 
Investor-Presentation-Q1FY2024 investor presentation document.pptx
Investor-Presentation-Q1FY2024 investor presentation document.pptxInvestor-Presentation-Q1FY2024 investor presentation document.pptx
Investor-Presentation-Q1FY2024 investor presentation document.pptx
AmarGB2
 
WATER CRISIS and its solutions-pptx 1234
WATER CRISIS and its solutions-pptx 1234WATER CRISIS and its solutions-pptx 1234
WATER CRISIS and its solutions-pptx 1234
AafreenAbuthahir2
 
Standard Reomte Control Interface - Neometrix
Standard Reomte Control Interface - NeometrixStandard Reomte Control Interface - Neometrix
Standard Reomte Control Interface - Neometrix
Neometrix_Engineering_Pvt_Ltd
 
NO1 Uk best vashikaran specialist in delhi vashikaran baba near me online vas...
NO1 Uk best vashikaran specialist in delhi vashikaran baba near me online vas...NO1 Uk best vashikaran specialist in delhi vashikaran baba near me online vas...
NO1 Uk best vashikaran specialist in delhi vashikaran baba near me online vas...
Amil Baba Dawood bangali
 
DESIGN A COTTON SEED SEPARATION MACHINE.docx
DESIGN A COTTON SEED SEPARATION MACHINE.docxDESIGN A COTTON SEED SEPARATION MACHINE.docx
DESIGN A COTTON SEED SEPARATION MACHINE.docx
FluxPrime1
 
block diagram and signal flow graph representation
block diagram and signal flow graph representationblock diagram and signal flow graph representation
block diagram and signal flow graph representation
Divya Somashekar
 
AP LAB PPT.pdf ap lab ppt no title specific
AP LAB PPT.pdf ap lab ppt no title specificAP LAB PPT.pdf ap lab ppt no title specific
AP LAB PPT.pdf ap lab ppt no title specific
BrazilAccount1
 
Architectural Portfolio Sean Lockwood
Architectural Portfolio Sean LockwoodArchitectural Portfolio Sean Lockwood
Architectural Portfolio Sean Lockwood
seandesed
 
ethical hacking-mobile hacking methods.ppt
ethical hacking-mobile hacking methods.pptethical hacking-mobile hacking methods.ppt
ethical hacking-mobile hacking methods.ppt
Jayaprasanna4
 
MCQ Soil mechanics questions (Soil shear strength).pdf
MCQ Soil mechanics questions (Soil shear strength).pdfMCQ Soil mechanics questions (Soil shear strength).pdf
MCQ Soil mechanics questions (Soil shear strength).pdf
Osamah Alsalih
 
Student information management system project report ii.pdf
Student information management system project report ii.pdfStudent information management system project report ii.pdf
Student information management system project report ii.pdf
Kamal Acharya
 
RAT: Retrieval Augmented Thoughts Elicit Context-Aware Reasoning in Long-Hori...
RAT: Retrieval Augmented Thoughts Elicit Context-Aware Reasoning in Long-Hori...RAT: Retrieval Augmented Thoughts Elicit Context-Aware Reasoning in Long-Hori...
RAT: Retrieval Augmented Thoughts Elicit Context-Aware Reasoning in Long-Hori...
thanhdowork
 
Sachpazis:Terzaghi Bearing Capacity Estimation in simple terms with Calculati...
Sachpazis:Terzaghi Bearing Capacity Estimation in simple terms with Calculati...Sachpazis:Terzaghi Bearing Capacity Estimation in simple terms with Calculati...
Sachpazis:Terzaghi Bearing Capacity Estimation in simple terms with Calculati...
Dr.Costas Sachpazis
 
HYDROPOWER - Hydroelectric power generation
HYDROPOWER - Hydroelectric power generationHYDROPOWER - Hydroelectric power generation
HYDROPOWER - Hydroelectric power generation
Robbie Edward Sayers
 
Cosmetic shop management system project report.pdf
Cosmetic shop management system project report.pdfCosmetic shop management system project report.pdf
Cosmetic shop management system project report.pdf
Kamal Acharya
 
Hybrid optimization of pumped hydro system and solar- Engr. Abdul-Azeez.pdf
Hybrid optimization of pumped hydro system and solar- Engr. Abdul-Azeez.pdfHybrid optimization of pumped hydro system and solar- Engr. Abdul-Azeez.pdf
Hybrid optimization of pumped hydro system and solar- Engr. Abdul-Azeez.pdf
fxintegritypublishin
 
Hierarchical Digital Twin of a Naval Power System
Hierarchical Digital Twin of a Naval Power SystemHierarchical Digital Twin of a Naval Power System
Hierarchical Digital Twin of a Naval Power System
Kerry Sado
 
Railway Signalling Principles Edition 3.pdf
Railway Signalling Principles Edition 3.pdfRailway Signalling Principles Edition 3.pdf
Railway Signalling Principles Edition 3.pdf
TeeVichai
 
一比一原版(IIT毕业证)伊利诺伊理工大学毕业证成绩单专业办理
一比一原版(IIT毕业证)伊利诺伊理工大学毕业证成绩单专业办理一比一原版(IIT毕业证)伊利诺伊理工大学毕业证成绩单专业办理
一比一原版(IIT毕业证)伊利诺伊理工大学毕业证成绩单专业办理
zwunae
 

Recently uploaded (20)

ML for identifying fraud using open blockchain data.pptx
ML for identifying fraud using open blockchain data.pptxML for identifying fraud using open blockchain data.pptx
ML for identifying fraud using open blockchain data.pptx
 
Investor-Presentation-Q1FY2024 investor presentation document.pptx
Investor-Presentation-Q1FY2024 investor presentation document.pptxInvestor-Presentation-Q1FY2024 investor presentation document.pptx
Investor-Presentation-Q1FY2024 investor presentation document.pptx
 
WATER CRISIS and its solutions-pptx 1234
WATER CRISIS and its solutions-pptx 1234WATER CRISIS and its solutions-pptx 1234
WATER CRISIS and its solutions-pptx 1234
 
Standard Reomte Control Interface - Neometrix
Standard Reomte Control Interface - NeometrixStandard Reomte Control Interface - Neometrix
Standard Reomte Control Interface - Neometrix
 
NO1 Uk best vashikaran specialist in delhi vashikaran baba near me online vas...
NO1 Uk best vashikaran specialist in delhi vashikaran baba near me online vas...NO1 Uk best vashikaran specialist in delhi vashikaran baba near me online vas...
NO1 Uk best vashikaran specialist in delhi vashikaran baba near me online vas...
 
DESIGN A COTTON SEED SEPARATION MACHINE.docx
DESIGN A COTTON SEED SEPARATION MACHINE.docxDESIGN A COTTON SEED SEPARATION MACHINE.docx
DESIGN A COTTON SEED SEPARATION MACHINE.docx
 
block diagram and signal flow graph representation
block diagram and signal flow graph representationblock diagram and signal flow graph representation
block diagram and signal flow graph representation
 
AP LAB PPT.pdf ap lab ppt no title specific
AP LAB PPT.pdf ap lab ppt no title specificAP LAB PPT.pdf ap lab ppt no title specific
AP LAB PPT.pdf ap lab ppt no title specific
 
Architectural Portfolio Sean Lockwood
Architectural Portfolio Sean LockwoodArchitectural Portfolio Sean Lockwood
Architectural Portfolio Sean Lockwood
 
ethical hacking-mobile hacking methods.ppt
ethical hacking-mobile hacking methods.pptethical hacking-mobile hacking methods.ppt
ethical hacking-mobile hacking methods.ppt
 
MCQ Soil mechanics questions (Soil shear strength).pdf
MCQ Soil mechanics questions (Soil shear strength).pdfMCQ Soil mechanics questions (Soil shear strength).pdf
MCQ Soil mechanics questions (Soil shear strength).pdf
 
Student information management system project report ii.pdf
Student information management system project report ii.pdfStudent information management system project report ii.pdf
Student information management system project report ii.pdf
 
RAT: Retrieval Augmented Thoughts Elicit Context-Aware Reasoning in Long-Hori...
RAT: Retrieval Augmented Thoughts Elicit Context-Aware Reasoning in Long-Hori...RAT: Retrieval Augmented Thoughts Elicit Context-Aware Reasoning in Long-Hori...
RAT: Retrieval Augmented Thoughts Elicit Context-Aware Reasoning in Long-Hori...
 
Sachpazis:Terzaghi Bearing Capacity Estimation in simple terms with Calculati...
Sachpazis:Terzaghi Bearing Capacity Estimation in simple terms with Calculati...Sachpazis:Terzaghi Bearing Capacity Estimation in simple terms with Calculati...
Sachpazis:Terzaghi Bearing Capacity Estimation in simple terms with Calculati...
 
HYDROPOWER - Hydroelectric power generation
HYDROPOWER - Hydroelectric power generationHYDROPOWER - Hydroelectric power generation
HYDROPOWER - Hydroelectric power generation
 
Cosmetic shop management system project report.pdf
Cosmetic shop management system project report.pdfCosmetic shop management system project report.pdf
Cosmetic shop management system project report.pdf
 
Hybrid optimization of pumped hydro system and solar- Engr. Abdul-Azeez.pdf
Hybrid optimization of pumped hydro system and solar- Engr. Abdul-Azeez.pdfHybrid optimization of pumped hydro system and solar- Engr. Abdul-Azeez.pdf
Hybrid optimization of pumped hydro system and solar- Engr. Abdul-Azeez.pdf
 
Hierarchical Digital Twin of a Naval Power System
Hierarchical Digital Twin of a Naval Power SystemHierarchical Digital Twin of a Naval Power System
Hierarchical Digital Twin of a Naval Power System
 
Railway Signalling Principles Edition 3.pdf
Railway Signalling Principles Edition 3.pdfRailway Signalling Principles Edition 3.pdf
Railway Signalling Principles Edition 3.pdf
 
一比一原版(IIT毕业证)伊利诺伊理工大学毕业证成绩单专业办理
一比一原版(IIT毕业证)伊利诺伊理工大学毕业证成绩单专业办理一比一原版(IIT毕业证)伊利诺伊理工大学毕业证成绩单专业办理
一比一原版(IIT毕业证)伊利诺伊理工大学毕业证成绩单专业办理
 

Mqm em

  • 1. Método dos Quadrados Mínimos Lista 4 no Canvas
  • 2. Método dos Quadrados Mínimos (ou Mínimos Quadrados) Vimos que a interpolação polinomial pode ser usada para aproximar uma função por outra. Usamos quando: 1) não temos a expressão da função (só um conjunto de pontos tabelados) ou 2) temos a expressão mas ela é bem complicada E queremos obter valores dentro do intervalo de tabelamento. A interpolação polinomial respeita a igualdade pn(xi) = f(xi) onde xi são os pontos escolhidos para a aproximação.
  • 3. Porém a interpolação não é aconselhável quando: a) queremos prever um valor fora do intervalo de tabelamento ou b) queremos por exemplo usar 10 pontos para aproximar por uma reta. Como fazer isso? Se a reta só precisa de 2 pontos? Nesses casos vamos usar M.Q.M. → método de ajuste de curvas 0 2 4 6 8 10 12 14 16 18 0 2 4 6 8 10 12 x f(x) 1 1,3 2 3,5 3 4,2 4 5 5 7 6 8,8 7 10,1 8 12,5 9 13 10 15,6
  • 4. Caso Discreto: Dados os pontos tabelados (x1,f(x1)), (x2,f(x2)) , ..., (xm,f(xm)) queremos determinar os coeficientes 1, 2,..., n tal que g(x) se aproxime ao máximo de f(x) nos pontos k = 1, .., m sendo g x = 𝛼1. 𝑔1 𝑥 + 𝛼2. 𝑔2 𝑥 + ⋯ + 𝛼𝑛. 𝑔𝑛 𝑥 • E quem são essas funções gi(x)? São as funções que iremos escolher para aproximar pelo M.Q.M. • Como escolher? Na maioria dos casos olhando o gráfico de dispersão e em alguns casos, se já soubermos o comportamento dos dados, usamos a função pré-escolhida para aproximar. • Olhando o exemplo anterior conseguimos ver que o comportamento do gráfico se parece com uma reta. Nesse caso teremos g(x) = 𝛼1. 𝑥 + 𝛼2. 1 ou seja, g1(x) = x e g2(x) = 1. • E como achar os ’s? • A ideia do M.Q.M. é que g(x) seja o mais próximo possível de f(x) nos pontos tabelados. Isso significa que a diferença entre g(x) e f(x) em cada ponto xk deve ser mínima, ou seja, 𝑑𝑘 = f 𝑥𝑘 − g 𝑥𝑘 deve ser mínima. • O M.Q.M. consiste em minimizar a soma dos quadrados dessas diferenças, isto é:
  • 5. ෍ 𝑘=1 𝑚 𝑓 𝑥𝑘 − 𝑔(𝑥𝑘) 2 Vamos chamar essa diferença de F(1, 2,..., n). Então: F(α1, α2, … , α𝑛) = ෍ 𝑘=1 𝑚 𝑓 𝑥𝑘 − 𝑔(𝑥𝑘) 2 F(α1, α2, … , α𝑛) = ෍ 𝑘=1 𝑚 𝑓 𝑥𝑘 − 𝛼1. 𝑔1 𝑥𝑘 − 𝛼2. 𝑔2 𝑥𝑘 − ⋯ − 𝛼𝑛. 𝑔𝑛 𝑥𝑘 2 Sabemos que para obter um ponto de mínimo de F(1, 2,..., n) temos que determinar seus pontos críticos, isto é, 𝜕𝐹 𝛼1,𝛼2,…,𝛼𝑛 𝜕𝛼𝑖 = 0 para i = 1,2,...,n [1]
  • 6. • Ao desenvolvermos [1] para cada derivada parcial de i (usando regra da cadeia) teremos: 𝜕𝐹 𝛼1,𝛼2,…,𝛼𝑛 𝜕𝛼𝑖 = 2. σ𝑘=1 𝑚 𝑓 𝑥𝑘 − 𝛼1. 𝑔1 𝑥𝑘 − ⋯ − 𝛼𝑛. 𝑔𝑛 𝑥𝑘 . (−𝑔𝑖(𝑥𝑘))
  • 7. • Ao desenvolvermos [1] para cada derivada parcial de i (usando regra da cadeia) teremos: 𝜕𝐹 𝛼1,𝛼2,…,𝛼𝑛 𝜕𝛼𝑖 = 2. σ𝑘=1 𝑚 𝑓 𝑥𝑘 − 𝛼1. 𝑔1 𝑥𝑘 − ⋯ − 𝛼𝑛. 𝑔𝑛 𝑥𝑘 . (−𝑔𝑖(𝑥𝑘)) Fazendo para todos os ’s e agrupando teremos um sistema linear em  com n equações e n incógnitas (os ’s ) A. = b onde A = [aij]nxn e b = [bi] são dados por: 𝑎𝑖𝑗 = ෍ 𝑘=1 𝑚 𝑔𝑖 𝑥𝑘 . 𝑔𝑗 𝑥𝑘 = 𝑎𝑗𝑖 (matriz A é simétrica) 𝑏𝑖 = ෍ 𝑘=1 𝑚 𝑔𝑖 𝑥𝑘 . 𝑓(𝑥𝑘)
  • 8. • E os ’s serão obtidos resolvendo um sistema linear por algum método que já conhecem. • Vamos ver um Exemplo. • Exemplo: Considere a tabela: Aproximar f(x) usando M.Q.M. a) uma reta b) um polinômio de grau 2 completo (ou parábola completa) 130 135 140 145 150 155 160 0 0,05 0,1 0,15 0,2 0,25 0,3 0,35 f(x) x f(x) 0 132 0,2 148 0,3 157
  • 9. a) para o caso da reta temos que g(x) = 1.x + 2.1 então g1(x) = x e g2(x) = 1 Vamos montar um sistema 2x2 (sempre é um sistema quadrado) 𝑎11 𝑎12 𝑎21 𝑎22 . 1 2 = 𝑏1 𝑏2 Vamos calcular 𝑎11 = 𝑎12 = 𝑎22 =
  • 11. a) para o caso da reta temos que g(x) = 1.x + 2.1 então g1(x) = x e g2(x) = 1 Vamos montar um sistema 2x2 (sempre é um sistema quadrado) 𝑎11 𝑎12 𝑎21 𝑎22 . 1 2 = 𝑏1 𝑏2 Vamos calcular 𝑎11 = ෍ 𝑘=1 3 𝑔1 𝑥𝑘 . 𝑔1 𝑥𝑘 = ෍ 𝑘=1 3 𝑥𝑘. 𝑥𝑘 = 0.0 + 0,2.0,2 + 0,3.0,3 = 0,13 𝑎12 = ෍ 𝑘=1 3 𝑔1 𝑥𝑘 . 𝑔2 𝑥𝑘 = ෍ 𝑘=1 3 𝑥𝑘. 1 = 0.1 + 0,2.1 + 0,3.1 = 0,5 = 𝑎21 𝑎22 = ෍ 𝑘=1 3 𝑔2 𝑥𝑘 . 𝑔2 𝑥𝑘 = ෍ 𝑘=1 3 1. 1 = 1.1 + 1.1 + 1.1 = 3
  • 12. b1 = ෍ 𝑘=1 3 𝑓 𝑥𝑘 . 𝑔1 𝑥𝑘 = ෍ 𝑘=1 3 𝑓 𝑥𝑘 . 𝑥𝑘 = 132.0 + 148.0,2 + 157.0,3 = 76,7 b2 = σ𝑘=1 3 𝑓 𝑥𝑘 . 𝑔2 𝑥𝑘 = σ𝑘=1 3 𝑓 𝑥𝑘 . 1 = 132.1 + 148.1 + 157.1 = 437 0,13 0,5 0,5 3 . 1 2 = 76,7 437 Resolvendo o sistema linear: 0,13. 1+0,5. 2 = 76,7 0,5. 1+ 3. 2 = 437 Por adição (L1 *-6 + L2) -0,28. 1 = -23,2  1=82,86 e 2=131,86. Então a reta que melhor aproxima aqueles pontos é g(x) = 82,86.x + 131,86
  • 13. b) para o caso da parábola completa temos que g(x) = 1.x2 + 2.x + 3.1 então g1(x) = x2 , g2(x) = x e g3(x) = 1 Vamos montar um sistema 3x3 𝑎11 𝑎12 𝑎13 𝑎21 𝑎22 𝑎23 𝑎31 𝑎32 𝑎33 . 1 2 3 = 𝑏1 𝑏2 𝑏3 E calcular cada valor 0,0097 0,035 0,13 0,035 0,13 0,5 0,13 0,5 3 . 1 2 3 = 20,05 76,7 437 Atenção: o número de casas decimais influencia muito na resposta. Usando 4 casas decimais o resultado é: g(x) = 27,4217.x2 + 75,1006.x + 131,9653 Vamos ver usando Excel
  • 14. Excel – monta tabela/marca os dados/ inserir gráfico de dispersão/clicar em um dos pontos do gráfico com lado direito do mouse/adicionar linha de tendência + escolher modelo de ajuste + mostrar equação no gráfico + mostrar R2. R2 – coeficiente de determinação. Mede a qualidade do ajuste obtido, ou seja, mede o ajustamento de um modelo em relação aos valores plotados. Varia de 0≤R2≤1. Quanto mais perto de 1 melhor o ajuste!! Vejam que no Excel o item b) do exemplo vai dar g(x) = 33,333.x2 + 73,333.x + 132 Temos vários tipos de ajuste no Excel. Obs: Exs da Lista 4 - com parábola incompleta só usaremos 2 alfas (Ex1, Ex2 b), Ex 4)