Downloaded 22 times

![3 Quadratic Functions 15
Questions based on SPM Format (II)
EXAMPLE EXERCISE
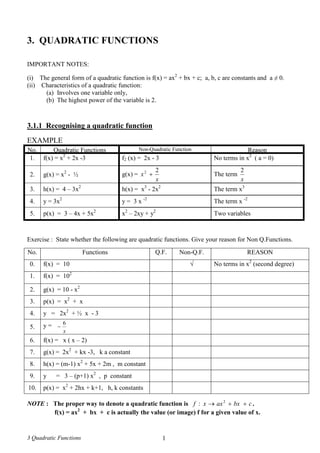
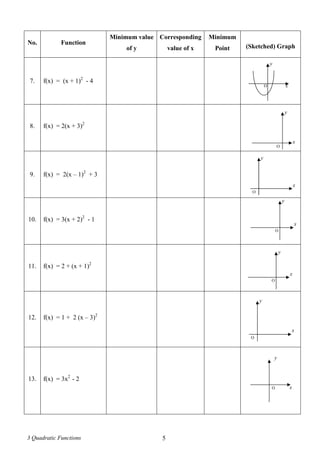
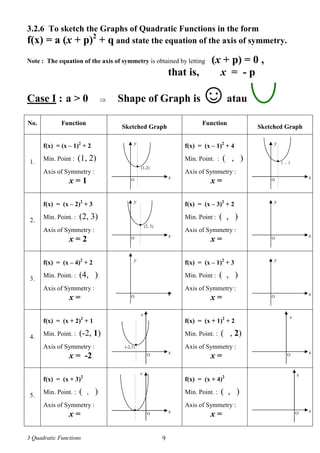
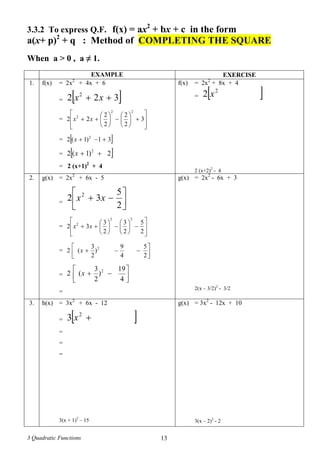
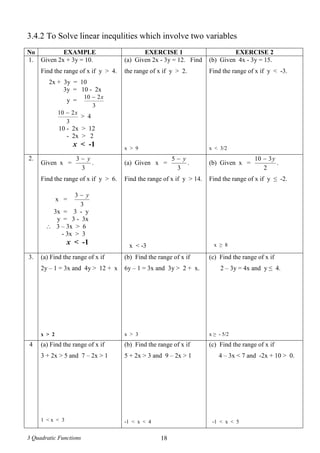
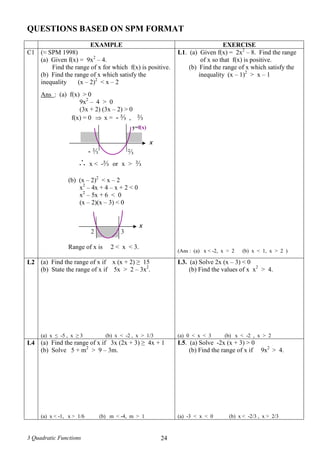
Express f(x) = - x2
+ 6x + 7 in the form
k - (x + p)2
, k and p are constants. Hence
(i) State the maximum value of f(x) and
state the coressponding value of x,
(ii) Sketch the graph of y = f(x) and state
the equation of the axis of symmetry.
Ans: a = -1 ( < 0) f has maximum value
C2
f(x) = - x2
+ 6x + 7
= 762
xx
=
7
2
6
3
6
6(
22
2
xx
= 79)3( 2
x
= - [ (x - 3)2
- 16 ]
= 16 - (x -3)2
(i) Maximum f(x) = 16, when x =
3.
(ii)
Axis of symmetry is : x = 3.
L4. Express f(x) = - x2
- 8x + 9 in the form
- (x + p)2
+ q. Hence
(i) State the maximum value of f(x)
and state the coressponding value
of x,
(ii) Sketch the graph of y = f(x) and
state the equation of the axis of
symmetry.
Ans:
p = 4 , q = 25
L5 Express f(x) = - x2
+ 4x + 1 in the form - (x +
p)2
. Hence
(i) State the maximum value of f(x) and
state the coressponding value of x,
(ii) Sketch the graph of y = f(x) and state
the equation of the axis of symmetry.
Jawapan :
(sila gunakan kertas sendiri) 5 – (x – 2)2
L6. Express f(x) = 4 – 3x - x2
in the form
q - (x + p)2
Hence
(i) State the maximum value of f(x)
and state the coressponding value
of x,
(ii) Sketch the graph of y = f(x) and
state the equation of the axis of
symmetry.
Jawapan :
25/4 - (x + 3/2)2
xO
y
(3, 16)
●
7
3
x = 3](https://image.slidesharecdn.com/modul3quadraticfunction-160426033700/85/Modul-3-quadratic-function-15-320.jpg)
![3 Quadratic Functions 20
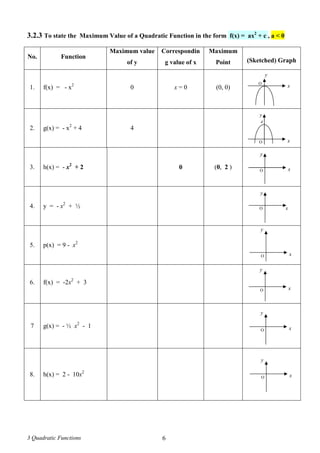
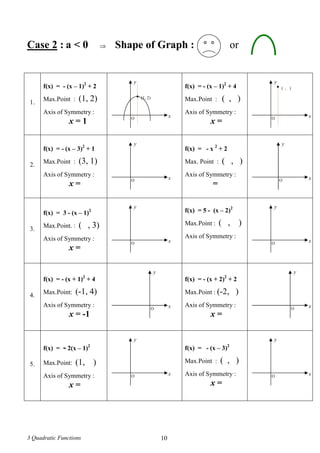
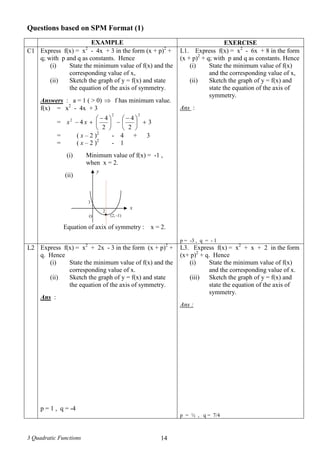
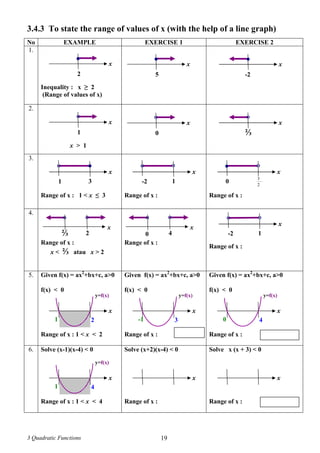
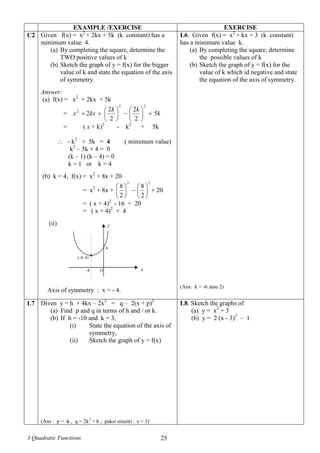
3.4.5 Solving Quadratic Inequalities [ by sketching the graph of y = f(x) ]
Guide
STEP 1 : Make sure the inequality has been rearranged into the form f(x) < 0 or f(x) > 0
( Right-Hand Side MUST be 0 ! )
STEP 2 : Factorise f(x). [Here we consider only f(x) which can be factorised]
It is easier to factorise if a is made positive.
Hence
STEP 3 : Sketch the graph of y = f(x) and shade the region which satisfy the inequality.
STEP 4 : State the range of values of x based on the graph.
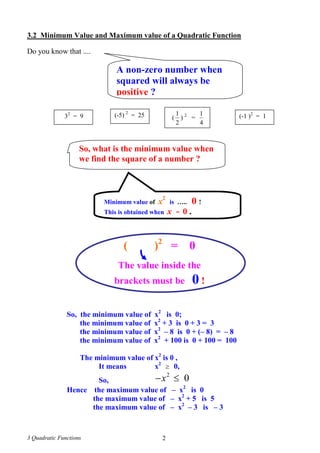
EXAMPLE EXERCISE
C1 Solve x2
– 4x < -3
x2
– 4x + 3 < 0 [ In the form f(x) < 0 ]
(x - 1) (x – 3) < 0 [ faktorise ]
Consider f(x) = (x - 1) (x – 3)
f(x) = 0 x = 1 atau x = 3
From the graph above, the range of x which
satisfies the inequality f(x) < 0 ialah
1 < x < 3 .
L1. Solve x2
– 5x + 6 < 0
2 < x < 3
Example 1
x2
– 4x > 5 changed to
x2
– 4x – 5 > 0
Example 2
x(2x – 1) < 6
2x2
– x < 6
2x2
–x – 6 < 0
Example
– x2
+ 3x + 4 > 0 can be transformed into
x2
– 3x – 4 < 0
(x+1) (x – 4) < 0
x
1 3
y=f(x)](https://image.slidesharecdn.com/modul3quadraticfunction-160426033700/85/Modul-3-quadratic-function-20-320.jpg)
![3 Quadratic Functions 21
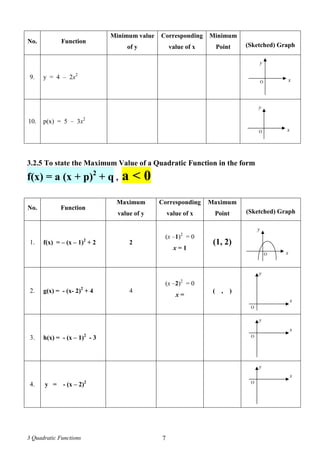
EXAMPLE EXERCISE
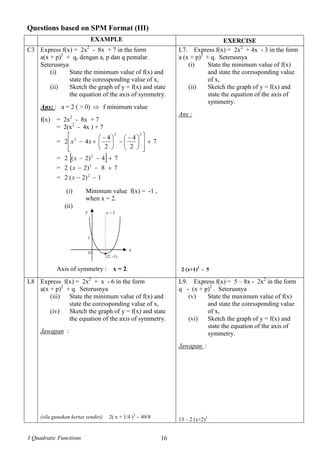
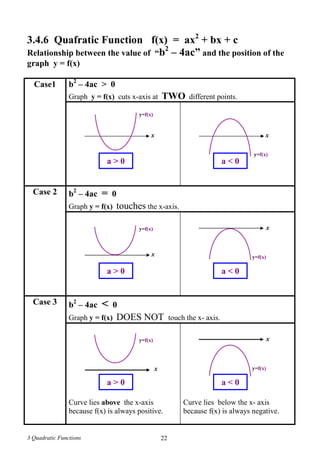
L2 Solve x (x+ 4) < 12
x (x+ 4) < 12
x2
+ 4x - 12 < 0 [ in the form f(x) = 0 ]
( ) ( ) < 0 [ faktorise ]
Consider f(x) =
f(x) = 0 x = or x =
From the graph above, the range of x which
satisfies the inequality f(x) < 0 ialah
L3. Finf the range of values of x which satisfies
x2
+ 2x < 0.
-2 < x < 0
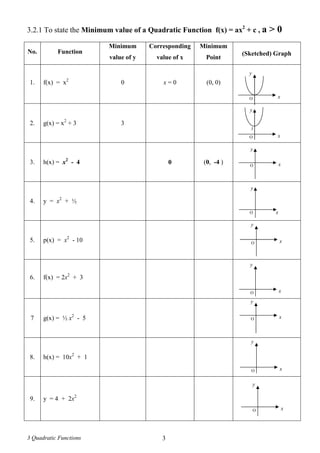
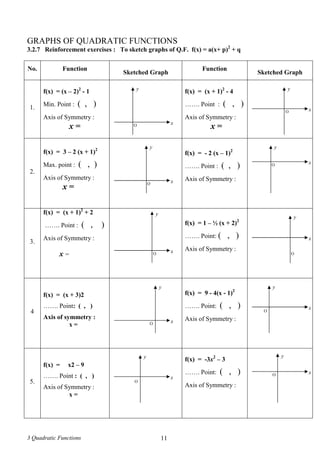
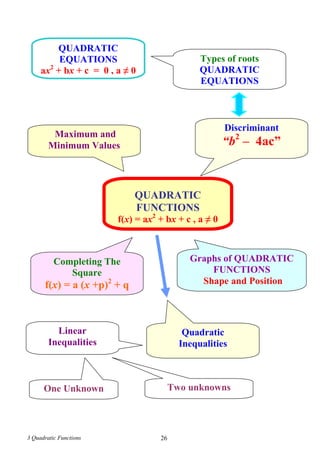
C2 Solve the inequality x2
+ x - 6 ≥ 0
x2
+ x - 6 ≥ 0
(x + 3) ( x – 2) ≥ 0
Consider f(x) = 0. Then x = -3 , x = 2
Range of x is : x ≤ -3 atau x ≥ 2
L4. Solve the inequality x2
+ 3x - 10 ≥ 0.
x ≤ -5 , x ≥ 2
L5 Solve the inequality 2x2
+ x > 6.
x < -2 , x > 3/2
L6. Solve the inequality x(4 – x) ≥ 0.
0 ≤ x ≤ 4
x
x
-3 2
y=f(x)](https://image.slidesharecdn.com/modul3quadraticfunction-160426033700/85/Modul-3-quadratic-function-21-320.jpg)

This document provides information about quadratic functions including: 1) The general form of a quadratic function is f(x) = ax2 + bx + c, where a, b, c are constants and a ≠ 0. 2) Characteristics of quadratic functions include involving one variable only and the highest power of the variable being 2. 3) Examples are provided to demonstrate recognizing quadratic and non-quadratic functions based on their form.


