Downloaded 13 times


![Soil contamination in China
• In 2014 the Ministry of Environmental Protection (MEP): current
status of soil contamination in China
• Surface (0−20 cm) soil samples from 8 × 8 km grids and analysed for:
As, Cd, Co, Cr, Cu, F, Hg, Mn, Ni, Pb, Se, V and Zn
[3 types of organic contaminants (hexachlorocyclohexane,
dichlorodiphenyltri-chloroethane, and polyaromatic hydrocarbons)]
• Of all the samples analysed, 16% exceed the environmental quality
standard set by the MEP and 19% of agricultural soils (equivalent to
approximately 26 million ha)
• Contamination by As, Cd, Cr, Cu, Hg, Ni, Pb and Zn accounted for the
majority (82.4%) of the soils classified as being contaminated
• Amongst those, Cd ranked first in the percentage soil samples (7.0%)
exceeding the MEP limit
Zhao, Ma, Zhu, Tang and McGrath, Environ Sci Technol. 2015, 750-759](https://image.slidesharecdn.com/2newmcgrath-180625083632/75/Soil-pollution-on-agricultural-fields-and-other-land-uses-16-2048.jpg)


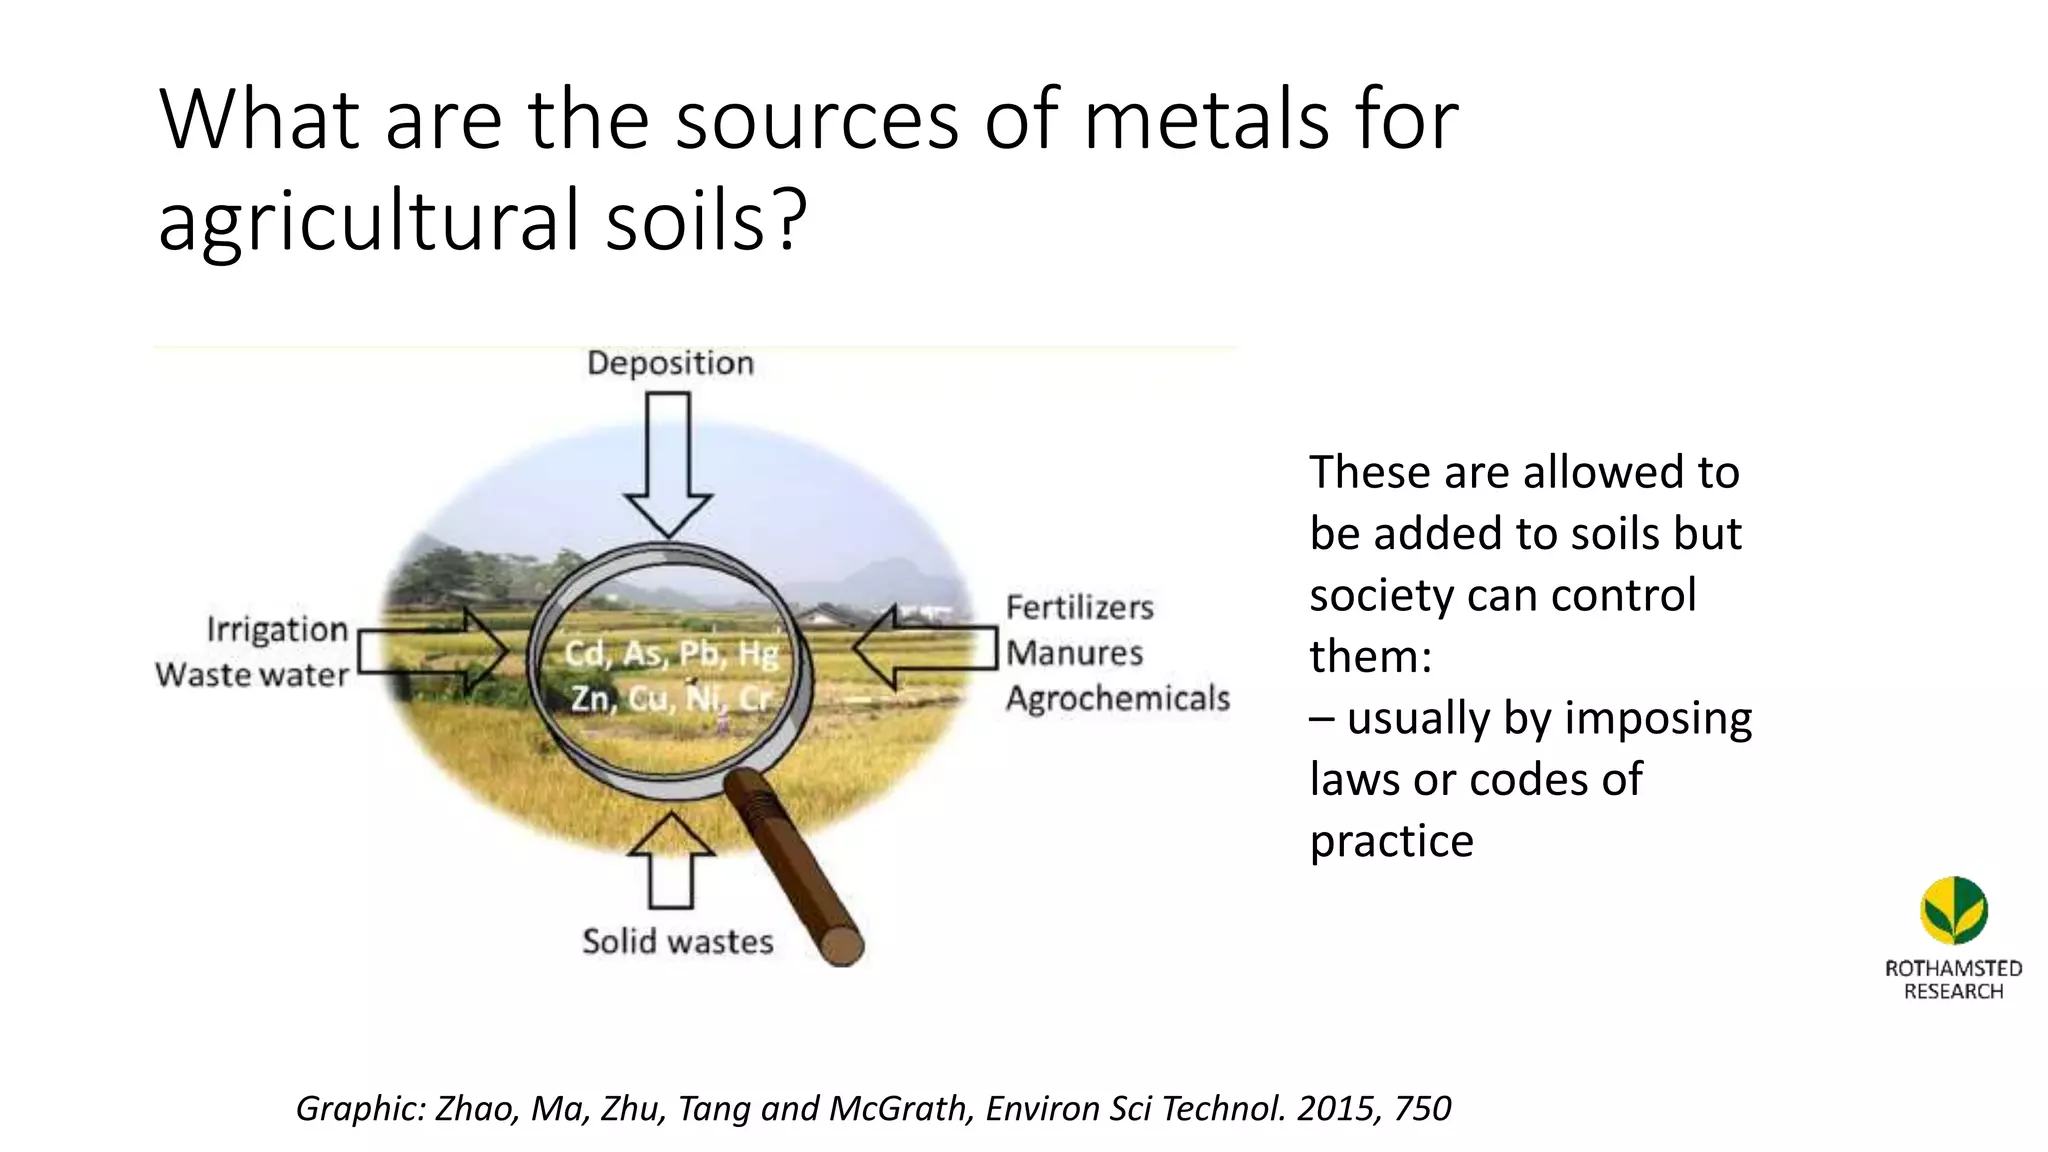
The document discusses the status, drivers, and challenges of soil pollution, particularly focusing on metal contamination in agricultural soils. It outlines sources of metal inputs, such as atmospheric deposition and agricultural practices, and highlights the significant effects of soil pollution on food quality, human health, and environmental quality. The conclusion emphasizes the need for unified terminology, localized investigations, effective monitoring, and pollution control measures to address the challenges posed by soil pollution.


