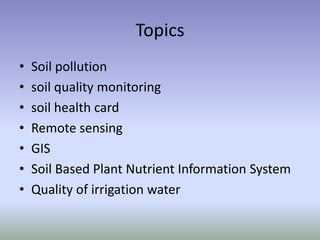
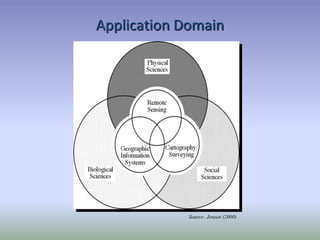
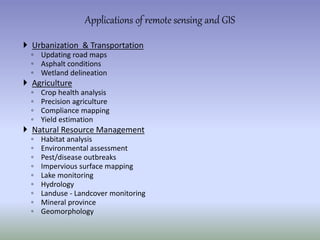
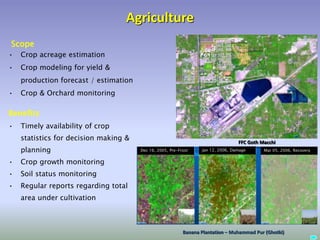
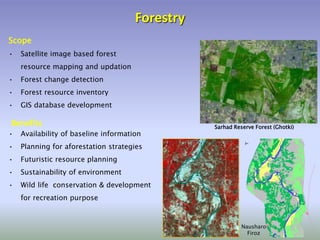
This document discusses various topics related to soil health including soil pollution, soil quality monitoring, soil health cards, remote sensing, GIS, soil-based plant nutrient information systems, and quality of irrigation water. It provides details on soil survey, soil pollution sources and effects, and applications of remote sensing and GIS in agriculture, forestry, land use mapping, and urban planning. Key points covered are soil formation, classification, variability, monitoring soil quality, and controlling soil pollution through sustainable practices. Remote sensing techniques and their use in various fields like agriculture, natural resource management, and infrastructure development are also summarized.
Application of Remote Sensing in AgricultureUTTAM KUMAR
Remote sensing has been found to be a valuable tool in evaluation, monitoring and management of land, water and crop resources. The launching of the Indian remote sensing satellite (IRS) has enhanced the capabilities for better utilization of this technology and significant progress has been made in soil and land cover mapping, land degradation studies, monitoring of waste land, assessment of crop conditions crop acreage and production estimates
In India, agriculture is one of the major application areas of the remote sensing technology. Various national level agricultural applications have been developed which showcases the use of remote sensing data provided by the sensors/satellites launched by the country’s space agency, Indian Space Research Organisation (ISRO)
QUALITY OF IRRIGATION WATER AND MANAGEMENT OF SALINE WATER FOR IRRIGATION
GOVARDHAN LODHA
Enroll. No. (160111017)
Department of Agronomy
M.Sc. (Ag) Agronomy 2nd semester
GIS and Remote Sensing in Diagnosis and Management of Problem Soil with audio...KaminiKumari13
GIS and Remote Sensing in Diagnosis and Management of Problem Soil for agriculture, soil science, agronomy, forestry, land management and planning with audio by Dr. Kamini Roy
Introduction
enlist of problematic soil
Salt affected soil
Characteristic of salt affected soil
Comparison between salt affected soil
Reclamation of Saline soils
Reclamation of sodic soils
Reclamation of saline-sodic soils
Acidic soils
Reclamation of acidic soil
Acid Sulphate soils and its management
Calcareous soil
GIS in agriculture helps farmers to achieve increased production and reduced costs by enabling better management of land resources. The risk of marginalization and vulnerability of small and marginal farmers, who constitute about 85% of farmers globally, also gets reduced.
Agricultural Geographic Information Systems using Geomatics Technology enable the farmers to map and project current and future fluctuations in precipitation, temperature, crop output etc.
Bhole ;Effect of pollution on soil water air quality and control measuresBhole Shankar Paikara
In this slide indicate that, unbalance of Ecosystem and suddenly change environment due to Soil , Air & Water pollution then we go to harmful dangerous condition for survival on earth of different biological agent .in condition we are how can reduce ecological pollution their monitoring and management it.
Diploma in Advance Construction Management.pptxfg2167771
Diploma in Advance Construction Management
We live interacting with components on the earth, the our living planet which the life is depend on the sun may be many unknown elements in the Universe.
For study purpose we concern the environment as the place where we live and the interconnections among the environment and living beings.
Water Cycle, Carbon Cycle, Oxygen Cycle…etc,
Food Chains, Food Webs
Individual, Families/ Groups/ Flocks…, Community, Eco-systems, Areas, Zones, Biomes
Item 6: International Center for Biosaline AgricultureExternalEvents
SOIL ATLAS OF ASIA
2ND EDITORIAL BOARD MEETING
RURAL DEVELOPMENT ADMINISTRATION, NATIONAL INSTITUTE OF AGRICULTURAL SCIENCES,
JEONJU, REPUBLIC OF KOREA | 29 APRIL – 3 MAY 2019
Soil Health definition and relationship to soil biology
Characteristics of healthy soil
Assessment of soil health
Framework for evaluating soil health
Indicators
Types of indicators
Biological indicators
Role of biological indicators
Synthetic Fiber Construction in lab .pptxPavel ( NSTU)
Synthetic fiber production is a fascinating and complex field that blends chemistry, engineering, and environmental science. By understanding these aspects, students can gain a comprehensive view of synthetic fiber production, its impact on society and the environment, and the potential for future innovations. Synthetic fibers play a crucial role in modern society, impacting various aspects of daily life, industry, and the environment. ynthetic fibers are integral to modern life, offering a range of benefits from cost-effectiveness and versatility to innovative applications and performance characteristics. While they pose environmental challenges, ongoing research and development aim to create more sustainable and eco-friendly alternatives. Understanding the importance of synthetic fibers helps in appreciating their role in the economy, industry, and daily life, while also emphasizing the need for sustainable practices and innovation.
Students, digital devices and success - Andreas Schleicher - 27 May 2024..pptxEduSkills OECD
Andreas Schleicher presents at the OECD webinar ‘Digital devices in schools: detrimental distraction or secret to success?’ on 27 May 2024. The presentation was based on findings from PISA 2022 results and the webinar helped launch the PISA in Focus ‘Managing screen time: How to protect and equip students against distraction’ https://www.oecd-ilibrary.org/education/managing-screen-time_7c225af4-en and the OECD Education Policy Perspective ‘Students, digital devices and success’ can be found here - https://oe.cd/il/5yV
The Art Pastor's Guide to Sabbath | Steve ThomasonSteve Thomason
What is the purpose of the Sabbath Law in the Torah. It is interesting to compare how the context of the law shifts from Exodus to Deuteronomy. Who gets to rest, and why?
How to Split Bills in the Odoo 17 POS ModuleCeline George
Bills have a main role in point of sale procedure. It will help to track sales, handling payments and giving receipts to customers. Bill splitting also has an important role in POS. For example, If some friends come together for dinner and if they want to divide the bill then it is possible by POS bill splitting. This slide will show how to split bills in odoo 17 POS.
The Indian economy is classified into different sectors to simplify the analysis and understanding of economic activities. For Class 10, it's essential to grasp the sectors of the Indian economy, understand their characteristics, and recognize their importance. This guide will provide detailed notes on the Sectors of the Indian Economy Class 10, using specific long-tail keywords to enhance comprehension.
For more information, visit-www.vavaclasses.com
Operation “Blue Star” is the only event in the history of Independent India where the state went into war with its own people. Even after about 40 years it is not clear if it was culmination of states anger over people of the region, a political game of power or start of dictatorial chapter in the democratic setup.
The people of Punjab felt alienated from main stream due to denial of their just demands during a long democratic struggle since independence. As it happen all over the word, it led to militant struggle with great loss of lives of military, police and civilian personnel. Killing of Indira Gandhi and massacre of innocent Sikhs in Delhi and other India cities was also associated with this movement.
Instructions for Submissions thorugh G- Classroom.pptxJheel Barad
This presentation provides a briefing on how to upload submissions and documents in Google Classroom. It was prepared as part of an orientation for new Sainik School in-service teacher trainees. As a training officer, my goal is to ensure that you are comfortable and proficient with this essential tool for managing assignments and fostering student engagement.
Model Attribute Check Company Auto PropertyCeline George
In Odoo, the multi-company feature allows you to manage multiple companies within a single Odoo database instance. Each company can have its own configurations while still sharing common resources such as products, customers, and suppliers.
Read| The latest issue of The Challenger is here! We are thrilled to announce that our school paper has qualified for the NATIONAL SCHOOLS PRESS CONFERENCE (NSPC) 2024. Thank you for your unwavering support and trust. Dive into the stories that made us stand out!
Unit 8 - Information and Communication Technology (Paper I).pdfThiyagu K
This slides describes the basic concepts of ICT, basics of Email, Emerging Technology and Digital Initiatives in Education. This presentations aligns with the UGC Paper I syllabus.
Unit 8 - Information and Communication Technology (Paper I).pdf
REMOTE SENSING AND GIS
1. HEALTHY SOILS FOR A HEALTHY LIFE
Sudhis Kumar. K
Assistant Director –SS-NC
Dept. of Soil Survey & Soil Conservation
2.
3. Topics
• Soil pollution
• soil quality monitoring
• soil health card
• Remote sensing
• GIS
• Soil Based Plant Nutrient Information System
• Quality of irrigation water
4. Soil
The unconsolidated mineral or organic
material on the immediate surface of
the Earth that serves as a natural
medium for the growth of plants.
8. Soil Survey
• Soil survey is the study and mapping of soils in
their natural environment
• It is the systematic examination, description,
classification and mapping of soils in an area
9. SOIL SURVEY
A soil survey describes the characteristics of the soils,
classifies them, plots the boundaries of the soils on an
appropriate base map, and makes predictions about the
behavior of soils.
Thus soil survey provide basic information on soils for
planning developmental programmes.
13. Soil, and pollution
POLLUTION-
An undesirable change in the physical chemical or biological
characteristics of air, water or soil.
SOIL POLLUTION-
The undesirable change in physical, chemical and biological
characteristics of soil, which are harmful for all living beings.
14. KINDS OF SOIL POLLUTION-
1) Agricultural pesticides
2) Disposal of solid wastes on land
3) Mining activities
4) Biological agents
5) Radioactive pollutants
6) Heavy metal pollutants
15. Agricultural practices-
The use of indiscriminate use of inorganic nutrients
for a long time gradually declines the soil fertility.
The intensive inappropriate tillage practices lowers
the capability of soil.
16. Disposal of solids wastes on land
The solid wastes are mostly generated from industrial,
domestic and urban and agricultural sources.
The solid wastes generated in Indian cities mainly contains
sludge, glass materials, metallic cans, fibers, waste paper,
packing materials, leather.
17. Mining activities-
The top layer of soil is generally damaged or
destroyed during both shaft and strip mining
practices.
The uncontrolled mine fires may also destroy the
productivity of the areas near mines.
18. Biological agents-
The major sources of biological agents causing soil
pollution are human excreta, animal and bird excreta,
municipal wastes, faulty sanitation.
The industrial parasites are among the most
threatening biological agents.
19. Radioactive pollutants-
Huge amounts of radio-active substances result
from nuclear device explosion, nuclear testing
laboratories, nuclear power plants and weapons.
All these are responsible for enhancing soil
pollution.
20. Heavy metal pollutants
• Heavy metals in soil are basically due to industrial discharges.
• Certain heavy metals eg. Zn, Cu, Ni, Cd and Pb are also
present in significant levels in sewage sludge and reach the soil
where they become part of life cycle and affects adversely.
23. Effects of soil pollution
1. Soil fertility is adversely affected if pesticide remain in
soil for longer period.
2. Excessive use of fertilizers and pesticide chemicals does
not allow microbial flora and fauna in soil to flourish.
3. Excessive use of nitrogen and phosphatic fertilizer makes
the soil deficient in other micronutrients like Zn, Cu etc.
and causes nutrition imbalance.
4. Pesticides like DDT, dieldrin etc. are known to seep
gradually through soil into ground water and thus
contaminate public drinking water supplies.
24. 5. People in contact with pesticides are extremely prone
to get poisoned.
6. Some of the industrial wastes are extremely toxic for
organisms.
7. Solid urban wastes and industrial wastes produce foul
and offensive odour.
8. Heavy metals and other toxic substances can destroy
beneficial microorganisms of the soil.
9. Radioactive pollutants can cause a number of
undesirable disease of digestive system if they enter
our body through food chain.
25. Control of soil pollution-
1. Adoption of sustainable agriculture having organic farming
and use of biofertilizers, bio-integrated pest management
and proper water management, composting etc.
2. Adoption of suitable and proper industrial and urban
wastes management.
3. Adequate controlled use of heavy metal and toxic
substances.
4. Non-biodegradable wastes can be recycled and used again
5. Biomedical wastes should be carefully disposed off so that
it does not create any health hazard.
36. Water Uses
Use Typical quality parameters
Public Water Supply Turbidity, TDS, inorganic and
organic compounds, microbes
Water contact recreation Turbidity, bacteria, toxic
compounds
Fish propagation and wildlife DO, chlorinated organic
compounds
Industrial water supply Suspended and dissolved
constituents
Agricultural water supply Sodium, TDS
Shellfish harvesting DO, bacteria
37. Basic Water Quality Parameters
• pH
• Specific conductance (EC)
• Salinity
• Total dissolved solids (TDS)
• Turbidity
• Dissolved oxygen (DO)
• Biochemical oxygen demand (BOD)
• Temperature
38. pH
• Measures hydrogen ion
concentration
• Negative log of hydrogen ion
concentration
• Ranges from 0 to 14 std. units
• pH
– 7 neutral
– 0 - 7 acidic
– 7 - 14 alkaline
Thanks to Phil Brown
39. Solubility of Specific Ions
Based on Water pH
Toxic metals less available in water at pH 6 to 8.
40. Conductivity
• Measures electric
conductivity (EC) of water
• Higher value means water
is a better electrical
conductor
• Increases when more salt
(e.g., sodium chloride) is
dissolved in water
• Indirect measure of salinity
• Units are μmhos/cm at 25o
C or μsiemens/cm
Thanks to Phil Brown
41. Salinity
• Classification of Ground Water
• Composition Based on Total Dissolved
Solids Content
Salts in Sea Water
Type of Water Dissolved salt content (mg/l)
Fresh water < 1,000 mg/l
Brackish water 1,000 - 3,000 mg/l
Moderatly saline
water
3,000 - 10,000 mg/l
Highly saline water 10,000 - 35,000 mg/l
Sea water > 35,000 mg/l
42. Salinity and irrigation
• Low salinity water
– used for most crops
• Medium salinity water
– used with moderate amount of leaching (potatoes,
corn, wheat, oats, and alfalfa)
• High salinity water
– Cannot be used on soils having restricted drainage.
• Very high salinity water
– Can be used only on certain crops only if special
practices are followed
43. Designated-Best-Use Class of water Criteria
Drinking Water Source without
conventional treatment but after
disinfection
A
Total Coliforms Organism MPN/100ml shall be 50 or less
pH between 6.5 and 8.5
Dissolved Oxygen 6mg/l or more
Biochemical Oxygen Demand 5 days 20°C 2mg/l or less
Outdoor bathing (Organised) B
Total Coliforms Organism MPN/100ml shall be 500 or less pH
between 6.5 and 8.5 Dissolved Oxygen 5mg/l or more
Biochemical Oxygen Demand 5 days 20°C 3mg/l or less
Drinking water source after
conventional treatment and disinfection C
Total Coliforms Organism MPN/100ml shall be 5000 or less
pH between 6 to 9 Dissolved Oxygen 4mg/l or more
Biochemical Oxygen Demand 5 days 20°C 3mg/l or less
Propagation of Wild life and Fisheries D
pH between 6.5 to 8.5 Dissolved Oxygen 4mg/l or more
Free Ammonia (as N) 1.2 mg/l or less
Irrigation, Industrial Cooling, Controlled
Waste disposal E
pH betwwn 6.0 to 8.5
Electrical Conductivity at 25°C micro mhos/cm Max.2250
Sodium absorption Ratio Max. 26
Boron Max. 2mg/l
Below-E Not Meeting A, B, C, D & E Criteria
Standards fixed by Central Pollution Control Board
45. • Remote Sensing:
– The art and science of obtaining information
about an object without physically contact
between the object and sensor
– The processes of collecting information about
Earth surfaces and phenomena using sensors
not in physical contact with the surfaces and
phenomena of interest.
– There is a medium of transmission involved i.e.
Earth’s Atmosphere.
Remote Sensing
46.
47. Energy Source or Illumination (A)
Radiation and the Atmosphere (B)
Interaction with the Target (C)
Recording of Energy by the Sensor (D)
Transmission, Reception, and
Processing (E)
Interpretation and Analysis (F)
Application (G)
Source: Canadian Centre for Remote Sensing
Remote Sensing Process Components
48. Types of REMOTE SENSING
Active Remote Sensing
Passive Remote Sensing
49.
50.
51.
52. • Agriculture
• Forestry
• Geology
• Hydrology
• Sea Ice
• Land Cover & Land Use
• Mapping
• Oceans & Coastal Monitoring
Areas OF APPLICATION:
55. Agriculture
• Crop acreage estimation
• Crop modeling for yield &
production forecast / estimation
• Crop & Orchard monitoring
Scope
• Timely availability of crop
statistics for decision making &
planning
• Crop growth monitoring
• Soil status monitoring
• Regular reports regarding total
area under cultivation
Benefits
Banana Plantation – Muhammad Pur (Ghotki)
FFC Goth Macchi
Mar 05, 2006, RecoveryJan 12, 2006, DamageDec 16, 2005, Pre-Frost
56. Forestry
• Satellite image based forest
resource mapping and updation
• Forest change detection
• Forest resource inventory
• GIS database development
Scope
• Availability of baseline information
• Planning for aforestation strategies
• Futuristic resource planning
• Sustainability of environment
• Wild life conservation & development
for recreation purpose
Benefits Sarhad Reserve Forest (Ghotki)
Nausharo
Firoz
57. Landuse / Landcover Mapping
• Monitoring dynamic changes
• Urban/Rural infrastructure
• Waterlogging & salinity
Scope
• Assessment of spatial distribution of
land resources
• Infrastructure monitoring
• Availability of usable land
• Future planning for better land
management for socio-economic
development
Benefits
58. • Use of Remote Sensing and GIS technology in these areas of
sustainable agricultural management.
•
Cropping System Analysis
Cropping system map generated through integrated use of temporal digital satellite data and GIS
59. Urban & Regional Planning
• Mapping & updation of
city/town maps
• Urban sprawl monitoring
• Town planning
• Facility management
• GIS database development
Scope
• Better decision support, planning
& management
• Rapid information updation
• Infrastructure development
monitoring
• Spatial information analysis
Benefits
61. Enter GIS
• A computer-based
tool for holding,
displaying, and
manipulating huge
amounts of spatial
data.
62. Map Concepts
• What is a map?
– What are some properties of maps?
– Vector vs. raster: two digital mapping methods
• Maps reflect the databases we create
• Mapping the third dimension: examples of
3-D maps
63. Representing the World: Projections
• 3-D to 2-D (at first)
– Projections change a round
world into a flat one.
64. What is in a picture?
• Example: The Mercator projection has
straight meridians & parallels that
intersect at right angles, as opposed to
the Robinson projection.
– Any one projection cannot simultaneously
preserve all these qualities of the world:
shape, area, direction, and distance.
65. This is what happens when
projections mix!
• Notice the
boundary lines
do not line up
• Points that are
placed on the
wrong
projection will
be misaligned
as well
66. Raster vs. Vector: types of GIS map
representation
• Vector vs. Raster
• Two basic ways that spatial data can be
represented
• Raster:
– Data represented by pixels with values,
creating a grid
– Allows certain types of operations not
possible with vector data
– Map algebra is possible with multiple
data layers – creating index maps
• Vector:
– Data stored as points, lines, and
polygons
– Uses less memory than raster format
– Does not loose positional accuracy
67. How is all this done?
• GIS stores data in a relational
database structure (‘3-D
spreadsheets’)
– e.g. employee names linked to
store number, store number
linked to shipment arrival
– any data can be linked by a
common attribute to any other
data
• Example shown here is a list of
counties (geographic data) by
income code (demographic
data)
68. High End 3-D Representation
• Surfaces are made from
Triangular Irregular
Networks (TIN) that
interpolate 3-D surfaces
from 2-D contour values.
• Uses:
– Hydrology: surface and
underground flows
– Line-of-Sight analysis
– Pollution Plume tracking
– Customer analysis
– Soil erosion potential
69. 3-D Rendering Example
Beaty, NV
USGS 7.5 Minute
quad in 3-D
A 3-D
rendering of
the terrain
Elevation measurements
can be easily converted
into 3-D.
70. • How many data points are contained in this image? Thousands? More?
– Even without statistical measurement (which can be done) the pattern of pollution
can be seen. Location and density of wells is also clear.
– Line of sight analysis allows us to determine where to put a house or power plant
where it could or could not be seen from major roads. Notice the roads actually
track up the hills on the right side of the image.
72. Proximity Analysis
• Two or more data layers are overlaid
• GIS creates buffers around features on a particular layer
• This allows analyses such as flood zone delineation.
73. Query and Overlay Analyses
• Query building is a data exploration operation
– Example statement: ‘([acres] > 500 AND [age] > 55)’
– This would highlight all land parcels of greater than 500 acres owned by people
older than 55 years old in a data set loaded into the GIS.
74. Spatial Analysis
• Raster data can also be
used to create surfaces
• Other raster data uses:
– Density analysis
– Proximity analysis
– Least-cost paths
– Line-of-sight
– Hydrology analysis
76. – Map contains data for each street
– Each address in the city can be
geocoded – that is its location
estimated in a systematic way
– Length of each street segment -
block
– Streets can be sorted by length,
name, income, home value, race,
age - all provided by the Census
Bureau (TIGER)
78. • Maximize the efficiency of planning and decision
making
• Provide efficient means for data distribution and
handling
• Elimination of redundant data base - minimize
duplication
• Capacity to integrate information from many sources
• Complex analysis/query involving geographical
referenced data to generate
GIS OBJECTIVES
79. Geospatial data are better maintained in a standard
format.
Revision and updating are easier.
Geospatial data and information are easier to search,
analysis and represent.
More value added product.
Geospatial data can be shared and exchanged freely.
Productivity of the staff improved and more efficient.
Time and money are saved.
Better decision can be made.
80. Facilities Management:
Locating underground pipes & cables, planning facility
maintenance, telecommunication network services
Environmental and Natural Resources Management:
Environmental impact analysis, disaster management and
mitigation
Street Network:
Locating houses and streets, car navigation, transportation planning
Planning and Engineering:
Urban planning, regional planning, development of public facilities
Land Information:
Taxation, zoning of land use, land acquisition
Area:
GIS Application:
81. Courses conducted at the
Directorate of Soil Survey and Soil Conservation
• Basics of Remote sensing and GIS & Global Navigation System
• Applications of RS & GIS for Natural Resources
• Applications of Microwave Remote Sensing for Natural Resource
Management
• Contact Number 0471 2339800