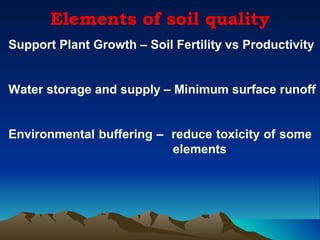
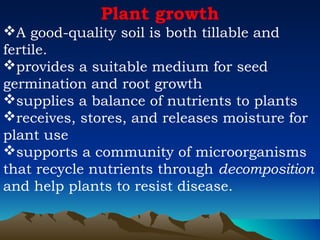
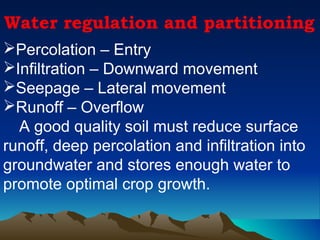
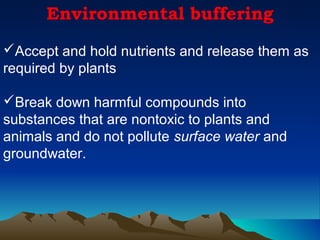
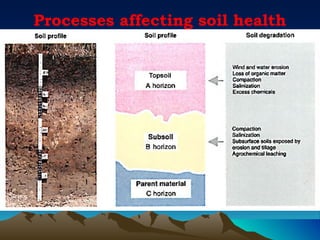
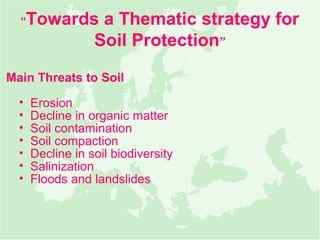
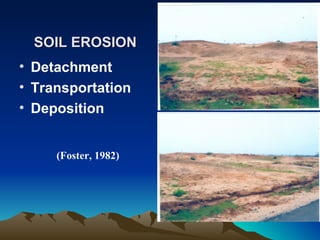
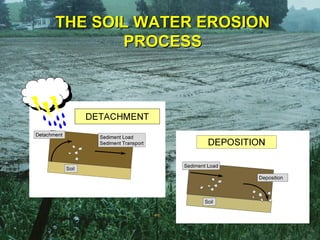
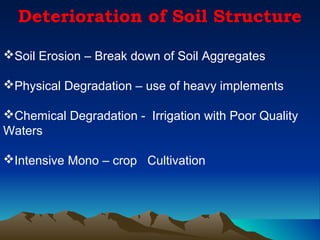
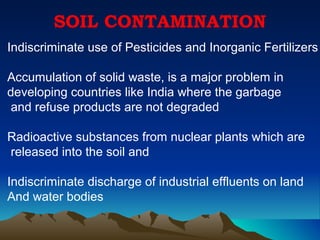
2. Soil Health â An Overview
Dr. M. Dhakshinamoorthy
Professor of Soil Science
Tamil Nadu Rice Research Institute,
Aduthurai
3. What is meant by the word âSoilsâ?
Soil is one of the most important earth materials we
encounter each day, but the definition of soil is
difficult.
Soil Scientists (and most ordinary people):
⢠fine-grained, well-weathered earth material that is able to
support plant growth
⢠focus on the physical and chemical properties
Engineers:
⢠any earth material that can be removed without blasting
⢠focus on particle size and the amount of organic material
⢠engineering applications
4. Soil defined as
âSoil is a natural dynamic body
differentiated into horizons of variable
depth which differ among themselves
and from the parent material below in
morphology, physical properties and
constitution, chemical properties and
composition and biological
characteristicsâ (Joffee)
5. The soil is teeming with life. It is a world of
darkness, of caverns, tunnels and
crevices,inhabited by a bizaree assortment of
living creatures
J. A. Wallswork
6. Some Facts about soil
1.Soil is not dirt
2.Soil is not inert
3.Soil is dynamic
4.Soil is a three dimensional body
5.Soil is a three/four phase system
8. Leaching
takes
minerals
carried by
water to the
subsoil
Humus gives
the topsoil a
rich brown
color
D
9. In the A horizon,
water percolates
downward and
carries minerals as
it goes. This is
called âleaching.â
Leaching carries
minerals down
into the lower soil
horizons.
10. The B-Horizon is called the
subsoil.
This horizon is where the
leached minerals from
horizon A end up.
These leached minerals may
color the subsoil. For
example, the presence of iron
my color the subsoil red.
Horizon B-Zone of Accumulation of leached minerals
11. The C-horizon is called the
zone of weathered bedrock.
When you have a residual soil,
one formed over the original
bedrock, the C-horizon
resembles the bedrock, but it
is weathered.
In a residual soil, the bedrock
is below the C-horizon.
Remember that the Coastal
Plain does not have bedrock
under the soil profile, but it
has layers of sand, clay and
gravel. That is because of the
sea level changes over time
and the rivers that flowed over
it.
12. Goods and Services provided by Soil
Human Health
Air
Biomass Production
(e.g. food chain)
Culture
Open Water
Biodiversity
Soil
Ground Water
13. S
O
I
Black Soil L Alkali Soil
S
O
F
I Red Soil
Sandy soil N
D
I
A
14. Soil Taxonomy
Entisols - soils with little or no morphological development
Vertisols - clayey soils with high shrink/swell capacity
Inceptisols - soils with weakly developed subsurface horizons
Aridisols - CaCO3-containing soils of arid environments with
moderate to strong development
Mollisols - grassland soils with high base status
Andisols - soils formed in volcanic ash
Spodosols - acid soils with a subsurface accumulation of
metal-humus complexes
Alfisols - soils with a subsurface zone of silicate clay
accumulation and >35% base saturation
Ultisols - soils with a subsurface zone of silicate clay
accumulation and <35% base saturation
Oxisols - intensely weathered soils, tropical and subtropical
Histosols - organic soils (peak, bog, muck)
Gelisols - soils with permafrost within 2 m of the surface
15. Soil Health
Soil health, provides an overall picture of the condition of many
properties and processes; the terms soil health and soil quality can
be used interchangeably.
Soil health or quality is the soil's fitness to support crop growth
without resulting in soil degradation or otherwise harming the
environment.
Soil quality changes slowly because of natural processes, such
as weathering, and more rapidly under human activity; land use
and farming practices may change soil quality for the better or
for the worse
Soil health deteriorates mainly through erosion by wind and
water, loss of organic matter, breakdown of soil structure,
salinization, and chemical contamination.
16. Assessing Soil Quality
Human Health â Physical functions, Mental
capacity, Emotional well
â being
Soil Quality â Physical, Chemical and
Biological properties of the
soil
â Soil Texture, Structure, Water
holding capacity,
pH, EC, CEC, etc.
17. Elements of soil quality
Support Plant Growth â Soil Fertility vs Productivity
Water storage and supply â Minimum surface runoff
Environmental buffering â reduce toxicity of some
elements
18. Plant growth
ďśA good-quality soil is both tillable and
fertile.
ďśprovides a suitable medium for seed
germination and root growth
ďśsupplies a balance of nutrients to plants
ďśreceives, stores, and releases moisture for
plant use
ďśsupports a community of microorganisms
that recycle nutrients through decomposition
and help plants to resist disease.
19. Water regulation and partitioning
ďPercolation â Entry
ďInfiltration â Downward movement
ďSeepage â Lateral movement
ďRunoff â Overflow
A good quality soil must reduce surface
runoff, deep percolation and infiltration into
groundwater and stores enough water to
promote optimal crop growth.
20. Environmental buffering
ďźAccept and hold nutrients and release them as
required by plants
ďźBreak down harmful compounds into
substances that are nontoxic to plants and
animals and do not pollute surface water and
groundwater.
22. â Towards a Thematic strategy for
Soil Protectionâ
Main Threats to Soil
⢠Erosion
⢠Decline in organic matter
⢠Soil contamination
⢠Soil compaction
⢠Decline in soil biodiversity
⢠Salinization
⢠Floods and landslides
25. SPLASH
EROSION
Soil Surface just before
rain drop impact
Soil Surface after
Rain drop impact
26. WIND EROSION
SUSPENSION
W IN SALTATION
D
CREEP
SALTATION DETACHES PARTICLES
SMALLER PARTICLES SUSPENDED
LARGER PARTICLES CREEP
SANDY AND SILTY SOILS MOST SUSCEPTIBLE
SOIL ACCUMULATION IN DITCHES AND FENCE ROWS
28. LOSS OF SOIL ORGANIC MATTER
ďSoil Erosion
ďMicrobial Oxidation
ďIntensive Cultivation
ďArid and Semi Arid Climate
ďLack of organic manure addition
ďRemoval of stocks and/or burning
29. Deterioration of Soil Structure
ďśSoil Erosion â Break down of Soil Aggregates
ďśPhysical Degradation â use of heavy implements
ďśChemical Degradation - Irrigation with Poor Quality
Waters
ďśIntensive Mono â crop Cultivation
30. SOIL CONTAMINATION
Indiscriminate use of Pesticides and Inorganic Fertilizers
Accumulation of solid waste, is a major problem in
developing countries like India where the garbage
and refuse products are not degraded
Radioactive substances from nuclear plants which are
released into the soil and
Indiscriminate discharge of industrial effluents on land
And water bodies
31. Consumption of pesticides in important states of India
Gross cropped area Consumption of Consumption of
State pesticide (MT) pesticide (g ha-1)
Andra Pradesh 12,783 7000 548
Gujarath 11,188 5000 447
Karnataka 12,013 2600 216
Madhya Pradesh 24,689 1299 53
Maharastra 21,418 3942 184
Orissa 9,724 1006 103
Punjab 7,693 7100 923
Rajasthan 20,380 3300 162
Tamil Nadu 7,113 2882 (Agnihotri,2000)
410
34. Metal content of some rock phosphates
(mg kg-1)
Rock phosphate Zn (mg kg-1) Cu (mg kg-1)
Mussoorie 100 115
Jhamarkotra 200 129
Kasipatnam 100 190
Purulia 350 140
Buyanovsky et al. (1990)
Udaipur 75 85
35. Content of some heavy metals in
imported rock phosphates (mg kg-1)
Rock Cd Hg Pb Ni Zn As
phosphate
Morocco 18 0.04 2 30 270 10
Florida 5 0.09 12 13 80 5
Tunisia 34 0.03 2 16 290 2
FAO, 1975
Senegal 71 0.33 4 53 500 2
USSR 0.2 0.01 4 0.5 20 <1
36. Cd concentrations in phosphate
fertilizers (mg kg-1)
Country Range
Canada 2.1 â 9.3
Australia 18.0 â 91
USA 7.4 â 156
Netherlands 9.0 â 60.0
Tiller, 1983
sweden 2.0 â 30.0
37. Heavy metal contents (average) in fertilizers
Fertilizer Heavy metal (mg kg-1 fertilizer)
Cu Zn Mn Mo Cd Pb
Single super phosphate
26 115 150 3.3 187 609
Diammonium phosphate
- - - 109 188 -
Muriate of potash
3 3 8 0.2 14 88
Ca-ammonium nitrate
0.2 6 11 - 6 200
Urea
0.4 0.5 0.5 0.2 1 4
Ammonium sulphate
38. Industrial Effluents
S. Size of Industrial Number of Red Alert
No. Unit Units Units
1. Large Units 700 450
2. Medium units 2200 1000
The Hindu, 1997
3. Smaller Units 14000 6500
39. Industrial units
Industrial Unit Pollutant
Thermal Power Heavy Metals
Paper High pH, BOD and COD
Rubber High salt, Chlorides, High pH, BOD
Steel Acids, Phenols, Cyanides, Low pH, Oils, Fe salts
Textile Sodium salts, Organic Compounds, High pH, Fibres
Oil Refineries Acids, Bases, Resins, Phenols, Petrochemicals
40. Industrial units
Industrial Unit Pollutant
Organic Chemicals Toxic Compounds, Phenols, High/low pH
Explosive Chemicals Alcohol, Heavy Metals, Organic Compounds
Fertilizers High pH, Heavy Metals, Fluorides, Ammonia cpds
Cement Dust, Sodium salts, High BD
Food Industries High BOD and COD, Organic compounds
Soap Acids, Fats, Glycerol, Phosphates, S hydrocarbons
41. Content of Toxic heavy metals (mg kg-1)
in Punjab
Fe Zn Cu Pb Ni As Cr
Highly industrialized 6.2 0.68 0.94 0.053 0.14 1.38 0.189
Less industrialized 0.15 0.24 0.26 0.032 0.004 0.23 0.004
Source : Khurana et al. (2003)
42. Heavy metal characterization in various industrial effluents
S1- Sewage water ; S2 - Electroplating ; S3 - Textiles ;
S4 - Dying ; S5 â Foundry
70.0
60.0
50.0
-1
)
40.0
Sewage
30.0
m
C
L
g
n
o
e
(
t
20.0 EP Textiles
10.0 Dye
0.0
Ni Pb Cd Cr Cu Zn
S1 S2 S3 S4 S5
43. Range and mean values of the total heavy
metal content of the soil collected from Erode
Place of soil Concentration (mg kg-1)
collection
Cr Ni
Range Mean Range Mean
RN Pudur 126 â 468 261 96â 187 141
Agraharam (Big) 288 â 446 322 73 â 176 116
Agraharam (Small) 98 â 156 103 66 â 178 125
44. Heavy metal content (mg kg-1) of soils
treated with sewage and solid waste
around Hyderabad
Heavy metals Normal soil Treated soil
Lead 5.0 170.0
Nickel 2.0 10.0
Cobalt 5.0 7.0
45. TANNERY INDUSTRY WASTE
India is the major exporter of processed leathers.
Animal skins and hides are converted into non-biodegradable, stable and
quality leathers through a process known as tanning.
This process includes dehairing, removal of flesh and fat, and treatment
with either plant extracts (vegetable tanning) or chemicals (chrome
tanning).
Several chemicals, including salts and heavy metals, are used in
chemical tanning.
Such process results in large quantities of solid waste (sludge).
It is estimated that annually more than 1,24,400 tonnes (dry weight
basis)of
tannery sludge are produced from 1008 small and 75 large tanneries in
India.
46. STATUS OF TANNING INDUSTRIES IN INDIA
It is estimated that tanning industry wastes have already contaminated over
50,000 ha of productive agricultural land.
In chrome tanning, 276 chemicals and 14 heavy metals are used.
It is estimated that approximately 32,000 t of basic chromium (cr) sulfate
salts are used annually in Indian tanneries.
This amounts to an annual loss of nearly 2000-3200 t of Cr (on an
elemental basis).
The concentration of Cr in the effluents from the chrome tanning yard is in
the range 2000-5000 mg L-1.
International regulations stipulate that the Cr concentration in industrial
waste shall not exceed 2 mg L-1.
47. Salt and heavy metal content of tannery sludge
Location pH EC Na Cr Cu Zn
(H2O) (dSm- (mg kg-1) (mg kg-1) (mg kg-1) (mg kg-
1
) 1
)
Ambur 7.95 12.5 49451 5406 42 121
Vaniyambadi 8.11 4.0 10021 1605 19 54
Vaduganthangal 8.46 8.3 12231 8241 42 67
Pernampet 7.70 20.8 29239 16158 32 51
49. Heavy metal content (ppm) of the soil treated with different
dilutions of tannery effluent
Treatment Zn Cu Fe Mn Cr
100% effluent 2.2 1.2 5.4 6.2 0.17
50:50 effluent:water 2.3 1.3 5.8 0.6 0.15
33:67 effluent:water 2.2 1.3 5.6 7.2 0.12
25:75 effluent:water 2.2 1.3 5.6 6.6 0.99
20:80 effluent:water 2.4 1.4 5.4 8.8 0.12
10:90 effluent:water 2.5 1.4 6.8 8.8 0.10
Control(water alone) 2.6 1.6 7.2 10.0 0.02
50. DISTILLERY SPENT WASH
More number of sugar factories in the country, more and more
factories producing alcohol are being established.
Molasses, containing 8 per cent of sugar, serves as a cheap source
of raw material for the production of alcohol.
Every Lit of alcohol, nearly 12 to 14 Lit of effluent is discharged.
Each unit is discharging 5 to 10 lakh Lit of raw effluent every day.
Sakthi Sugars Distillery Unit discharged 10 lakh Lit of effluent/ day.
The primary treatment plant the BOD has been reduced from
45,000 to 4,500 ppm and COD from 1,00,000 to 35,000 ppm.
These values are found to exceed the limits prescribed by PCB
norms.
51. SAGO FACTORY EFFLUENT
Most of the sago factories in India are concentrated in
Tamil Nadu.
Out of 800 sago factories in Tamil Nadu, 650 are located in
Salem district.
A Sago factory with a capacity to produce 3,500 kg starch
per day, uses 110 m3 to 115 m3 water per day.
Of this, 95-100 m3 (nearly 87%) water comes out as waste
water after processing.
Because of the starch content in the waste water, the
microbial activity is more in the stagnated waste water
resulting in unpleasant odour (Balagobal et al., 1977).
52. SAGO FACTORY EFFLUENT (Continued)
Sago factory effluent contains appreciable quantities
of TSS and is acidic in nature with high EC.
High amounts of P and K and moderate level of N
with very low quantities of trace elements.
Sago factory waste water irrigated soils have lower
apparent and absolute specific gravity and water
holding capacity and has slightly higher porosity
than the corresponding control soil.
Balagobal et al., 1977
53. TEXTILE INDUSTRY EFFLUENT
Processing such as boiling, bleaching, dyeing, sizing desiring
mercerizing, printing and finishing which can let out copious quantities
of waste waters and sludges which are usually dumped on river beds as
well as on public areas.
Accumulation of such waste material slowly create environmental
degradation on soil ecosystem, ground water status and crop stand and
its yield potentials.
For Colouring the textile materials several dyes and colouring agents
were used
Textile mills require large quantity of high degree pure water and also
they discharge high volume of wastewater.
The land and water and the ecosystem located on the Cauvery river
area and its tributaries Bhavani, Noyyal are adversely affected.
54. Causes of Acid Rain
⢠The principal cause of acid rain is from human
sources
â Industrial factories, power-generating plants and
vehicles
â Sulphur dioxide and oxides of nitrogen are released
during the fuel burning process (i.e. combustion)
MSN Encarta
57. NITRATE POLLUTION OF GROUNDWATER
Pollution of groundwater from fertilizer N is caused by leaching.
The magnitude of loss depends upon soil conditions, agricultural
practices, agro-climatic conditions, and type of fertilizers and methods
of application.
The time taken by nitrate to move from the root zone to the water
table, therefore, varies considerably.
In sandy soils with high water table and high rate of fertilizer
application, it may reach the water table in matter of days whereas in
heavy soils, low rainfall and low rate of application with deep water
table, it may take years.
Two main alleged health hazards are blue baby disease of young
babies and cancer due to nitrate ingestion in food and water.
World Health Organization (WHO) recommends that drinking water
should not contain more than 50 mg NO3 â L-1.
58. ENVIRONMENTAL PROBLEMS RELATED TO FERTILIZER USE, THEIR
MITIGATION STRATEGIES AND IMPLICATIONS IN INDIA
Environmental Causative mechanism Mitigation Seriousness of the
problem and impact strategies problem in India
Stratospheric Nitrous oxides from Use of Emission from
ozone burning of fossil
nitrification, soil is low
depletion and fuels by industry,
urease compared to
global climate automobiles and
change from denitrification inhibitor, countries
of nitrate in soils increasing where
are transported to fertilizer use fertilizer N
the stratosphere efficiency, use is higher
where ozone
avoid
destruction occurs;
ultraviolet radiation intermittent
incident on earthâs wetting and
surface increases, drying in rice
59. What we know about GW
⢠CO2 content of the air has increased from 280 to
~360 PPM since the industrial revolution.
⢠Average world temperatures have risen by around
0.5 centigrade in the last 100 years.
⢠The levels of CFCs, nitrous oxide and methane have
also increased in the upper atmosphere.
⢠The ozone layer above the poles continues to thin.
⢠The worldâs forested area has shrunk by more than
50% in 100 years.
⢠The last 20 years has been dominated by a series of
record climatic highs.
⢠Sea levels have risen 1 foot in the last 100 years
and alpine glaciers are shrinking/retreating rapidly.
60. Anthropogenic greenhouse gases in the atmosphere. (Source:
Carbon Dioxide Information Analysis Center, Oak Ridge National
Laboratory.)
61. Nutrient Mining in India
Removal of nutrients 28.5 M. Tonnes
Addition of nutrients 18.5 M. Tonnes
Depletion 10.0 M. Tonnes
In Tamil Nadu
Removal of nutrients 9.14 lakh tonnes
Addition of nutrients 7.91 lakh tonnes
Depletion 1.23 lakh tonnes
Fertilizer consumption in T.N. 157 kg ha-1
National consumption 971 g ha-1
(Fert. News, April 2001)
62. Extent of Nutrient Deficiency (%)
Nutrient India Tamil Nadu
Nitrogen 100 100
Phosphorus 98 85
Potassium 30 40
Sulphur 18 20
Iron 12 17
Manganese 5 6
Copper 3 5
Zinc 50 60
63. Nutrient Use Efficiency in India
Nutrient Efficiency (%)
Nitrogen 30-50
Phosphorus 15-20
Potassium 50-60
64. Soil Health care â Issues and Strategies
Issues
Issues Strategies
SOIL SOIL HEALTH CARE
DEGRADATION
Industrial wastes Scientific and Technical
Pesticides Management
Fertilizers Phytoremediation
Sewage INM, IPM. ISFM etc
Radionuclides Alternative cropping
Biotic interference Regular monitoring
Salinisation Decision Support
Waterlogging Systems
Increasing awareness
65. Integrated Nutrient Management
What is INM?
Integrated use of all available resources â Fertilizers,
Organic and Green Manures, Biofertilizers, Crop Residues,
Agricultural and Industrial Wastes
Why INM?
To effectively utilize all the available resources and bridge
the gap between the requirement and availability of
fertilizers and thereby reduce the cost of cultivation
66. Estimates of the availability of some crop residues in
India and their plant nutrient potential
Crop Residue Nutrient Nutrient potential (000 t)
yield
(000 t)
N P2O5 K2O Total Utilizable Fertilizer
equivalent
Rice 1,10,495 0.61 0.18 1.38 2,398 799 399
Wheat 82,631 0.48 0.16 1.18 1,504 501 250
Sorghum 12,535 0.52 0.23 1.34 262 87 43
Maize 11,974 0.52 0.18 1.35 252 84 42
Pearl millet 6,967 0.45 0.16 1.14 121 40 20
Barley 2, 475 0.52 0.18 1.30 51 17 8
67. Nutrient potential of harvest residues in Tamil Nadu
Residue yield Nutrient potential
Crop
N P2O5 K2O
--------------------------------------(lakh tonnes)---------------------------
Rice 90.92 0.53 0.21 1.51
Sorghum 8.50 0.05 0.02 0.16
Pearl millet 5.08 0.03 0.01 0.11
68. Nutrient potential of urban and Agro-
industrial wastes in Tamil Nadu
Waste Quantity Nutrient potential
N P2O5 K2O
-------------------------------(lakh tones or *
litres )-----------------
Pressmud 3.0 0.04 0.05 0.02
Sugar mill 30.0* 0.06 0.02 0.33
effluent
Raw coir pith 2.8 0.007 0.001 0.022
Sewage sludge 2.6 0.09 0.04 0.07
69. Animal manure and its nutrient potential in Tamil Nadu
Wet Urine Nutrient potential
Animal Dung
N P2O5 K2O
-------------------------------(lakh tones)---------------
Cattle 827 354 1.95 0.87 1.12
Sheep & 44 22 0.62 0.10 0.66
Goat
70. Composting technologies available and developed
at TNAU
1. Preparation of coirwaste compost using
yeast sludge
2. Rapid composting technology for sugarcane
trash using yeast sludge
3. Alternate method of sugarcane trash
composting
4. Vermicomposting technique
5. Farm waste composting
6. Urban solid waste composting
7. Bio-compost from bagasse based pulp and
paper mill
71. WARNING PLâŚâŚ..
UPON THIS SOIL
OUR SUVIVAL DEPENDS
HUSBAND IT AND
DO NOT ABUSE IT