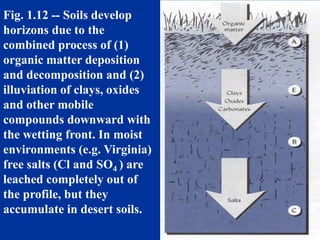
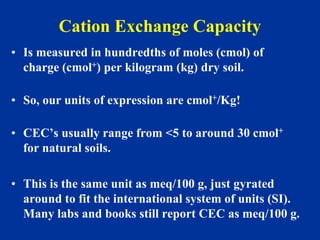
Downloaded 34 times

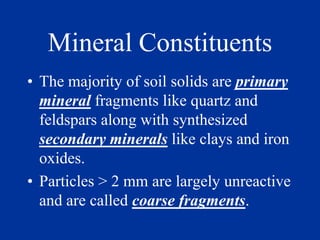
![Types of Charged Surfaces
(Colloids) in Soils
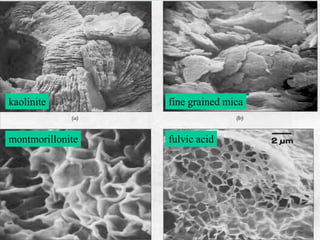
• Layer Silicate Clays like Kaolinite
• Poorly crystalline minerals like allophane
and imogolite in Andisols
• Iron (Fe00H or Fe203) or Aluminum
[Al(OH)3] oxides or hydroxides. These
usually coat other mineral grains
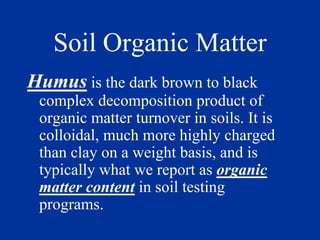
• Humus (organic compounds produced by
microbial decomposition of OM)](https://image.slidesharecdn.com/18027soilscience-190619171947/85/SOIL-SCIENCE-PDF-PPT-74-320.jpg)
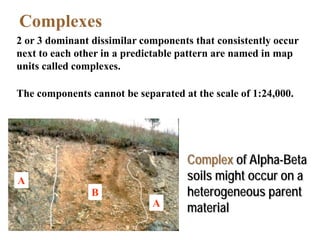
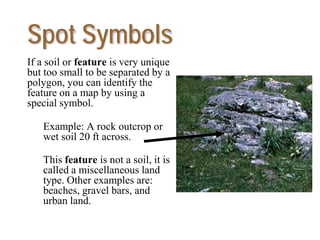
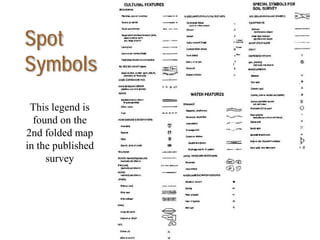
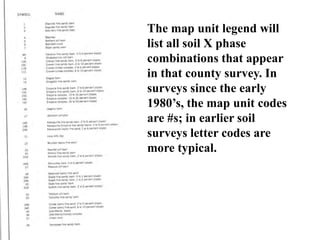
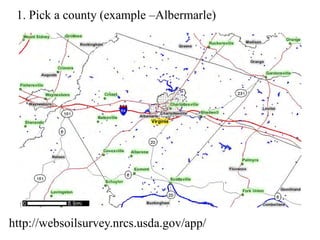
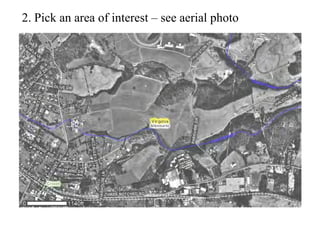
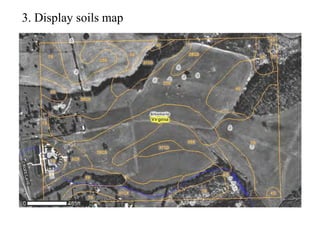
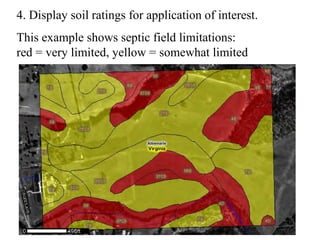

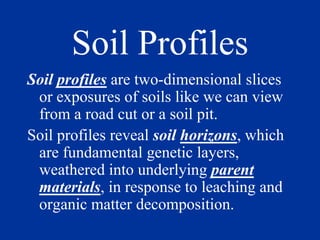
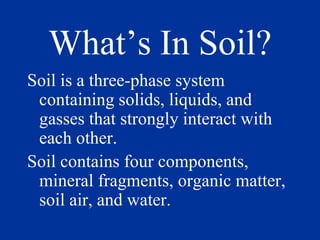
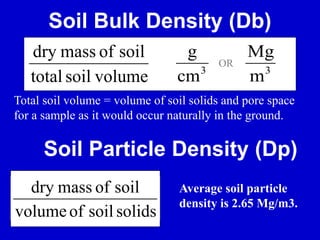
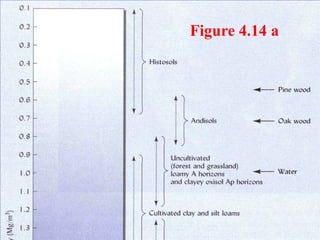
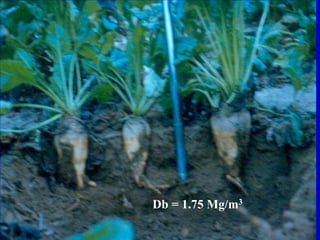
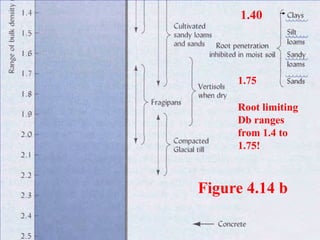
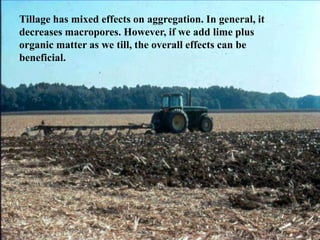
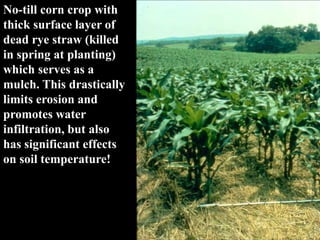
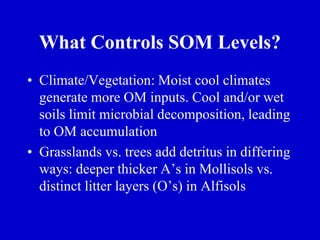
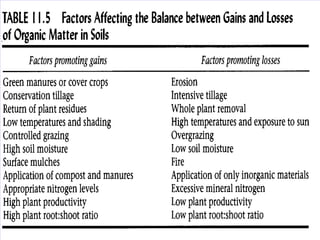
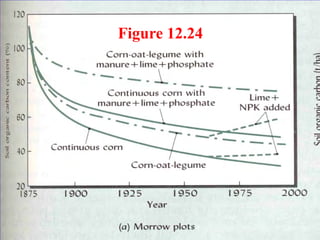
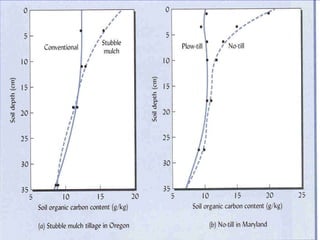
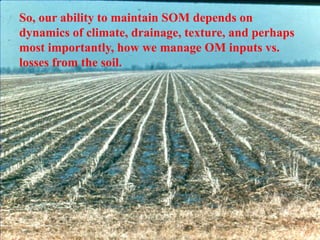
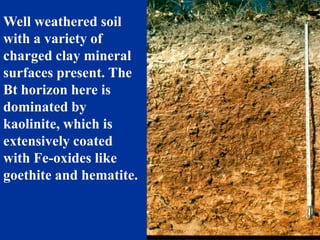
The document provides information on basic soil science concepts. It discusses soil profiles, horizons, texture, structure, bulk density, organic matter content, hydrology, pH, cation exchange capacity, and soil mapping. Key points covered include the major horizons in a soil profile, factors that control soil organic matter levels, the difference between plant available water and total water held in soils, and how soils are delineated on maps.


