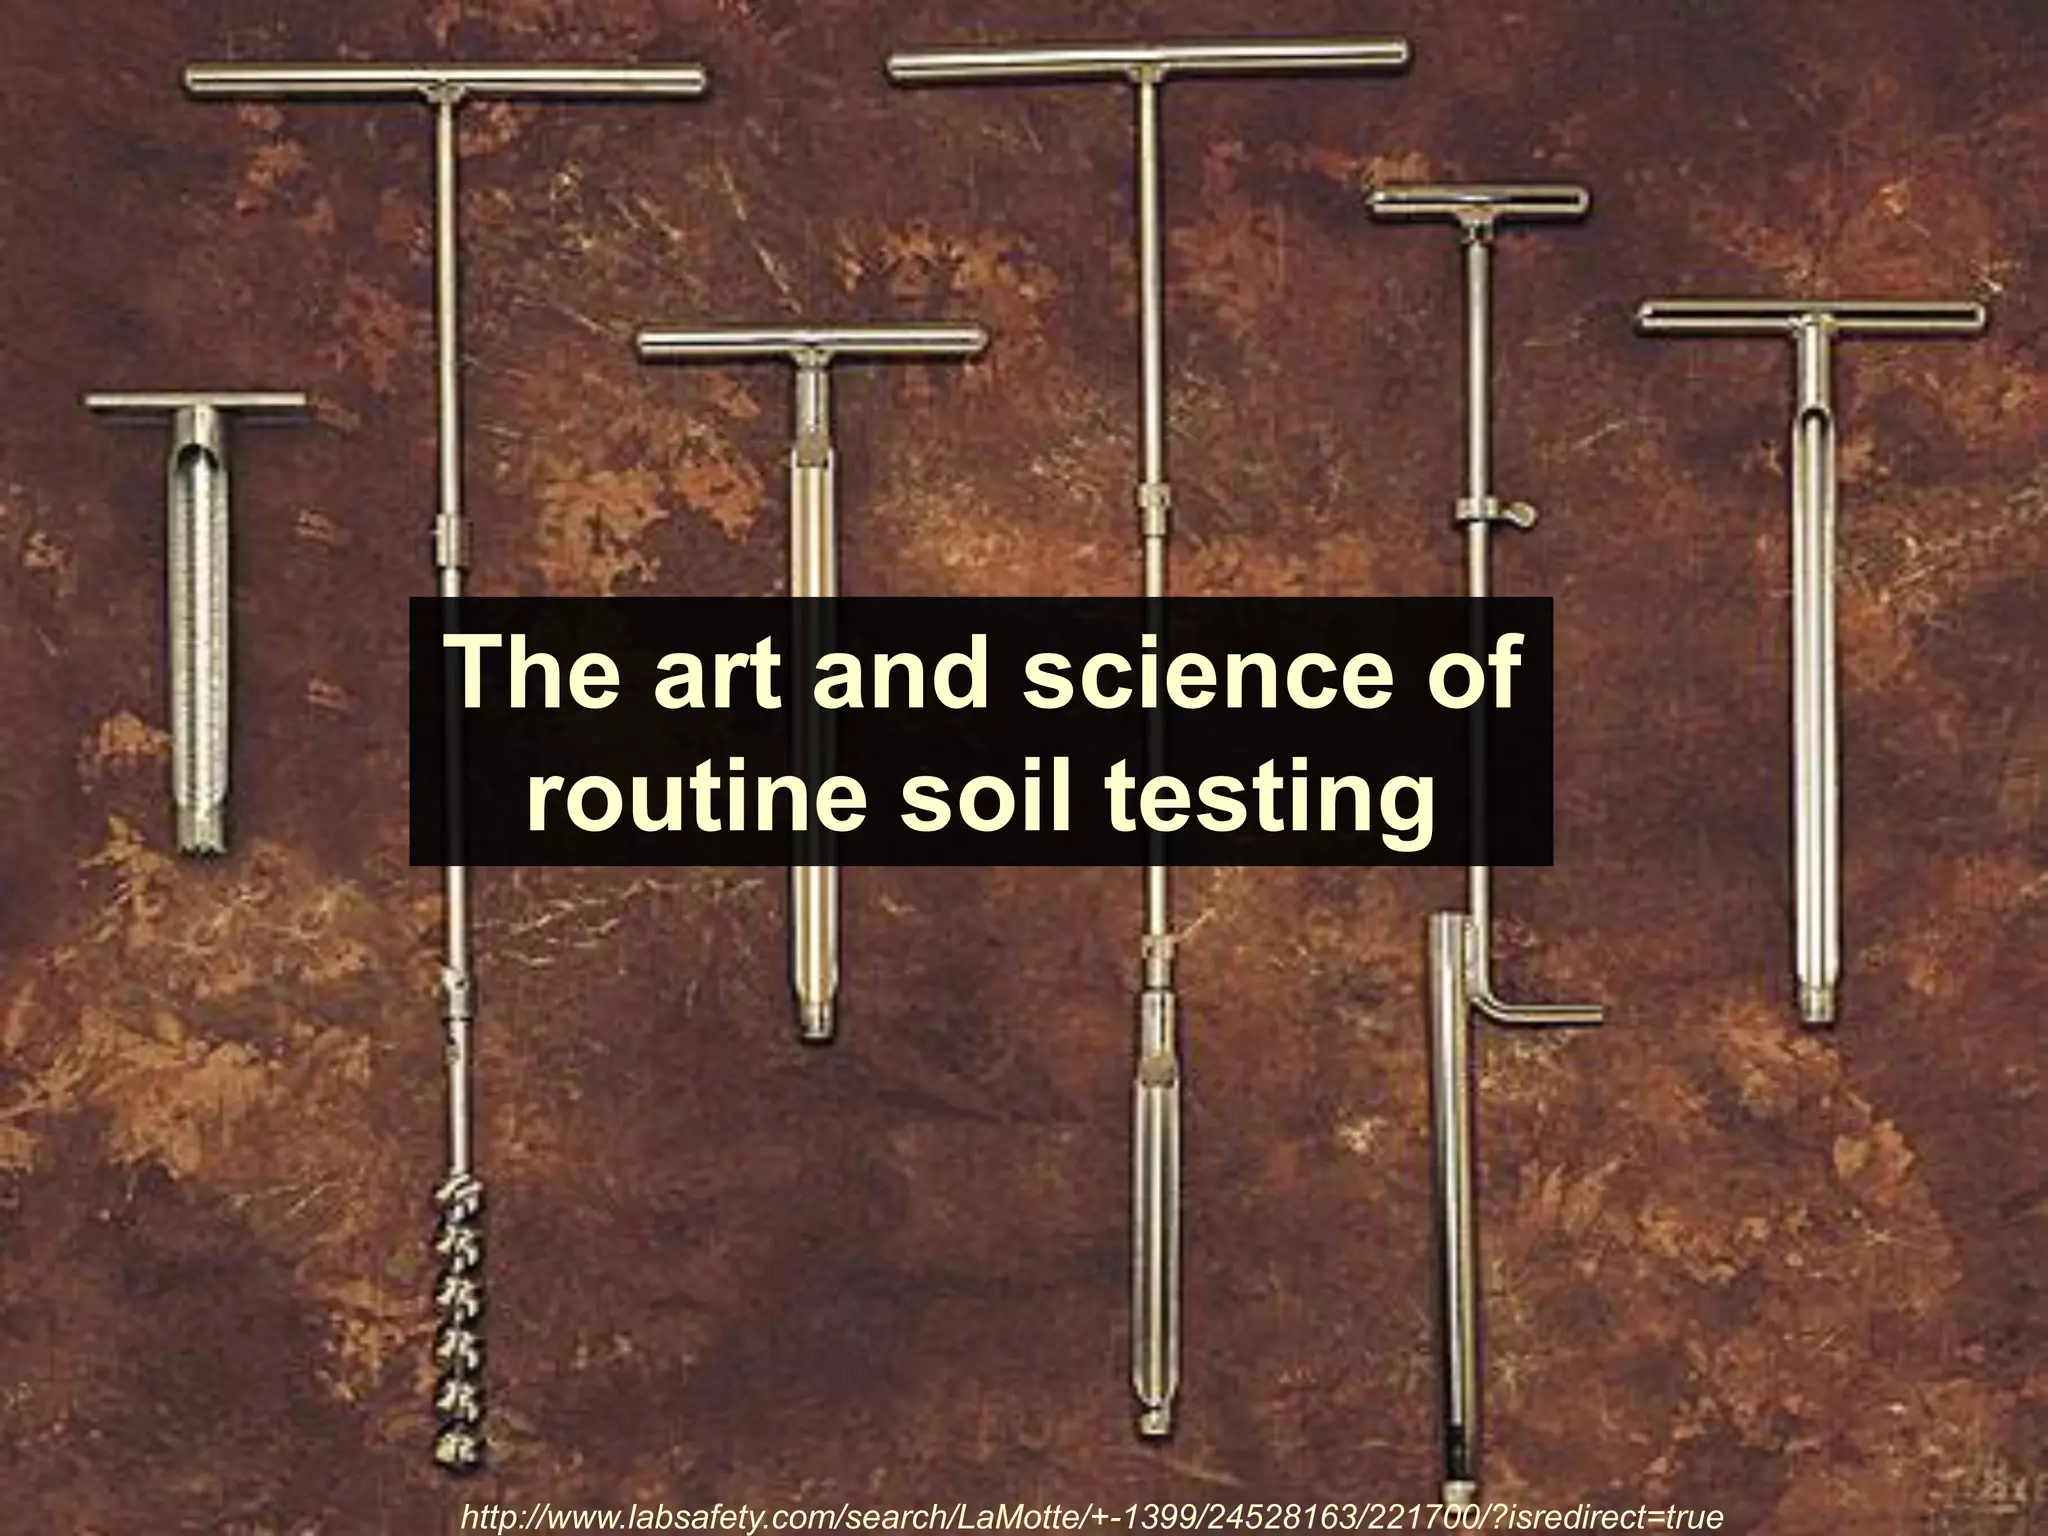
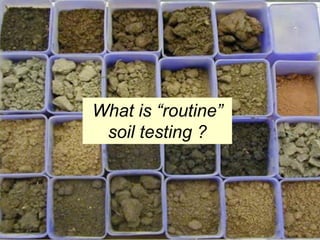
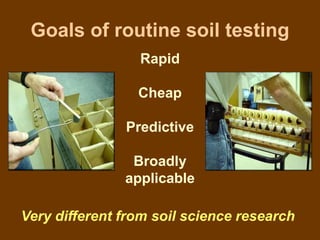
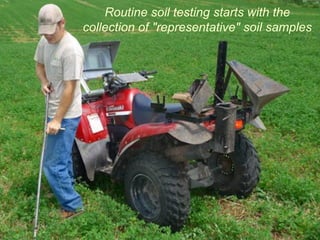
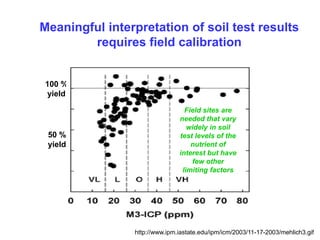
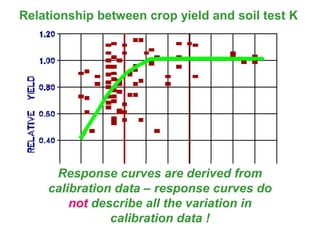
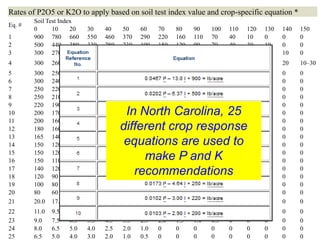
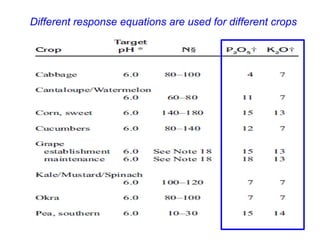
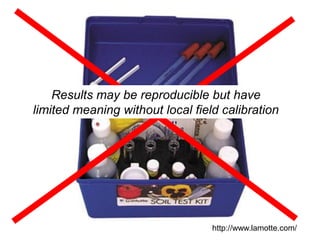
The art and science of
 routine soil testing


http://www.labsafety.com/search/LaMotte/+-1399/24528163/221700/?isredirect=true
What is “routine”
 soil testing ?
Goals of routine soil testing
                 Rapid

                 Cheap

               Predictive

                Broadly
               applicable

Very different from soil science research
Routine soil testing starts with the
collection of "representative" soil samples
How many samples
                       should be collected
                          from each field ?


      The optimum number of
          soil samples is a
       compromise between
      what should be done (to
      accurately represent the
       field) and what can be
          done (time/cost).


120 acre field
What is a
                                 composite
                                  sample?


       The U of Illinois currently
        recommends collecting
       1 composite sample per
              2.5-acres.


120 acre field
Composite
                    sampling


   Multiple sub-
   samples are
  collected from
each management
  unit and mixed
     together
This does not mean that we should all be collecting 20 cores per
composite sample but using only 5 cores per composite is a major compromise.
If we don’t collect enough sub-samples or collect
  sub-samples at different depths or times… our
         soil sampling will lack precision


      Accuracy vs. precision??
Lack of precision in soil sampling
          = unrepeatable results
                             *
                        * *
                                 *

   How do you know if soil test results
            are accurate?
Inaccurate results => inappropriate fertilizer recommendations
Grid vs. Zone Sampling

  "We've been moving in circles for years," says Gyles
  Randall, soil scientist, University of Minnesota. "Grid
    sampling was the hottest thing going, but it was
  expensive. The question was if growers were getting
 their money's worth. If land is owned or under a long-
 term rental agreement, I like grid-based sampling, but
under a short-term rental basis, you can hardly justify it."
Matt Duncan, Key Agricultural Services, Macomb, Ill., is a strong believer
 in grid sampling. However, it is only one part of the equation. "We found
that after multiple soil test cycles using grid sampling based variable rate
   applications, in many cases highs were getting higher and lows were
   getting lower," says Duncan. "When we looked at the GPS yield data
  history, we noticed the crop yields were consistently higher in the field
areas with decreasing soil test values and lower in the areas of increasing
                                soil test levels."
Soil management zones
  A management zone
    approach is only
 possible if knowledge
                                               Soil 3
   of soil variation is
      preexisting.             Soil
                                                        Soil 4

                                1


Knowledge of soil variation:

 County soil survey maps              Soil 2
   Old field boundaries
Past management records
How well do soil survey mapping units
    relate to crop productivity ?


 Sometimes very well… other times not so well
Monitoring change over time will be much easier
  if soil samples are collected from the same
    locations each time the field is sampled.

  Sampling locations can be identified using GPS
equipment or by more traditional methods such as a
                measuring wheel.

  The U of Illinois recommends compositing 5 soil
cores from within a 10-foot radius to represent each
                  sampling location.
Important soil sampling considerations

Avoid sampling areas that are clearly not representative
         (old manure piles, eroded knolls…)

               Use clean sampling tools

        Collect samples from a depth that is
    appropriate for your soil management system:

              conventional tillage = 6-8”
                  no-till or lawn = 4”

       Multiple sampling depths (e.g., 0-2” & 2-8”)
      is often desirable for long term NT systems
Nutrient Stratification and No-till – Is it a problem??
Late summer and fall are often recommended as
    the best times for collecting soil samples

- the soil samples used for soil test correlation are normally
             collected in the late summer/fall

 - potassium test results are most reliable during the late
                        summer/fall

     - nutrient uptake by summer crops has occurred

                - soil is more likely to be dry

   Keep in mind that soil testing labs are normally
      the busiest in the late summer and fall
If possible, sample at ~ the same time every year !
Many labs will only accept samples
 in official sample bags or boxes
Field moist soil samples should be delivered to a
       lab ASAP or dried prior to storage
Samples should be accompanied
  by a submittal form specifying
desired analyses and crop and soil
     management information
When samples arrive at a high
throughput lab, they are entered
 into a tracking system and then
      prepped for extraction.
Sample prep generally consists
   of drying and grinding.
Small sub-samples of prepped
 soils are isolated (normally
  volumetrically) and then
          extracted.

  Extraction is a process of
briefly washing a soil. It is not
   intended to simulate the
  process of root uptake or
remove all available nutrients.
A variety of soil extractants are
used by soil testing labs in the
        Midwest region.


Examples of extractants: Bray 1, Olsen,
 Ammonium acetate, Hot water, DTPA,
        Mehlich 1, Mehlich 3
Mehlich 3 extractant
         most widely used universal extractant

  The Mehlich 3 extractant was developed by Dr. Adolph Mehlich
  to estimate plant availability of macronutrients and micronutrients
  in soils with a wide range of physical and chemical properties.
  Adopted by the NCDA soil testing lab in 1981, the Mehlich 3
  extractant has reduced analytical costs by replacing multiple
  extraction methods.

  Reference: Mehlich A. 1984. Mehlich-3 soil test extractant: a
  modification of Mehlich-2 extractant. Commun Soil Sci Plant Anal
  15(12):1409–16.

  Composition: (0.2N CH3COOH + 0.25N NH4NO3 + 0.013N HNO3
  + 0.015N NH4F + 0.001M EDTA)

Would this extracting solution be useful for measuring plant available N?
Ion exchange resins


       Plant root simulator probes –
an alternative method of nutrient extraction
Traditionally sample extracts were analyzed
using different methods for different nutrients
    but many labs now use sophisticated
instruments that can analyze many nutrients
                simultaneously.
Most large labs use an Inductively Coupled Plasma Atomic Emission
    spectrometer to analyze soil extracts for multiple elements


       I am an ICP!
By themselves, extractable
nutrient levels are not informative.
Extractable nutrient levels provide an index of
 nutrient availability that can be interpreted
     using results from field experiments.
moisture      temperature    microbial activity


  Extractable nutrient levels are not
directly related to most of the factors
controlling nutrient availability during
          a growing season.


        rooting depth        root health
Meaningful interpretation of soil test results
        requires field calibration


100 %
yield

                                   Field sites are
                                 needed that vary
                                    widely in soil
 50 %                            test levels of the
 yield                               nutrient of
                                 interest but have
                                     few other
                                  limiting factors


         Soil test P concentration (ppm)
                  http://www.ipm.iastate.edu/ipm/icm/2003/11-17-2003/mehlich3.gif
Relationship between crop yield and soil test K


     Response curves are derived from
    calibration data – response curves do
        not describe all the variation in
               calibration data !
Rates of P2O5 or K2O to apply based on soil test index value and crop-specific equation *
        Soil Test Index
Eq. #
        0      10     20     30     40    50    60    70    80    90    100   110   120   130   140   150
1       900 780 660          550    460   370   290   220   160   110   70    40    10    0     0     0
2       500 440 380          330    280   230   190   150   120   90    70    40    30    10    0     0
3       300 270 230          200    180   150   130   100   80    70    50    40    20    10    10    0
4       300    260    220    180    150   120   100   70    60    40    30    20    20    20    20    10–30
5       300    250    210    170    130   100   80    50    30    20    0     0     0     0     0     0
6       300    240    190    140    100   60    30    10    0     0     0     0     0     0     0     0
7       250    220    190    160    140   110   90    70    50    40    30    10    0     0     0     0
8       250    210    160    130    90    60    30    10    0     0     0     0     0     0     0     0
9       220    190    160    140    120   100   80    60    50    30    20    10    10    0     0     0
10      200    170    150    120    100    In North Carolina, 25
                                          80    60    50    30    20    10    10    0     0     0     0
11      200    160    120    90     60    40    20    0     0     0     0     0     0     0     0     0
12      180    160    140    130    110   different crop response
                                          90    80    70    50    40    30    20    20    10    0     0
13      165    140    110    90     70    50    30    20    10    0     0     0     0     0     0     0
14      150    120    100    80     60     equations are used to
                                          40    30    10    0     0     0     0     0     0     0     0
15      150    120    90     70     40    30    10    0     0     0     0     0     0     0     0     0
16      150    110    70     40     10    0    make P and K
                                                0     0     0     0     0     0     0     0     0     0
17
18
        140
        120
               120
               90
                      100
                      60
                             80
                             40
                                    70
                                    20
                                          50
                                          0
                                             recommendations
                                                40
                                                0
                                                      30
                                                      0
                                                            20
                                                            0
                                                                  10
                                                                  0
                                                                        10
                                                                        0
                                                                              0
                                                                              0
                                                                                    0
                                                                                    0
                                                                                          0
                                                                                          0
                                                                                                0
                                                                                                0
                                                                                                      0
                                                                                                      0
19      100    80     70     60     40    30    20    10    0     0     0     0     0     0     0     0
20      80     60     40     20     0     0     0     0     0     0     0     0     0     0     0     0
21      20.0   17.0   14.0   11.5   9.5   7.5   5.5   4.0   2.5   1.5   0.5   0     0     0     0     0
22      11.0   9.5    8.0    7.0    6.0   5.0   4.0   3.0   2.5   2.0   1.0   1.0   0.5   0     0     0
23      9.0    7.5    6.5    5.5    4.5   3.5   2.5   2.0   1.5   1.0   0.5   0     0     0     0     0
24      8.0    6.5    5.0    4.0    2.5   2.0   1.0   0     0     0     0     0     0     0     0     0
25      6.5    5.0    4.0    3.0    2.0   1.0   0.5   0     0     0     0     0     0     0     0     0
Different response equations are used for different crops
Results may be reproducible but have
limited meaning without local field calibration


                                  http://www.lamotte.com/
20 labs actually29 member labsIL 2008
                      located in in
2008 ISTA Members (alphabetical)

A                                    K
A&L Great Lakes Laboratories, Inc.   Key Agricultural Services
Lois K. Parker                       Dean Wesley
3505 Conestoga Dr.                   114 Shady Lane
Ft. Wayne, IN 46808                  Macomb, IL 61455
Tel: 260-483-4759                    Tel: 309-833-1313
Fax: 260-483-5274                    Fax: 309-833-3993
Additional member: Julie Bruggner    Additional members: Tad Wesley

AgriEnergy Resources                 KSI Laboratory
Gary Cambpell                        David Brummer
21417-1950 E. St.                    202 S. Dacey Dr.
Princeton, IL 61356                  Shelbyville, IL 62565
815-872-7790                         Tel: 217-774-2421
815-872-1928                         Fax: 217-774-2866
gcampbell@agrienergy.net             ksilabdbrummer@consolidated.net
Additional member:
Ann Berry - aberry@agrienergy.net    M
                                     M & R Ag Services
AgSource Cooperative Services        Mick Capouch
Steve Peterson                       16747 W 200N
106 N. Cecil St., PO Box 7
Quality Control
Members of ISTA are required to participate in a quality
control program referred to as the Split Sample Soil
Test Comparison Program. In this process, six samples
are sent quarterly to all member labs. The labs test the soil
and return the raw data to an independent accounting firm.

This information is then gathered yearly and used in a
Reliability/Repeatability report. A level of proficiency is
required to receive a Certificate of Good Standing from
ISTA. This certificate is the member's accreditation and is
their clients' assurance that the information they receive is
reliable, consistent and accurate.

Some ISTA member labs also participate in an additional
National Proficiency Testing Program (NAPT).
Good labs include standard (aka check) samples in every
analytical run. This allows them to quickly identify problems.
Choose a lab and stick with it !


         Different labs
            often use
            different
         analytical and
         interpretation
            methods
Recommendations

     Analytical results


  So what do the
numbers mean ???
Analytical results


                     Recommendations
Analytical results can be obtained
   without recommendations
Analytical results are commonly presented as
   concentrations of extractable nutrients
   (e.g., ppm or lbs/ac) but are sometimes
     presented as unit-less index values

     As a general rule, ppm * 2 = lbs/ac
       (assuming a plow layer weighs 2 million lbs)


As stated earlier, by themselves, extractable
     nutrient levels are not informative.

 Extractable nutrient levels provide an index of
nutrient availability that can be interpreted using
          results from field experiments.
Have any of you ever had to run a 40
   as part of a try-out for a team?


                             How well does your
                             40 time predict your
                              ability to play the
                                    game?
Turning analytical results into recommendations
              - the sufficiency approach


Critical levels of extractable nutrients have been identified using field experiments
  The critical levels identified across the US vary because of differences in soil
properties and also because of differences in the interpretation of field experiments
Build and maintenance approach


                         Critical Level
Soil is a black box !!!!
Maintenance applications of fertilizer
(i.e., replacing nutrients removed in
           harvested crops)
       make sense conceptually
                **but**
   do not necessarily make sense
            economically !
Regional variation in soil test K


http://soilfertility.unl.edu/Materials%20to%20include/2001%20NCR%20potassium_files/image008.g
                                                   if
Changes in soil test results between 2001 and 2005


  Some of these trends are a little surprising !
 Increased use of conservation tillage may be responsible
http://www.ipni.net/ppiweb/bcrops.nsf
Soil Test K


Change between 2005 and 2010     % of samples below critical level
Soil Test P


Change between 2005 and 2010     % of samples below critical level
Nutrient balancing concepts
Nutrients interact in plant and soil systems. Some
important nutrient interactions include ammonium-
calcium, phosphorus-iron, phosphorus-copper,
phosphorus-zinc, and potassium-magnesium-calcium.

Some consultants and private labs place great
emphasis on “base cation ratios”.

Typical target ratios: 65-75% Ca : 10-15% Mg : 2-5% K
Nutrient interactions and proper nutrient
   balance should be considered in relation to
 nutrient supply – i.e. the availability of nutrients
                     in the soil.

     Nutrient supply is important because
   “recommended nutrient ratios" in soil or
     plant tissue are possible even when
  nutrients are deficient or excessively high.

   As we have discussed earlier in the semester, nutrient
 imbalance can be a problem (e.g., competitive ion effects
  and other types of antagonistic nutrient interactions) but
nutrient balance in animal diets is probably more important
than in soil because of the selective abilities of plant roots
Some day soon
     soil testing
   may consist of
on-the-fly “sensing”
 of soil hundreds to
thousands of times
    per acre like a
    yield monitor
http://bse.unl.edu/adamchuk/presentations/
a


http://bse.unl.edu/adamchuk/presentations/
“The Soil Doctor”
The original electrical conductivity/resistivity system
http://bse.unl.edu/adamchuk/presentations/
2.5 acre grid sampling vs.
high density on the fly sensing
http://bse.unl.edu/adamchuk/presentations/
Soil pH and lime requirement often vary
          widely within fields


  Is a high density pH map all you need
     for variable rate lime application?
Variable rate P and
    K is based on false                                      Variable rate is only
     assumptions and
       does not pay. I                                      likely to pay in fields
      only do variable                                      with large variability
      rate lime on my                                           including levels
         farm now.
                                                               above and below
                                                                 critical levels.


   Illinois corn and soybean producer Ken Dalenberg (Mansfield IL) was
  recently named 2010 Farmer of the Year in the PrecisionAg Awards Of
Excellence program. His deliberate approach to honest evaluation has helped
him build relationships with universities and industry… he is frequently involved
in advanced evaluation of equipment for John Deere and other companies. He
   is frequently invited to speak at conferences throughout the U.S. and other
  countries. Ken understands the importance of proper scientific methodology
and is willing to expend the extra efforts and costs to do it right…even though it
                   means delays in getting his farm work done.”
MISS has incorporated EC, NDVI readers and soil testing so that the client can rest
assured that low application amounts prior to planting will not hurt the crop yield. By
   going a step further and taking stalk nitrate tests at those same locations of soil
 testing, the client is able to further define the management map and customize the
                         following nitrogen applications to occur.
Soil testing
Soil testing
Soil testing
Soil testing
Soil testing
Soil testing

Soil testing

  • 1.
    The art andscience of routine soil testing http://www.labsafety.com/search/LaMotte/+-1399/24528163/221700/?isredirect=true
  • 2.
    What is “routine” soil testing ?
  • 3.
    Goals of routinesoil testing Rapid Cheap Predictive Broadly applicable Very different from soil science research
  • 4.
    Routine soil testingstarts with the collection of "representative" soil samples
  • 5.
    How many samples should be collected from each field ? The optimum number of soil samples is a compromise between what should be done (to accurately represent the field) and what can be done (time/cost). 120 acre field
  • 6.
    What is a composite sample? The U of Illinois currently recommends collecting 1 composite sample per 2.5-acres. 120 acre field
  • 7.
    Composite sampling Multiple sub- samples are collected from each management unit and mixed together
  • 8.
    This does notmean that we should all be collecting 20 cores per composite sample but using only 5 cores per composite is a major compromise.
  • 9.
    If we don’tcollect enough sub-samples or collect sub-samples at different depths or times… our soil sampling will lack precision Accuracy vs. precision??
  • 10.
    Lack of precisionin soil sampling = unrepeatable results * * * * How do you know if soil test results are accurate? Inaccurate results => inappropriate fertilizer recommendations
  • 11.
    Grid vs. ZoneSampling "We've been moving in circles for years," says Gyles Randall, soil scientist, University of Minnesota. "Grid sampling was the hottest thing going, but it was expensive. The question was if growers were getting their money's worth. If land is owned or under a long- term rental agreement, I like grid-based sampling, but under a short-term rental basis, you can hardly justify it."
  • 12.
    Matt Duncan, KeyAgricultural Services, Macomb, Ill., is a strong believer in grid sampling. However, it is only one part of the equation. "We found that after multiple soil test cycles using grid sampling based variable rate applications, in many cases highs were getting higher and lows were getting lower," says Duncan. "When we looked at the GPS yield data history, we noticed the crop yields were consistently higher in the field areas with decreasing soil test values and lower in the areas of increasing soil test levels."
  • 13.
    Soil management zones A management zone approach is only possible if knowledge Soil 3 of soil variation is preexisting. Soil Soil 4 1 Knowledge of soil variation: County soil survey maps Soil 2 Old field boundaries Past management records
  • 14.
    How well dosoil survey mapping units relate to crop productivity ? Sometimes very well… other times not so well
  • 15.
    Monitoring change overtime will be much easier if soil samples are collected from the same locations each time the field is sampled. Sampling locations can be identified using GPS equipment or by more traditional methods such as a measuring wheel. The U of Illinois recommends compositing 5 soil cores from within a 10-foot radius to represent each sampling location.
  • 16.
    Important soil samplingconsiderations Avoid sampling areas that are clearly not representative (old manure piles, eroded knolls…) Use clean sampling tools Collect samples from a depth that is appropriate for your soil management system: conventional tillage = 6-8” no-till or lawn = 4” Multiple sampling depths (e.g., 0-2” & 2-8”) is often desirable for long term NT systems
  • 17.
    Nutrient Stratification andNo-till – Is it a problem??
  • 18.
    Late summer andfall are often recommended as the best times for collecting soil samples - the soil samples used for soil test correlation are normally collected in the late summer/fall - potassium test results are most reliable during the late summer/fall - nutrient uptake by summer crops has occurred - soil is more likely to be dry Keep in mind that soil testing labs are normally the busiest in the late summer and fall
  • 19.
    If possible, sampleat ~ the same time every year !
  • 20.
    Many labs willonly accept samples in official sample bags or boxes
  • 21.
    Field moist soilsamples should be delivered to a lab ASAP or dried prior to storage
  • 22.
    Samples should beaccompanied by a submittal form specifying desired analyses and crop and soil management information
  • 23.
    When samples arriveat a high throughput lab, they are entered into a tracking system and then prepped for extraction.
  • 24.
    Sample prep generallyconsists of drying and grinding.
  • 25.
    Small sub-samples ofprepped soils are isolated (normally volumetrically) and then extracted. Extraction is a process of briefly washing a soil. It is not intended to simulate the process of root uptake or remove all available nutrients.
  • 26.
    A variety ofsoil extractants are used by soil testing labs in the Midwest region. Examples of extractants: Bray 1, Olsen, Ammonium acetate, Hot water, DTPA, Mehlich 1, Mehlich 3
  • 27.
    Mehlich 3 extractant most widely used universal extractant The Mehlich 3 extractant was developed by Dr. Adolph Mehlich to estimate plant availability of macronutrients and micronutrients in soils with a wide range of physical and chemical properties. Adopted by the NCDA soil testing lab in 1981, the Mehlich 3 extractant has reduced analytical costs by replacing multiple extraction methods. Reference: Mehlich A. 1984. Mehlich-3 soil test extractant: a modification of Mehlich-2 extractant. Commun Soil Sci Plant Anal 15(12):1409–16. Composition: (0.2N CH3COOH + 0.25N NH4NO3 + 0.013N HNO3 + 0.015N NH4F + 0.001M EDTA) Would this extracting solution be useful for measuring plant available N?
  • 28.
    Ion exchange resins Plant root simulator probes – an alternative method of nutrient extraction
  • 29.
    Traditionally sample extractswere analyzed using different methods for different nutrients but many labs now use sophisticated instruments that can analyze many nutrients simultaneously.
  • 30.
    Most large labsuse an Inductively Coupled Plasma Atomic Emission spectrometer to analyze soil extracts for multiple elements I am an ICP!
  • 31.
    By themselves, extractable nutrientlevels are not informative. Extractable nutrient levels provide an index of nutrient availability that can be interpreted using results from field experiments.
  • 32.
    moisture temperature microbial activity Extractable nutrient levels are not directly related to most of the factors controlling nutrient availability during a growing season. rooting depth root health
  • 33.
    Meaningful interpretation ofsoil test results requires field calibration 100 % yield Field sites are needed that vary widely in soil 50 % test levels of the yield nutrient of interest but have few other limiting factors Soil test P concentration (ppm) http://www.ipm.iastate.edu/ipm/icm/2003/11-17-2003/mehlich3.gif
  • 34.
    Relationship between cropyield and soil test K Response curves are derived from calibration data – response curves do not describe all the variation in calibration data !
  • 35.
    Rates of P2O5or K2O to apply based on soil test index value and crop-specific equation * Soil Test Index Eq. # 0 10 20 30 40 50 60 70 80 90 100 110 120 130 140 150 1 900 780 660 550 460 370 290 220 160 110 70 40 10 0 0 0 2 500 440 380 330 280 230 190 150 120 90 70 40 30 10 0 0 3 300 270 230 200 180 150 130 100 80 70 50 40 20 10 10 0 4 300 260 220 180 150 120 100 70 60 40 30 20 20 20 20 10–30 5 300 250 210 170 130 100 80 50 30 20 0 0 0 0 0 0 6 300 240 190 140 100 60 30 10 0 0 0 0 0 0 0 0 7 250 220 190 160 140 110 90 70 50 40 30 10 0 0 0 0 8 250 210 160 130 90 60 30 10 0 0 0 0 0 0 0 0 9 220 190 160 140 120 100 80 60 50 30 20 10 10 0 0 0 10 200 170 150 120 100 In North Carolina, 25 80 60 50 30 20 10 10 0 0 0 0 11 200 160 120 90 60 40 20 0 0 0 0 0 0 0 0 0 12 180 160 140 130 110 different crop response 90 80 70 50 40 30 20 20 10 0 0 13 165 140 110 90 70 50 30 20 10 0 0 0 0 0 0 0 14 150 120 100 80 60 equations are used to 40 30 10 0 0 0 0 0 0 0 0 15 150 120 90 70 40 30 10 0 0 0 0 0 0 0 0 0 16 150 110 70 40 10 0 make P and K 0 0 0 0 0 0 0 0 0 0 17 18 140 120 120 90 100 60 80 40 70 20 50 0 recommendations 40 0 30 0 20 0 10 0 10 0 0 0 0 0 0 0 0 0 0 0 19 100 80 70 60 40 30 20 10 0 0 0 0 0 0 0 0 20 80 60 40 20 0 0 0 0 0 0 0 0 0 0 0 0 21 20.0 17.0 14.0 11.5 9.5 7.5 5.5 4.0 2.5 1.5 0.5 0 0 0 0 0 22 11.0 9.5 8.0 7.0 6.0 5.0 4.0 3.0 2.5 2.0 1.0 1.0 0.5 0 0 0 23 9.0 7.5 6.5 5.5 4.5 3.5 2.5 2.0 1.5 1.0 0.5 0 0 0 0 0 24 8.0 6.5 5.0 4.0 2.5 2.0 1.0 0 0 0 0 0 0 0 0 0 25 6.5 5.0 4.0 3.0 2.0 1.0 0.5 0 0 0 0 0 0 0 0 0
  • 36.
    Different response equationsare used for different crops
  • 37.
    Results may bereproducible but have limited meaning without local field calibration http://www.lamotte.com/
  • 39.
    20 labs actually29member labsIL 2008 located in in 2008 ISTA Members (alphabetical) A K A&L Great Lakes Laboratories, Inc. Key Agricultural Services Lois K. Parker Dean Wesley 3505 Conestoga Dr. 114 Shady Lane Ft. Wayne, IN 46808 Macomb, IL 61455 Tel: 260-483-4759 Tel: 309-833-1313 Fax: 260-483-5274 Fax: 309-833-3993 Additional member: Julie Bruggner Additional members: Tad Wesley AgriEnergy Resources KSI Laboratory Gary Cambpell David Brummer 21417-1950 E. St. 202 S. Dacey Dr. Princeton, IL 61356 Shelbyville, IL 62565 815-872-7790 Tel: 217-774-2421 815-872-1928 Fax: 217-774-2866 gcampbell@agrienergy.net ksilabdbrummer@consolidated.net Additional member: Ann Berry - aberry@agrienergy.net M M & R Ag Services AgSource Cooperative Services Mick Capouch Steve Peterson 16747 W 200N 106 N. Cecil St., PO Box 7
  • 41.
    Quality Control Members ofISTA are required to participate in a quality control program referred to as the Split Sample Soil Test Comparison Program. In this process, six samples are sent quarterly to all member labs. The labs test the soil and return the raw data to an independent accounting firm. This information is then gathered yearly and used in a Reliability/Repeatability report. A level of proficiency is required to receive a Certificate of Good Standing from ISTA. This certificate is the member's accreditation and is their clients' assurance that the information they receive is reliable, consistent and accurate. Some ISTA member labs also participate in an additional National Proficiency Testing Program (NAPT).
  • 42.
    Good labs includestandard (aka check) samples in every analytical run. This allows them to quickly identify problems.
  • 44.
    Choose a laband stick with it ! Different labs often use different analytical and interpretation methods
  • 45.
    Recommendations Analytical results So what do the numbers mean ???
  • 46.
    Analytical results Recommendations
  • 47.
    Analytical results canbe obtained without recommendations
  • 48.
    Analytical results arecommonly presented as concentrations of extractable nutrients (e.g., ppm or lbs/ac) but are sometimes presented as unit-less index values As a general rule, ppm * 2 = lbs/ac (assuming a plow layer weighs 2 million lbs) As stated earlier, by themselves, extractable nutrient levels are not informative. Extractable nutrient levels provide an index of nutrient availability that can be interpreted using results from field experiments.
  • 49.
    Have any ofyou ever had to run a 40 as part of a try-out for a team? How well does your 40 time predict your ability to play the game?
  • 50.
    Turning analytical resultsinto recommendations - the sufficiency approach Critical levels of extractable nutrients have been identified using field experiments The critical levels identified across the US vary because of differences in soil properties and also because of differences in the interpretation of field experiments
  • 51.
    Turning analytical resultsinto recommendations - the sufficiency approach Critical levels of extractable nutrients have been identified using field experiments The critical levels identified across the US vary because of differences in soil properties and also because of differences in the interpretation of field experiments
  • 52.
    Build and maintenanceapproach Critical Level
  • 53.
    Soil is ablack box !!!! Maintenance applications of fertilizer (i.e., replacing nutrients removed in harvested crops) make sense conceptually **but** do not necessarily make sense economically !
  • 54.
    Regional variation insoil test K http://soilfertility.unl.edu/Materials%20to%20include/2001%20NCR%20potassium_files/image008.g if
  • 55.
    Changes in soiltest results between 2001 and 2005 Some of these trends are a little surprising ! Increased use of conservation tillage may be responsible
  • 56.
  • 58.
    Soil Test K Changebetween 2005 and 2010 % of samples below critical level
  • 59.
    Soil Test P Changebetween 2005 and 2010 % of samples below critical level
  • 61.
    Nutrient balancing concepts Nutrientsinteract in plant and soil systems. Some important nutrient interactions include ammonium- calcium, phosphorus-iron, phosphorus-copper, phosphorus-zinc, and potassium-magnesium-calcium. Some consultants and private labs place great emphasis on “base cation ratios”. Typical target ratios: 65-75% Ca : 10-15% Mg : 2-5% K
  • 62.
    Nutrient interactions andproper nutrient balance should be considered in relation to nutrient supply – i.e. the availability of nutrients in the soil. Nutrient supply is important because “recommended nutrient ratios" in soil or plant tissue are possible even when nutrients are deficient or excessively high. As we have discussed earlier in the semester, nutrient imbalance can be a problem (e.g., competitive ion effects and other types of antagonistic nutrient interactions) but nutrient balance in animal diets is probably more important than in soil because of the selective abilities of plant roots
  • 63.
    Some day soon soil testing may consist of on-the-fly “sensing” of soil hundreds to thousands of times per acre like a yield monitor
  • 64.
  • 65.
  • 66.
    “The Soil Doctor” Theoriginal electrical conductivity/resistivity system
  • 67.
  • 69.
    2.5 acre gridsampling vs. high density on the fly sensing
  • 70.
  • 71.
  • 72.
  • 73.
  • 74.
  • 75.
    Soil pH andlime requirement often vary widely within fields Is a high density pH map all you need for variable rate lime application?
  • 78.
    Variable rate Pand K is based on false Variable rate is only assumptions and does not pay. I likely to pay in fields only do variable with large variability rate lime on my including levels farm now. above and below critical levels. Illinois corn and soybean producer Ken Dalenberg (Mansfield IL) was recently named 2010 Farmer of the Year in the PrecisionAg Awards Of Excellence program. His deliberate approach to honest evaluation has helped him build relationships with universities and industry… he is frequently involved in advanced evaluation of equipment for John Deere and other companies. He is frequently invited to speak at conferences throughout the U.S. and other countries. Ken understands the importance of proper scientific methodology and is willing to expend the extra efforts and costs to do it right…even though it means delays in getting his farm work done.”
  • 81.
    MISS has incorporatedEC, NDVI readers and soil testing so that the client can rest assured that low application amounts prior to planting will not hurt the crop yield. By going a step further and taking stalk nitrate tests at those same locations of soil testing, the client is able to further define the management map and customize the following nitrogen applications to occur.