Download as PDF, PPTX
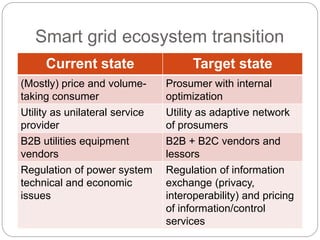
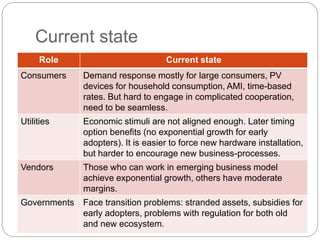
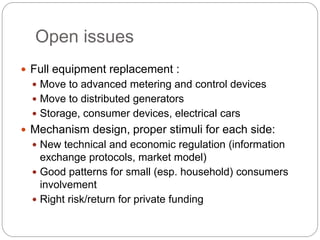
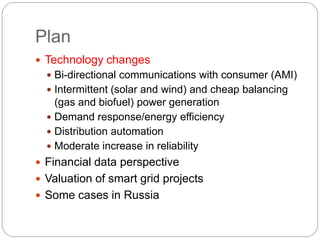
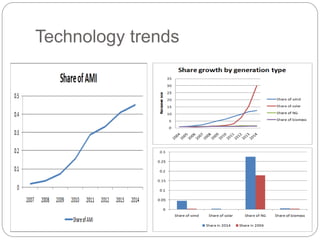
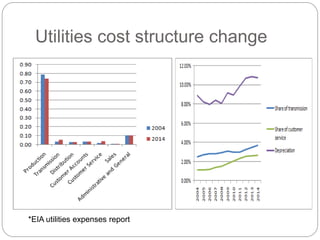
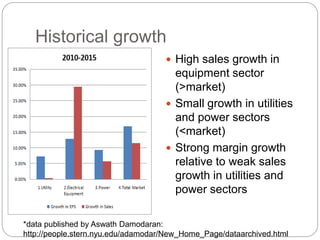
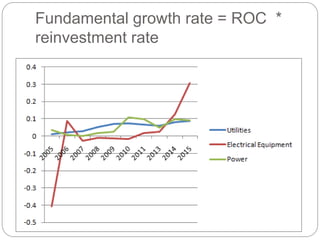
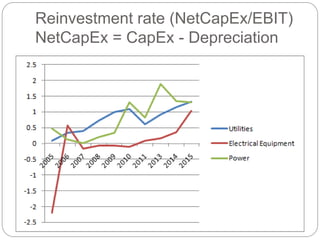
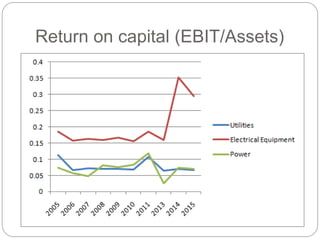
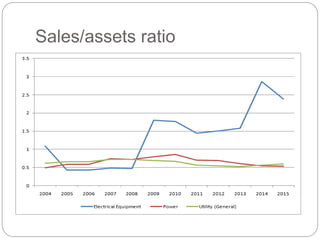
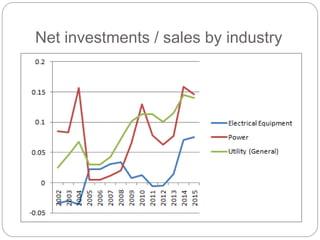
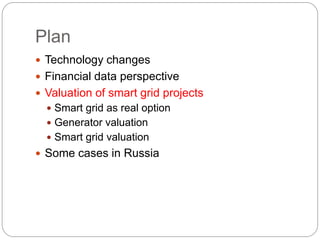
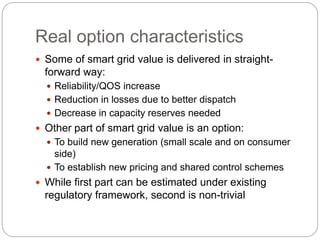

The document summarizes the transition to smart grids, including changes to the roles of consumers, utilities, vendors, and governments. It discusses the current state of smart grid development and open issues remaining, such as fully replacing old equipment and establishing new regulatory frameworks. Technology trends in demand response, distribution automation, and reliability are also reviewed. Financial analysis of utilities includes examining historical growth rates, cost structures, and valuation approaches for smart grid projects using real options theory. Examples of smart grid development in Russia are provided, noting both challenges and opportunities for the transition.