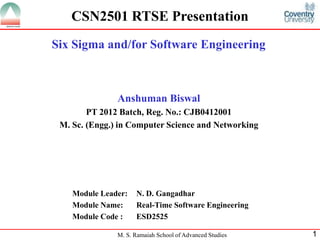
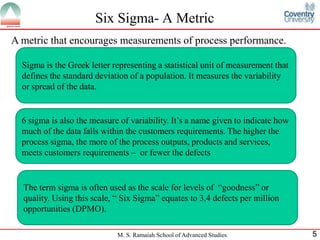
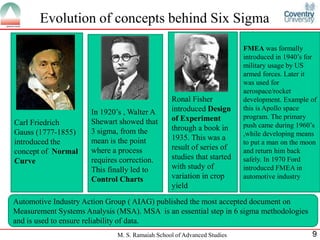
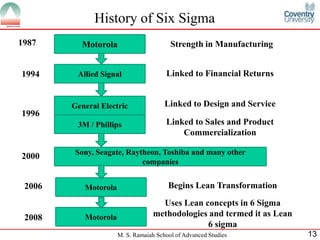
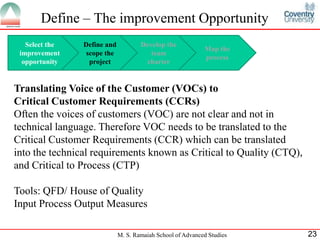
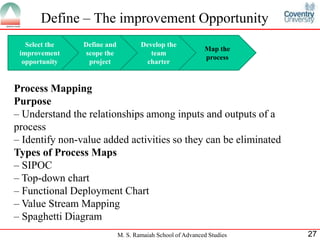
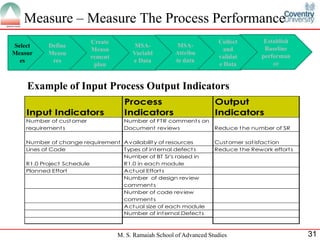
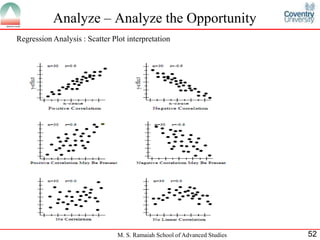
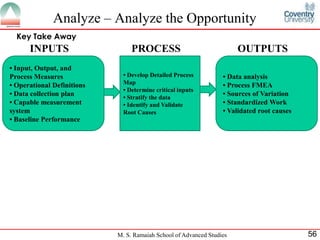
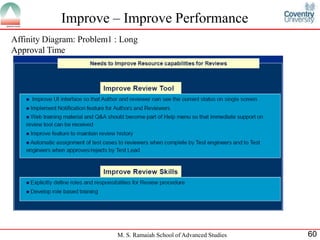
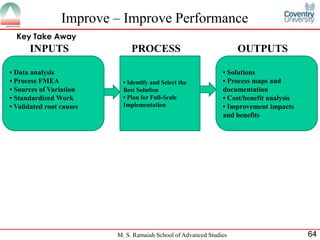
![Sigma level vs. Defect
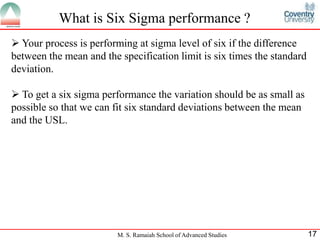
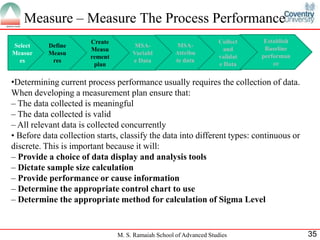
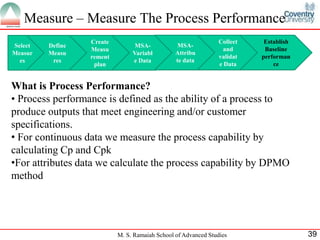
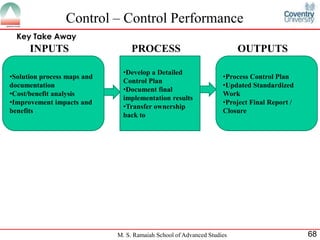
DPMO = [ D ( N * O ) ] * 1 Million Sigma DPMO
2 308770
where: 2.25 226716
– D = total number of defects 2.5 158687
counted in the sample – 2.75 105660
3 66811
a defect is defined as failure to meet 3.25 40060
a Critical Customer 3.5 22750
Requirement or CCR 3.75 12225
– N = number of units of product or 4 6210
4.25 2980
service 4.5 1350
– O = number of opportunities per 4.75 577
unit of product or service for 5 233
5.25 88
a customer defect to occur 5.5 32
– M = million 5.75 11
6 3.4
M. S. Ramaiah School of Advanced Studies 18](https://image.slidesharecdn.com/cjb0412001-rtse-esd2525-presentation-130220052051-phpapp01/85/Six-Sigma-and-For-Software-Engineering-18-320.jpg)

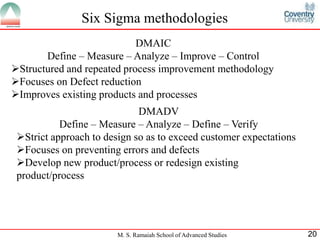
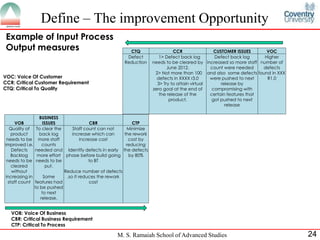
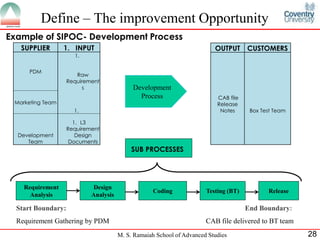
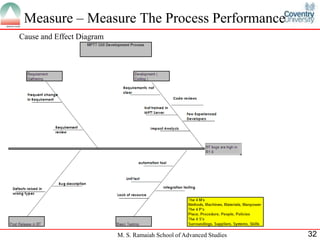
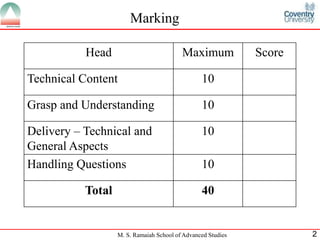
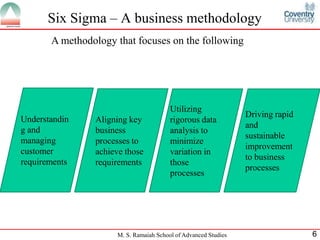
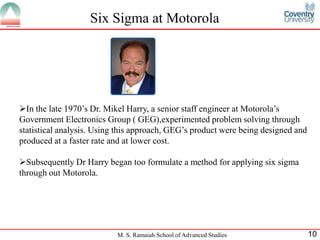
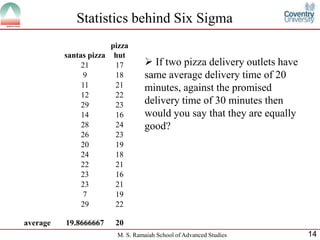
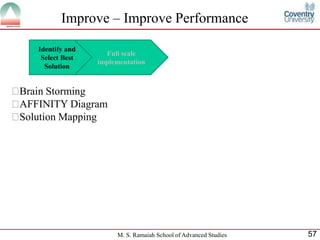
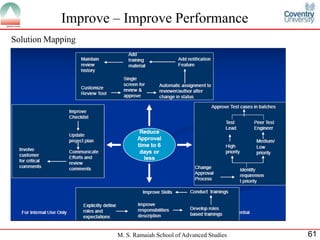
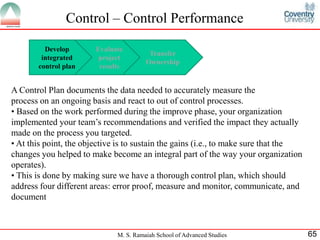
![Measure – Measure The Process Performance
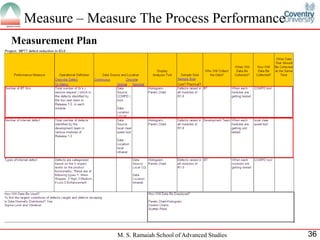
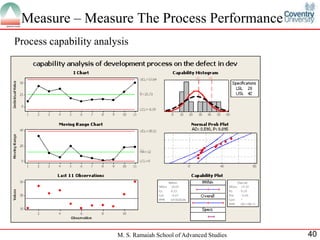
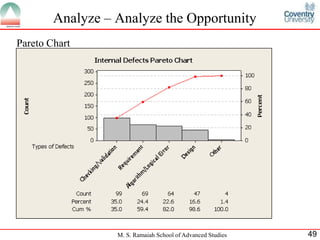
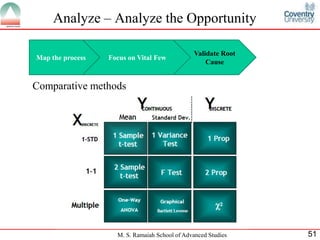
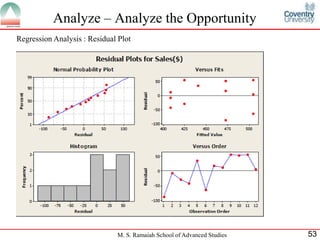
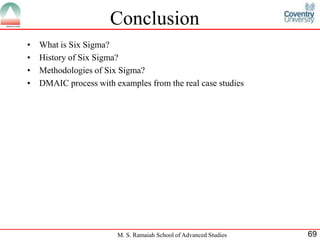
DPMO – For attribute data
Total number Defects- UI D 283
SR’s caught internally in
R1.0 in different phases(
code review, Unit Test,
Design)
Number of Units N 11
processed- Modules
Number of defect O 164
opportunities- Test cases
DPMO = 1M *[D/(N*O)] = 1000000*[283/(11*164)] = 156874
Current Sigma level = 2.51
M. S. Ramaiah School of Advanced Studies 41](https://image.slidesharecdn.com/cjb0412001-rtse-esd2525-presentation-130220052051-phpapp01/85/Six-Sigma-and-For-Software-Engineering-41-320.jpg)
![References
[1] Pyzdek,T., The Six Sigma Hand Book, Revised and
Expanded,New Delhi:McGraw-Hill
[2] CIC2000: Six Sigma Green Belt Training, Motorola
University
[3] Benbow,W.D.,Kubiak,T.M.,The Certified Six Sigma
Blackbelt Handbook,2005,USA,ASQ Quality Press
M. S. Ramaiah School of Advanced Studies 70](https://image.slidesharecdn.com/cjb0412001-rtse-esd2525-presentation-130220052051-phpapp01/85/Six-Sigma-and-For-Software-Engineering-70-320.jpg)

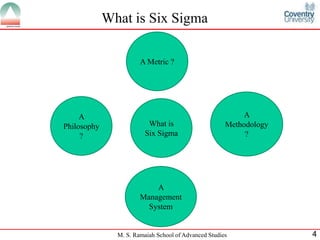
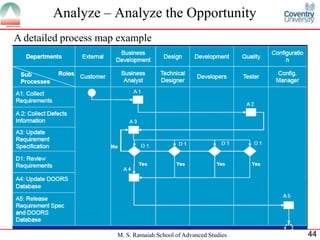
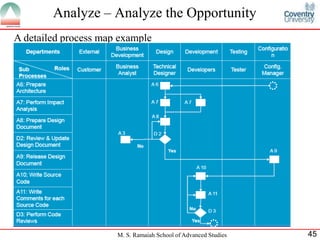
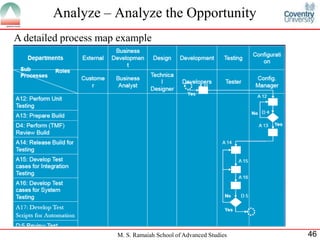
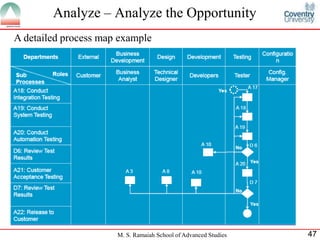
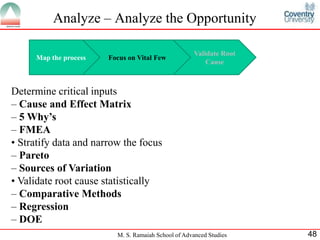
The document presented information on Six Sigma and its application to software engineering. It began with an outline of the topics to be covered, including definitions of Six Sigma, its history and evolution, key statistical concepts, and the DMAIC methodologies. It then discussed Six Sigma as a metric, philosophy, and management system. Specific examples of how Six Sigma was implemented at Motorola in the 1980s-1990s were provided to help drive defect reduction and process improvement through statistical analysis.