Downloaded 37 times

![Page 28
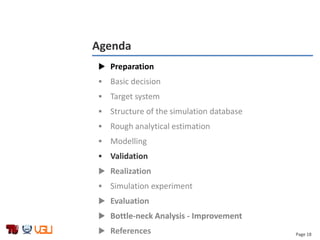
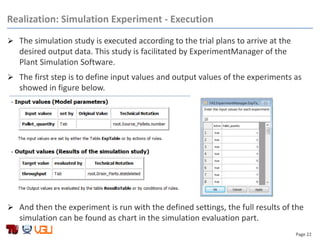
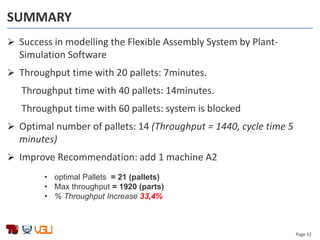
Add one Station A2 :
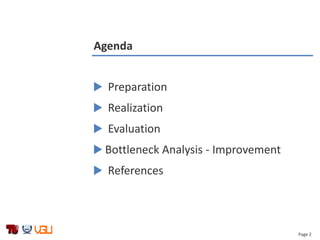
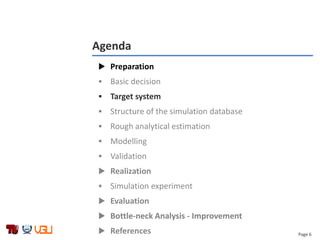
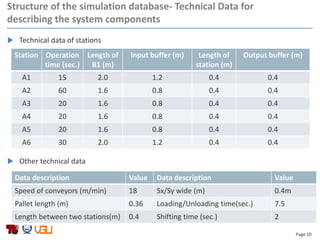
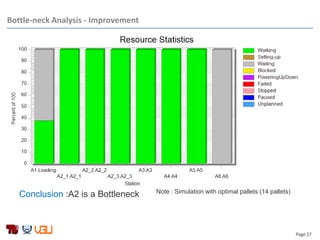
Bottle-neck Analysis – Improvement : Option 1
* Capacity = 2
0
500
1000
1500
2000
2500
0 10 20 30 40 50 60
Thoughput[Parts]
Num of Pallets [Pallets]
4 Station A2
Optimal pallets = 21 pallets
increase 7 Pallets
Thoughput = 1920 parts
Increase 480 parts](https://image.slidesharecdn.com/simulationofflexibleassemblysystemusingtecnomatix-140730034619-phpapp02/85/Simulation-of-flexible-assembly-system-using-tecnomatix-28-320.jpg)
![Page 30
0
500
1000
1500
2000
2500
0 10 20 30 40 50 60 70
Thoughput[Parts]
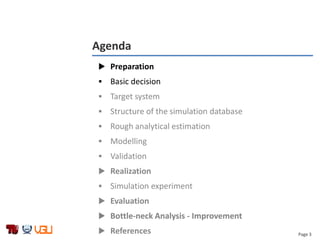
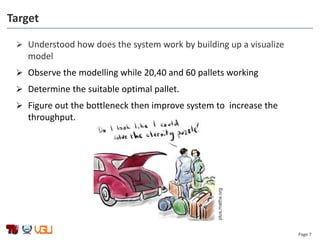
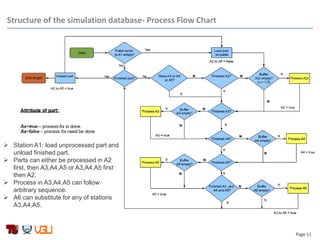
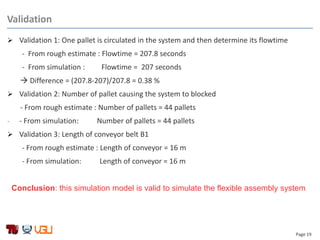
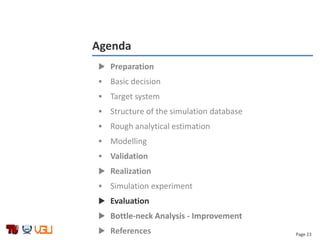
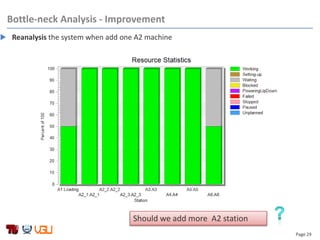
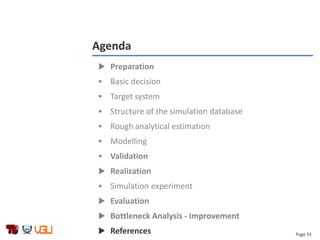
5 Station A2
Add two A2 machines:
Bottle-neck Analysis – Improvement – Option 2
* Capacity = 3
Optimal pallets = 30 pallets
increase 9 Pallets
Thoughput = 2100 parts
Increase 180 parts](https://image.slidesharecdn.com/simulationofflexibleassemblysystemusingtecnomatix-140730034619-phpapp02/85/Simulation-of-flexible-assembly-system-using-tecnomatix-30-320.jpg)
![Page 34
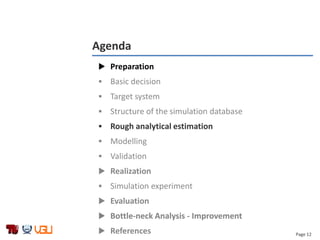
References
[VDI-3633] Association of German Engineers. Simulation of systems in materials
handling, logistics and production: Fundamentals. 2010. Beuth Verlag,
Berlin.
[Book] Walter Terkaj, Tullio Tolio, Anna Valente.Design of Flexible Production
Systems.(2009).
[Book] Steffen Bangsow. Manufacturing Simulation with Plant Simulation
and SimTalk. (2009)
[Self-Guided
Script]
Azrul Azwan Abdul Rahman, Bastian Muller. Tecnomatix Plant
Simulation 11. Version 15.06.2014](https://image.slidesharecdn.com/simulationofflexibleassemblysystemusingtecnomatix-140730034619-phpapp02/85/Simulation-of-flexible-assembly-system-using-tecnomatix-34-320.jpg)

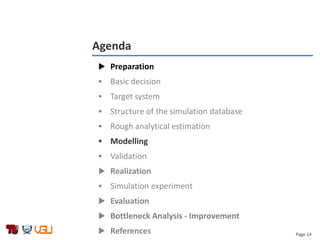
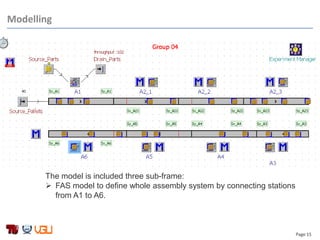
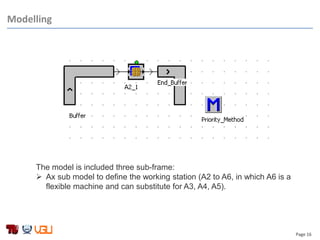
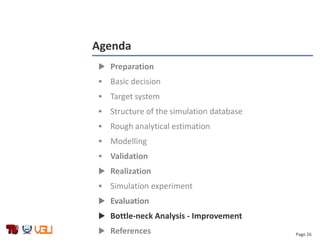
This document summarizes a group project on simulating a flexible assembly system. It includes an agenda, descriptions of the system components and process flow, details on building the simulation model such as the database structure and validation process, and results from running simulation experiments with different numbers of pallets. The evaluation found that 14 pallets provided the optimal throughput and cycle time. A bottleneck analysis identified station A2 as the bottleneck. Two options for improving the system by adding more A2 stations were presented and adding one additional A2 station was recommended.