Download as PDF, PPTX

![Analysis of Transfer Lines
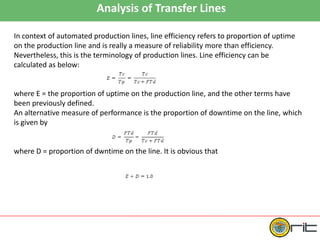
Analysis of Transfer Lines with no Internal Storage
Basic Terminology and Performance Measure
Assumptions
• The workstations perform processing operations such as machining, not
assembly.
• Processing times at each stations are constant, though not necessarily equal.
• Synchronous transfer of lines and
• No internal storage buffers.
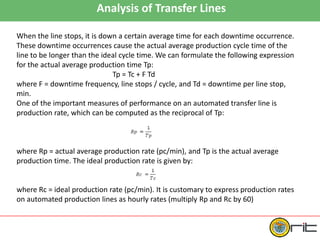
Ideal cycle time Tc of the production line, which is the processing time for slowest
station on the line plus transfer time.
Tc = Max [Tsi] + Tr
where Tc = ideal cycle time in min.
Tsi = the processing time at station i in min, and
Tr = transfer time in min.
We use the Max [Tsi] because the longest processing time establishes the pace of
the production line. Remaining stations with lower processing times must wait for
the slowest station. Therefore, these other stations will experience idle time.](https://image.slidesharecdn.com/aiar-160819080823/85/Aiar-unit-ii-transfer-lines-14-320.jpg)
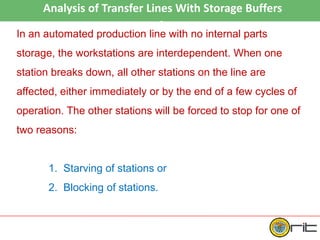
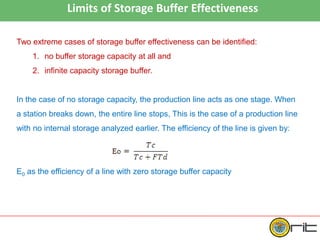
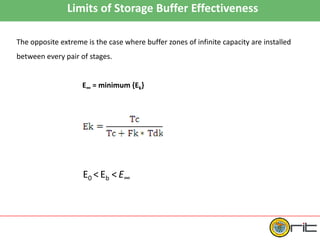

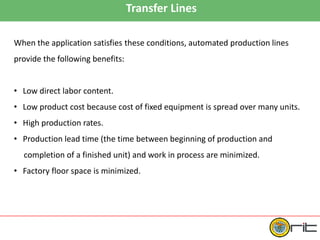
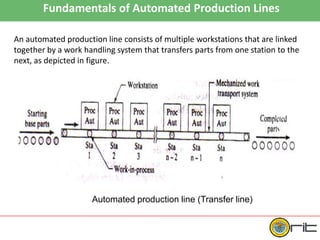
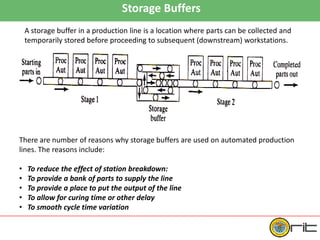
This document discusses automated production lines, also called transfer lines or transfer machines. It provides three key points: 1. Automated production lines consist of multiple linked workstations that perform processing operations like machining on parts. Parts are transferred between stations by a mechanized material handling system. 2. Transfer lines are appropriate for high production demand of parts requiring multiple operations, with stable designs and long product lives. They provide benefits like low labor costs and high production rates. 3. Storage buffers between workstations can reduce the impact of breakdowns and allow production to continue. The effectiveness of buffers depends on their capacity, providing some protection even with small buffers but maximum benefits with unlimited capacity buffers.