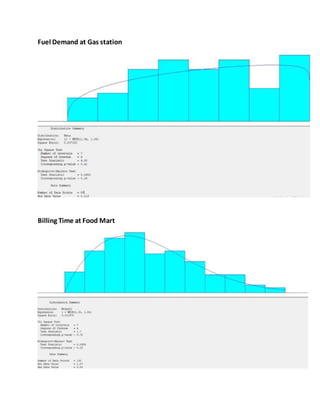
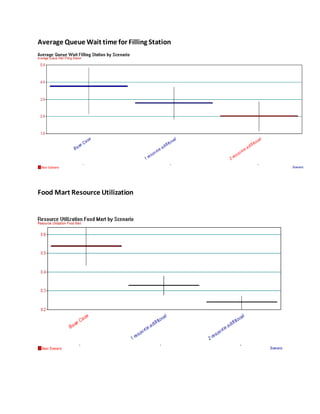
The document describes a simulation of a Shell gas station, convenience store, and air pump located in Cincinnati, Ohio using Arena software. Data was collected on arrival patterns and service times. The simulation models customer flow between the gas station, food mart, and air pump based on probabilistic distributions. Key metrics like customers leaving due to long queues, total revenue, resource utilization, and wait times will be analyzed to identify opportunities to improve the Shell's operations.
Arena simulation for Superette gas station, Vidor, Texas to evaluate the effectiveness of operating the gas station for 24 hours instead of 16 hours and find the optimum number of gas pumps to attain maximum revenue. Data collection, simulation, and analysis led to the conclusion that operating the gas station for 24 hours with 6 gas pumps ultimately having an impact on the maximum profit of $25 per day (16 hours) to $55 per day (24 hours) which was adopted by the gas station.
The document summarizes a simulation study conducted on a restaurant called "Canes" to analyze customer waiting times. The original scenario showed long wait times when customers decided orders at the counter. An alternative scenario assumed customers pre-decided orders. Simulation results showed the alternative scenario significantly reduced average wait time, time in system, and queue length while increasing customers served. It was recommended the restaurant display menus by the queue to help customers pre-decide orders.
The Burger King Fast Food joint at Tangeman University Center is one of the main joints that UC students frequent to grab a quick bite. The store runs from 7 am to 7 pm on weekdays and for reduced hours on weekends. Majority of the business/ influx of students for the joint is observed on weekdays with the peak
hours being 11 am to 3 pm.
The project helped identify bottlenecks observed in the system during peak hours and suggested an alternate resource restructuring with the same man hours. A reduction of 53% in customer wait time was observed in the new solution.
Arena® was chosen as the software to simulate the Burger King setup and identify areas of improvement.
The Project is done as a final project for the course BANA 7030-Simulation Modelling where the focus is in understanding the basics of simulation modelling using Rockwell Automation’s “Arena”.
The goal of the project is to study working of the Shell gas station and food mart at 3337 Clifton Ave, using Arena simulation and increase the resource utilization of the resource or the pumps.
The Shell Petrol gas station is a facility that sells fuel and engine lubricants for motor vehicles. Also, along with gas station there is also a Food Mart which is a located in the same premise as the gas station, which is basically a convenience store.
The model uses the layout, operation and resource allocation of the gas station and the food mart etc in Arena to simulate the real-life scenarios.
Arena Simulation of Chipotle RestaurantRohit Bhaya
The document describes a simulation of a Chipotle Mexican restaurant using Arena simulation software. Data was collected on service times and customer arrivals and fitted to distributions. A base model was created with arrival and service modules. An alternative model was also created with a different queue structure. Both models were analyzed to compare queue lengths and processing times under different arrival scenarios. The goal is to reduce wait times during peak hours to prevent losing customers.
Simulation with Arena (Dental Clinic project)Kimseng Sok
This is a short slide presentation of my assignment in course of System thinking and modeling. I used Arena Simulation software as tool to discover and make improvements in dental clinic service.
This document summarizes a simulation project to optimize the process at a university campus Subway outlet. The current process leads to long wait times during lunch hours. The simulation models the current process and a proposed process with additional resources. Model 2, which adds one employee each to the order counter and billing counter, reduces average wait times and total time in the system based on the simulation results and statistical analysis. Therefore, hiring two new employees is recommended to improve customer experience and satisfaction.
1. The document describes a computer simulation model of the Subway food service location at Wayne State University to minimize customer wait times.
2. The current model shows high wait times, especially at the salad station, but scheduling employees differently reduces wait times significantly.
3. The proposed model schedules two employees each at the bread and salad stations instead of just one, lowering average wait time from 18 minutes to just over 0 minutes.
This document presents a queuing theory analysis of customer wait times at a Burger King location during peak evening hours. Data was collected on customer arrival patterns and service times. The data was fitted to distributions in Arena simulation software. The initial model showed average wait times of over 15 minutes. Proposed solutions like adding a self-serve soda fountain and digital queue displays were modeled and reduced average wait times by 4-10 minutes and decreased the number of customers in the system.
The document describes a simulation model of a Starbucks coffee store using Arena software. The model simulates the customer flow process from arrival to order completion. Key aspects of the model include fitting data to distributions, building the model with modules like create, process, decide, and record, and analyzing results like average time in system and resource utilization. Alternative scenarios adding additional cashier and barista resources showed potential to reduce average time in system from 3.6 to 2.4 minutes. The document concludes recommending adding two resources to improve customer experience while considering associated economic costs.
The simulation model analyzed the operations of a campus Starbucks to evaluate performance and identify ways to decrease wait times. It modeled the customer arrival process, order and payment queue, beverage/snack ordering, and service queue. Increasing the number of servers at the service counter from 2 to 3 was found to most significantly reduce average wait times from 5.79 minutes to 0.036 minutes and the average number waiting from 3.7 to 0.
This project analyses the current scenario- fans arriving at the Nippert Stadium through various lanes. The current scenario has been modeled using Arena and a better case scenario has been developed using the same software.
This document summarizes a simulation study of operations at the Starbucks cafe located in the Steger Student Life Center at the University of Cincinnati. The simulation aimed to identify ways to reduce wait times for customers, which sometimes exceeded 10 minutes. The simulation modeled customer arrivals, order times, food and beverage preparation times, and resource utilization over peak and non-peak hours. Running additional scenarios found that adding a beverage machine could reduce maximum wait time from 19 to 13 minutes, while adding a cashier could reduce average wait time from 2.5 to 2.2 minutes. The study concluded that optimizing food pre-heating and adding a beverage machine could most improve operations.
Simulation for kfc order counter at rajiv gandhi international airport, hyder...Pankaj Gaurav
Objective of the business modelling and simulation project was to determine whether existing system is efficient or there is a scope of reducing the waiting time & idle time at KFC Order Counter at Rajiv Gandhi International Airport, Hyderabad
This document outlines a FlexSim simulation model of an airport security checkpoint. The base model contains one metal detector and x-ray scanner, resulting in average wait times of 80 minutes. An alternative model with two scanners significantly reduces average wait time to 5 minutes while increasing passenger throughput by 67% and luggage throughput by 11%. While the dual scanner model improves performance, the low passenger volume may not justify the increased operating costs compared to the benefits.
An attempt at finding an optimized working model using Arena for a barber shop ameliorating the customer wait time, thus attracting more customers with minimum cost
Simulation of food serving system of EWU canteen using Arena softwareEast West University
This document describes a simulation of a food serving system for a university canteen using Arena. The system has 3 queues: one for ordering/payment and two for food pickup. 5 students arrive per minute on average to order. There is one person each at the ordering and two food delivery counters. The simulation is run for 30 days with 10 replications. The document then describes improvements made where the student arrival rate is increased to 8 per minute and service times at counters are reduced.
Simulation Modeling on Campus Starbucks Coffee CenterNiharika Senecha
Simulation Modeling of Campus Starbucks Coffee Center was done using Arena simulation software in order to reduce the long waiting time and increase the utilization of resources. The results were analyzed and a suggestion (a new and improved simulation model) was also made to improve the system.
Simulation of SM Paints production facility using ARENA simulation software. Making improvements using OptQuest software, and data analysis of current state simulation, to suggest recommendations for achieving desired level of productivity.
Bakery Production Using Arena SimulationSocheat Veng
The document describes a simulation project for JC Bakery. There are three scenarios simulated:
1) The initial model
2) Changing the arrival times of raw materials
3) Changing arrival times and sharing resources between processes
Key performance indicators (KPIs) measured include production output, resource utilization, and processing times. Scenario 2 performed best according to the KPIs by increasing output 32.93 units from 28.31, improving resource utilization, and reducing idle times. Therefore, scenario 2 of changing raw material arrival times is recommended to increase JC Bakery's production output and efficiency.
The document discusses four priority sequencing rules - first come first served, shortest processing time, earliest due date, and critical ratio. It provides examples and calculations to demonstrate how to determine the optimal job sequence using each rule. The goal of the rules is to minimize completion time and lateness while maximizing facility utilization and throughput.
Queueing Theory- Waiting Line Model, Heizer and RenderAi Lun Wu
I HOPE IT IS HELPFUL FOR YOU> BUT PLS IWANT CREDITS> OR ADD ME AND MESSAGE ME THANKS
THERE IS A NOTE FOR PRESENTERS VIEW
HAVE A GOOD DAY
KEEP CALM AND DRINK ON
NAME: Ellen Magalona
GNDR: FML
BRTHDY: FEB. 1998
@ellenmaaee
Bakery Production Using Arena SimulationSocheat Veng
The simulation model of JC Bakery was run for Scenario 1 and Scenario 3 to compare different scenarios. In Scenario 1, the average total processing time for Entity 1 was 154.3 minutes, Entity 2 was 126.34 minutes, and Entity 3 was 161.32 minutes. The utilization of the forming staff was 96.67% and the former packer was 35%. In Scenario 3, the arrival times of entities were changed and the packer resource was shared to help the forming staff. This resulted in changes to the key performance indicators compared to Scenario 1.
method study- micromotion vs memo motionpranav teli
The document discusses method study, which aims to improve work processes and reduce costs. It describes the objectives and typical procedure of method study, which includes selecting a job to study, recording details, examining the method critically, developing an improved method, installing it, and maintaining the new standard. The document also explains micro-motion study and memo-motion study as techniques for recording and analyzing activities in detail or at a macro level to identify unnecessary motions and establish more efficient methods. The key difference is that micro-motion studies operations at a finer level of detail using filmed footage, while memo-motion uses time-lapse photography to study overall processes.
The project is done as final project for the course BANA 7030 where the focus lies on the simulation software called ‘Arena’ developed by Rockwell Software. The main purpose of the project is to prepare a working simulation model of the UDF store on Clifton Ave using the software ‘Arena’. For this model the input will be the inter-arrival time of the customers and service times at each of the counters during rush hours. The model in Arena will give a precise output of the statistical accumulators like total number of entities served, average wait time in the queue, maximum waiting time in queue, average total time in system, maximum total time in system, resource allocation and utilization levels, and efficiency of the processes. Our aim will be to study the statistical accumulators, identify inefficiencies and suggest changes in the model to improve the efficiency. In the scope of the project the customers will be the entities. The model uses the layout of the store, management systems, options of purchase, sequence followed, resources available in Arena simulate real life scenarios. The model was run for 16 hours for a busy day and 10 replications are conducted to validate the result. Certain changes in the model are also introduced and their impact on the performance parameters are also studied to arrive at the optimal solution.
The document describes examples of queueing and inventory simulation models. It provides examples of simulations of the able-baker queueing model, a dental clinic queue, and inventory systems with probabilistic demand and lead times. For each simulation example, it provides the relevant probability distributions and random numbers used to calculate metrics like average wait times and inventory levels.
This document discusses value stream mapping (VSM), which is a lean manufacturing technique used to analyze and design the flow of materials and information required to bring a product to a consumer. The document provides information on the history and purpose of VSM, how and when to conduct VSM, and the steps to create a current state map and future state map. It explains the various symbols used in VSMs and includes examples of VSM icons. Key points covered include identifying bottlenecks, reducing lot sizes and setup times, establishing work cells and scheduling methods, and including areas for future kaizen improvements.
The centroid method for plant location uses which of the following dataramuaa128
For more course tutorials visit
Uophelp is now newtonhelp.com
www.newtonhelp.com
1.
Which of the following is a measure of operations and supply management efficiency used by Wall Street?
Dividend payout ratio
Receivable turnover
Current ratio
Financial leverage
Earnings per share growth
From an operational perspective, yield management is most effective under whi...ramuaa127
For more course tutorials visit
Uophelp is now newtonhelp.com
www.newtonhelp.com
1.
Which of the following is a measure of operations and supply management efficiency used by Wall Street?
Dividend payout ratio
Receivable turnover
Current ratio
Financial leverage
A company must perform a maintenance project consisting of seven activitiesramuaa124
For more course tutorials visit
Uophelp is now newtonhelp.com
www.newtonhelp.com
1.
Which of the following is a measure of operations and supply management efficiency used by Wall Street?
Dividend payout ratio
Receivable turnover
Current ratio
Financial leverage
Earnings per share growth
A company must perform a maintenance project consisting of seven activitiesyearstart1
For more course tutorials visit
Uophelp is now newtonhelp.com
www.newtonhelp.com
1.
Which of the following is a measure of operations and supply management efficiency used by Wall Street?
Dividend payout ratio
Receivable turnover
Current ratio
Financial leverage
Earnings per share growth
Which of the following is a focusing step of drramuaa129
For more course tutorials visit
Uophelp is now newtonhelp.com
www.newtonhelp.com
1.
Which of the following is a measure of operations and supply management efficiency used by Wall Street?
Dividend payout ratio
Receivable turnover
Current ratio
Financial leverage
Earnings per share growth
A simple project listing of five activities and their respective time estimat...yearstart1
For more course tutorials visit
Uophelp is now newtonhelp.com
www.newtonhelp.com
1.
Which of the following is a measure of operations and supply management efficiency used by Wall Street?
Dividend payout ratio
Receivable turnover
Current ratio
Financial leverage
Earnings per share growth
A simple project listing of five activities and their respective time estimat...ramuaa124
For more course tutorials visit
Uophelp is now newtonhelp.com
www.newtonhelp.com
1.
Which of the following is a measure of operations and supply management efficiency used by Wall Street?
Dividend payout ratio
Receivable turnover
Current ratio
Financial leverage
Earnings per share growth
The document provides a guide for an OPS 571 final exam with 30 multiple choice questions covering operations and supply chain management topics such as capacity utilization, activity system maps, production layouts, queuing theory, inventory models, lean principles, critical path method, forecasting techniques, yield management, transaction processing, master production scheduling, and plant location models.
Ops 571 final exam guide (new, 2018) which of the following is a principle of...ramuq12345
For more classes visit
www.snaptutorial.com
1.
Which of the following is a measure of operations and supply management efficiency used by Wall Street?
Dividend payout ratio
Receivable turnover
Current ratio
Financial leverage
Earnings per share growth
Which of the following is a principle of work center schedulingramuaa129
For more course tutorials visit
Uophelp is now newtonhelp.com
www.newtonhelp.com
1.
Which of the following is a measure of operations and supply management efficiency used by Wall Street?
Dividend payout ratio
Receivable turnover
Current ratio
Financial leverage
Earnings per share growth
Which of the following is an input to the master production schedule (mps)ramuaa130
For more course tutorials visit
Uophelp is now newtonhelp.com
www.newtonhelp.com
1.
Which of the following is a measure of operations and supply management efficiency used by Wall Street?
Dividend payout ratio
Receivable turnover
Current ratio
Financial leverage
Earnings per share growth
In hau lee's uncertainty framework to classify supply chainsramuaa127
This document provides a guide to the OPS 571 Final Exam, including 29 multiple choice practice questions covering topics like operations and supply chain management, production processes, inventory management, project management, forecasting, and more. The questions assess understanding of key concepts and tools used in operations, supply chain, and project management.
For more course tutorials visit
Uophelp is now newtonhelp.com
www.newtonhelp.com
1.
Which of the following is a measure of operations and supply management efficiency used by Wall Street?
Dividend payout ratio
Receivable turnover
Current ratio
Financial leverage
Earnings per share growth
Which of the following is considered a primary report in an mrp systemramuaa130
For more course tutorials visit
Uophelp is now newtonhelp.com
www.newtonhelp.com
1.
Which of the following is a measure of operations and supply management efficiency used by Wall Street?
Dividend payout ratio
Receivable turnover
Current ratio
Financial leverage
Earnings per share growth
OPS 571 HELP Expect Success /ops571help.commyrealit
FOR MORE CLASSES VISIT
www.ops571help.com
1. Which of the following is a measure of operations and supply management efficiency used by Wall Street? Dividend payout ratio Receivable turnover Current ratio Financial leverage Earnings per share growth 2. An activity-system map is which of the following? A diagram that shows how a company's strategy is delivered to customers A timeline displaying major planned events A network guide to route airlines A facility layout schematic noting what is done where A listing of activities that make up a project 3. Which of the following is a total measure of productivity? Output/Materials Output/Labor Output/(Labor + Capital + Energy) All of these
In designing a lean production facility layout, a designer should do which of...ramuaa127
For more course tutorials visit
Uophelp is now newtonhelp.com
www.newtonhelp.com
1.
Which of the following is a measure of operations and supply management efficiency used by Wall Street?
Dividend payout ratio
Receivable turnover
Current ratio
Financial leverage
Earnings per share growth
Which of the following is a fixed time-period inventory modelramuaa129
Uophelp is now newtonhelp.com
www.newtonhelp.com
1.
Which of the following is a measure of operations and supply management efficiency used by Wall Street?
Dividend payout ratio
Receivable turnover
Current ratio
Financial leverage
Earnings per share growth
Which of the following is a measure of operations and supply management effic...ramuaa129
For more course tutorials visit
Uophelp is now newtonhelp.com
www.newtonhelp.com
2.
An activity-system map is which of the following?
A diagram that shows how a company's strategy is delivered to customers
A timeline displaying major planned events
A network guide to route airlines
A facility layout schematic noting what is done where
A listing of activities that make up a project
Which of the following is not one of the basic types of forecastingramuaa130
This document provides a guide for an OPS 571 final exam, including 30 multiple choice questions covering operations and supply chain management topics such as forecasting, productivity measurement, production layouts, inventory models, scheduling, and project management. The questions assess understanding of key concepts and ability to apply analytical techniques in operations and supply chain decision making.
Predictably Improve Your B2B Tech Company's Performance by Leveraging DataKiwi Creative
Harness the power of AI-backed reports, benchmarking and data analysis to predict trends and detect anomalies in your marketing efforts.
Peter Caputa, CEO at Databox, reveals how you can discover the strategies and tools to increase your growth rate (and margins!).
From metrics to track to data habits to pick up, enhance your reporting for powerful insights to improve your B2B tech company's marketing.
- - -
This is the webinar recording from the June 2024 HubSpot User Group (HUG) for B2B Technology USA.
Watch the video recording at https://youtu.be/5vjwGfPN9lw
Sign up for future HUG events at https://events.hubspot.com/b2b-technology-usa/
Orchestrating the Future: Navigating Today's Data Workflow Challenges with Ai...Kaxil Naik
Navigating today's data landscape isn't just about managing workflows; it's about strategically propelling your business forward. Apache Airflow has stood out as the benchmark in this arena, driving data orchestration forward since its early days. As we dive into the complexities of our current data-rich environment, where the sheer volume of information and its timely, accurate processing are crucial for AI and ML applications, the role of Airflow has never been more critical.
In my journey as the Senior Engineering Director and a pivotal member of Apache Airflow's Project Management Committee (PMC), I've witnessed Airflow transform data handling, making agility and insight the norm in an ever-evolving digital space. At Astronomer, our collaboration with leading AI & ML teams worldwide has not only tested but also proven Airflow's mettle in delivering data reliably and efficiently—data that now powers not just insights but core business functions.
This session is a deep dive into the essence of Airflow's success. We'll trace its evolution from a budding project to the backbone of data orchestration it is today, constantly adapting to meet the next wave of data challenges, including those brought on by Generative AI. It's this forward-thinking adaptability that keeps Airflow at the forefront of innovation, ready for whatever comes next.
The ever-growing demands of AI and ML applications have ushered in an era where sophisticated data management isn't a luxury—it's a necessity. Airflow's innate flexibility and scalability are what makes it indispensable in managing the intricate workflows of today, especially those involving Large Language Models (LLMs).
This talk isn't just a rundown of Airflow's features; it's about harnessing these capabilities to turn your data workflows into a strategic asset. Together, we'll explore how Airflow remains at the cutting edge of data orchestration, ensuring your organization is not just keeping pace but setting the pace in a data-driven future.
Session in https://budapestdata.hu/2024/04/kaxil-naik-astronomer-io/ | https://dataml24.sessionize.com/session/667627
The Ipsos - AI - Monitor 2024 Report.pdfSocial Samosa
According to Ipsos AI Monitor's 2024 report, 65% Indians said that products and services using AI have profoundly changed their daily life in the past 3-5 years.
4th Modern Marketing Reckoner by MMA Global India & Group M: 60+ experts on W...Social Samosa
The Modern Marketing Reckoner (MMR) is a comprehensive resource packed with POVs from 60+ industry leaders on how AI is transforming the 4 key pillars of marketing – product, place, price and promotions.
Learn SQL from basic queries to Advance queriesmanishkhaire30
Dive into the world of data analysis with our comprehensive guide on mastering SQL! This presentation offers a practical approach to learning SQL, focusing on real-world applications and hands-on practice. Whether you're a beginner or looking to sharpen your skills, this guide provides the tools you need to extract, analyze, and interpret data effectively.
Key Highlights:
Foundations of SQL: Understand the basics of SQL, including data retrieval, filtering, and aggregation.
Advanced Queries: Learn to craft complex queries to uncover deep insights from your data.
Data Trends and Patterns: Discover how to identify and interpret trends and patterns in your datasets.
Practical Examples: Follow step-by-step examples to apply SQL techniques in real-world scenarios.
Actionable Insights: Gain the skills to derive actionable insights that drive informed decision-making.
Join us on this journey to enhance your data analysis capabilities and unlock the full potential of SQL. Perfect for data enthusiasts, analysts, and anyone eager to harness the power of data!
#DataAnalysis #SQL #LearningSQL #DataInsights #DataScience #Analytics
Beyond the Basics of A/B Tests: Highly Innovative Experimentation Tactics You...Aggregage
This webinar will explore cutting-edge, less familiar but powerful experimentation methodologies which address well-known limitations of standard A/B Testing. Designed for data and product leaders, this session aims to inspire the embrace of innovative approaches and provide insights into the frontiers of experimentation!
2. Introduction
The main aim of this project is to simulate the working of Shell located at 3337 Clifton
Ave, Cincinnati, OH 45220. The shell serves as a major service provider for the residents
who live near Clifton. It mainly comprises of a filling station for refueling vehicles, an air
filling station and a Food Mart which houses many items ranging from groceries,
packaged foods to utility items. The simulation process provides us with a real-time
understanding and analysis of the processes involved in the working of the Shell, based
on which recommendations will be provided for efficient utilization of resources and
reducing the Queue Wait time for customers. The simulation model on the Shell in this
report has been completed using Rockwell Automation’s software Arena Version
14.50.00002.
Operational Details
Theshell is operationalfrom6 A.M.to 11 P.M.on all7 daysof theweek. Thevarious
components at the shell are:
GasStation: Therearefilling boothslocated atthe shell, whichthe customers
can use to re-fuel their vehicles. This process is self-service, the customers
can fill up their vehicles on their own make the payment using credit and
debit cards, after which they can leave the system or utilize other services
that are provided.
Air Filling Station: At the Air Filling Station, the customers can fill the vehicles
of their tires according to the air pressurespecified for their vehicles. This is
a free service provided by the station.
Food Mart: The Mart houses many items of utility such as clothes, food
items, an ATM, a coffee machine. The Food Mart is a major source of
revenue. It has two parallel billing desks but no self-check out counters. The
billing desk has resources based on the shifts of the staff. In general, there is
one operational desk from 6 A.M to 11 P.M, two operational desks from11
P.M. to 7 P.M. and one operational desk from 7 P.M to 11 P.M.
3. Data Collection
As a startto the project, I collected inter-arrivaltimes for the various components
in the system, on different hours of the days and on different days of the week in
order to makethe systemas robustas possible. The following statistics were
collected:
Filling StationAttributes
1. Fuel Demand: Itrepresents the quantity of fuel in gallons and differs from
customer to customer.
2. Time taken for Refueling.
3. Time taken for making the payment.
4. Queue Length beyond which the customers prefer to leave.
Food Mart Attributes
1. Parking Time: The time taken by customer to park their vehicles and enter
the mart.
2. Coffee Making Time: One of the heavily utilized resources in the martis the
coffee machine, which can queue up during peak hours.
3. Shopping Time: Time taken by the customer to fetch the items that are to
be bought.
4. Billing Time: The food mart has two parallel desks for billing, which are
operational based on schedules. The Billing Time is the time taken for
making the payment by the customer after the customer is ready for final
checkout.
Air Filling StationAttributes
1. Air Filling Time: The time taken by the customer to fill up the tires, after
which the customer leaves the system.
Model Assumptions
1. There is no break time for the resources.
2. The scheduling rule is Ignore, as in whenever a new customer comes in they
will attend the customer first.
3. Time taken in routes is assumed to be zero.
4. Data Fitting and Distributions
Arrival Rate
The arrival rates follow a non-stationary Poisson distribution with mean
values divided by hourly periods havebeen tabulated below.
Interval AverageNumber of Arrival
6 A.M. to 7 A.M. 9
7 A.M. to 8 A.M. 27
8 A.M. to 9 A.M. 14
9 A.M. to 10 A.M. 23
10 A.M. to 11 A.M. 36
11 A.M. to 12 P.M. 86
12 P.M. to 1 P.M. 126
1 P.M. to 2 P.M. 113
2 P.M. to 3 P.M. 90
3 P.M. to 4 P.M. 54
4 P.M. to 5 P.M. 81
5 P.M. to 6 P.M. 90
6 P.M. to 7 P.M. 99
7 P.M. to 8 P.M. 72
8 P.M. to 9 P.M. 59
9 P.M. to 10 P.M. 32
10 P.M. to 11 P.M. 13
Metrics Measured by the system.
1. Customers Left for all the 16 periods i.e. from6 A.M. to 11. P.M, when the
intervals are divided hourly.
2. Total Customers Left
3. Total Customers who utilized the Air Filling Service.
4. Total Revenue
5. AverageQueue Wait Time for Filling Station (Refueling)
6. Scheduled Utilization for Filling Station
7. Scheduled Utilization for Food Mart
8. AverageQueue Wait time for Food Mart
8. Arena Model for the Shell
The following modules have been incorporated in the model:
1. Car Arrival(Create Module): Itis the create module fromwhere the entities
enter into the system. The create module follows a non-stationary Poisson
Process for its arrival schedules.
2. Air or Fuel or Food (Decide Module): This module splits the entities in the
systemfromwhere60% go to the Filling station for refueling, 35% go
towards the Food Mart, and 5% for Air filling.
3. Buy Fuel (Decide Module): When entities enter this decide module, they
observethe queue length, if it is greater than 6 they decide to leave the
system. As it was observed during peak hour times people leave the
system, if the queue is too long.
9. 4. Customers Left by Periods (Record Module): This module counts the
number of customers that have left the systemfor various time intervals
and records them into a set.
5. Customers Left (Record Module): This record module counts the total
number of customers who haveleft the systemfor all periods.
6. Car Leaves 1 (DisposeModule): The entities which haveleft the systemexit
at this point.
7. Demand Assign (Assign Module): This assigns a demand to the entities for
their refueling needs according to this distribution 11 * BETA(1.34, 1.06).
According to this distribution an attribute of demand is assigned to each
entity.
8. Filling Time (Process Module): This is a Seize Delay Release Module which
has the capacity of 8 parallel filling booths. The time taken by the entities
for refueling and billing is calculated as Demand*1.6 + UNIF(1,2) .
10. 9. Revenue Count (Assign Module): This module calculates the total revenue
generated fromthe filling station and increments the Total Revenue
variable after entities are done with the refueling and billing. This helps in
determining the total revenue at the end of the cycle of run.
10. Need Air Refill (Decide Module): This splits the entities after they are done
with the refueling process, where60% decideto refill their tires and 40% of
the entities exit the systemafter this. We haveincorporated two entries to
the air filling station, as the entities might chooseto come to Shell justfor
Air Filling or they might choose to refill their tires after the refueling
process.
11. Air Station (Process Module): This is a seizedelay release module where
two resources arein parallel. The filling time taken by the entities is given
by the distribution TRIA (1.49, 2.19, 4).
12. Total Air Refill (Record Module): This module calculates the total number
of entities that have used air filling service. Itmakes sense to incorporate
this module as it gives a clearer picture of how many people are using the
free resource, if they are not utilizing it, it doesn’t makesense to include
the free servicewhich might not increasethe customer satisfaction and be
a sourceof additional maintenance for the management.
13. Parking (Delay Block): This block incorporates the parking of the Shell into
the design, the entities entering the system and deciding to enter the food
mart will park their cars. Italso provides the feature of providing the
storageto help the animation for the delay caused in the parking. The
parking delay follows a UNIF (1,3) distribution.
11. 14. Assign Entity Picture (Assign Module): This module assigns a picture of a
person to the entities, to show up in the animation that the person has
parked his car and is now entering the food mart.
15. Coffee or Other Food Items (DecideModule): The food mart provides a
variety of services but one of the most heavily utilized is the coffee
machine, this decide module splits the entities fromwhereon 40% of the
entities decide to get a coffee and 60% decide to shop for other items such
as groceries and food items.
16. Coffee Machine (Process Module): This is a Seize Delay Module, where we
have a single resourcerepresenting the coffee machine. The time taken by
entities follows the distribution 3 * BETA(1.49, 1.23).
17. Food Shopping (Delay Block): This block represents that people are
shopping for food items. The Time taken follows the distribution 1 + WEIB
(2.08, 1.8).
18. Billing Process (Process Block): This SeizeDelay Release Module has two
resources working in parallel which represents the billing counters at the
mart. The time taken for billing follows the distribution 1 + WEIB(1.31,
1.81). Thestaffing at the billing desk is based on schedule, where1 person
is assigned from6 A.M. to 11 A.M., 2 resources from11 A.M. to 7 P.M. and
1 resourcethereafter.
19. Parking 2 (Delay Block): This represents the point whereentities exit the
food mart and go towards parking, fromwherethey can drive themselves
out of the system. The time taken in the process follows the distribution
UNIF(1,3).
20. Assign Entity Picture2 (Assign Module): This module changes the picture of
the person to the picture of a car in the animation.
21. Car Leaves2 (Disposemodule): The entities exit the systemat this point
after they are done with their respective processes in the system.
13. Statistical Analysis
As the main objective of simulating the working of the shell is to study how we
can make the functioning better based on the scheduling of the resources for
proper utilization, lesser number of people leaving the systemdue to queue
length and lessen the queue wait time. We first decide on the number of
replications needed that will reduce the half-width of these estimates and provide
us with a more accurate and precisevalue.
Hence, Initially I ran 10 number of replications to get an estimate of the half width
which later on can be used to get the number of replications that would be
required for the desired half width. The length of each replication is 17 hours.
Metric AverageValue 95% Half Width Relative Precision
Customers Left 125.80 18.38 0.146
Total Air Refill 360.70 13.42 0.037
Revenue 7776.30 131.38 0.016
AverageQueue
Wait Time Filling
Station
3.7648 0.16 0.042
AverageQueue
Wait Time Food
Mart
1.1739 0.43 0.367
Scheduled
Utilization Filling
Station
0.6462 0.01 0.015
Scheduled
Utilization Food
Mart
0.4865 0.02 0.041
Since the Relative Precision of AverageQueue Wait Time for Food Mart is the
highest we will make number of replications based on it. The desired Half width is
0.05 for this we will implement this formula to calculate the number of
replications. N = N0 * H0
2
/ H2
. Hence the desired number of replications come out
to be 740.
14. The new average values, respectivehalf-width and relative precision are:
Metric AverageValue 95% Half Width Relative Precision
Customers Left 116.66 <1.48 -
Total Air Refill 363.12 <1.14 -
Revenue 7855.79 21.23 0.0027
AverageQueue
Wait Time Filling
Station
3.6137 0.03 0.0083
AverageQueue
Wait Time Food
Mart
1.3674 0.06 0.043
Scheduled
Utilization Filling
Station
0.6404 0.00 -
Scheduled
Utilization Food
Mart
0.4948 0.00 -
15. Alternate Scenarios
Case 1:
Base Case – Number of Resources at Filling Station is 8 and number of resources
at Food Mart is 1 from6 A.M. to 11 A.M., 2 from11 A.M. to 7 P.M., 1 from7 P.M.
to 11 P.M.
Case 2:
1st
Alternate Case – Number of Resources at Filling Station is 9 and number of
resources atFood Mart is 2 from6 A.M. to 11 A.M., 3 from11 A.M. to 7 P.M., 2
from7 P.M. to 11 P.M.
Case 3:
Base Case – Number of Resources at Filling Station is 10 and number of resources
at Food Mart is 3 from6 A.M. to 11 A.M., 4 from11 A.M. to 7 P.M., 3 from7 P.M.
to 11 P.M.
Using Process Analyzer, wecomparethese scenarios entering the relevant
controls and responses to study which case is the best in terms of Queue Wait
and Utilizations.
16. Box and Whisker Plots for the outputs
Customers Left
Filling StationResourceUtilization
17. Average Queue Wait time for Filling Station
Food Mart Resource Utilization
18. Average Queue Wait time for Food Mart
Customers Left Divided by hourly Period Base Configuration
20. Conclusion
After running the models in PAN, a comparison between the models yields that as
we increasethe number of resources at the Filling Station and Food Mart, our
Queue wait time decreases drastically along with the resourceutilization as well.
The customers who leave the filling station due to Queue length havealso
decreased, the decreaseis paramountwhen weadd one additional resourceand
thereafter seems to get stable after we employ more people. Based on these
factors, I would recommend the 2nd
modelbeing a better configuration compared
to the basecase as the decrease in AverageQueue Wait Time is significant by just
hiring one more resourceat the Food Mart and Filling Station. The customers that
leave the systemdue to Queue Length can be considerably reduced this way and
will provide an additional sourceof revenuefor the system. A comparison
between the customers leaving the systemdivided by periods provides us with a
deeper understanding, wherewe see that the number of entities exiting the
systemdue to the busy queue has reduced drastically.