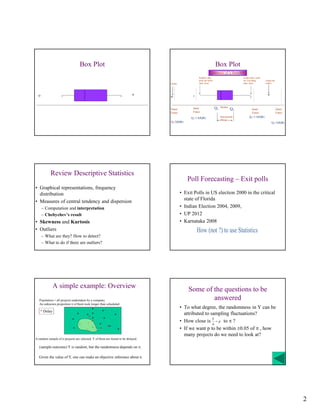
Measures of Dispersion                              Variance and the standard deviation
  •    Concept and objective                                      Variance is the average squared deviation from the mean
  •    Range, inter-quartile range (IQR =Q3 – Q1)
  •    Variance and standard deviation (sd)                                 1    N

  •    Computation
                                                                   σ2 =
                                                                            N
                                                                                ∑(X
                                                                                i =1
                                                                                        i   − µ )2
                                                                                                          x    x                x       x
  •    Chebyshev’s Inequality                                                                             X1   Xi    µ          X2      XN
  •    Relative dispersion -- the coefficient of
                                                                       σ, the standard deviation is the (+ve) square root of the variance
       variation
                                                                  In the sample variance calculation, use the denominator (n-1)
                           σ
                  C.V. =     × 100%
                           µ                                                     1 n
                                                                        S2 =         ∑ ( X i − X )2
                                                                               n − 1 i =1


            Chebyshev’s Inequality
                                                                          Chebyshev’s Inequality:
      • At least (1 - 1/k2) proportion of the data must be
        within k standard deviation of the mean.                               Illustration
      • Here k is a number (not necessarily an integer)
        greater than 1.
      • The statement is valid for ANY distribution,
        discrete or continuous, symmetric or otherwise.
      • If a r.v. X has a mean µ and a standard deviation σ
      then a equivalent probability statement is :
                                                                µ-3σ         µ-2σ       µ-σ           µ    µ+σ           µ+2σ        µ+3σ
                                           1
             P [ | X − µ | > kσ ] ≤                                                            At least 75%
                                           k2
                                                                                       At least 88.89%


       Understanding Standard deviation
                                                                    The Coefficient of Variation:
294 MLA of WB has an average wealth of 68 Lakh                     A measure of relative dispersion
and s.d. = 10 Lakh. What does that tell you?                                                   σ    S
                                                                                                 or                 × 100 %
  In particular, what can you say about % of MLAs                                              µ    X
    having wealth                                             • Unit free
  • between 58L and 78L ?                                     • Amenable to comparison
                                                              • Often expressed in terms of percentages
  • between 53L and 83L ?
  • Less than 53 L or more than 83L?
  • between 50L and 1 crore ?
  • More than 1 crore?


                                                                                                                                             1
Box Plot                                                                           Box Plot
                                                                                                                Elements of a Box Plot
                                                                                                     Smallest data                          Largest data point
                                                                                                     point not below                        not exceeding        Suspected
                                                                                 Outlier             inner fence                            inner fence          outlier


  o                X                                                 X    *      o               X                                                 X
                                                                                                                                                                  *


                                                                                                 Inner                 Q1   Median
                                                                                 Outer                                               Q3             Inner                    Outer
                                                                                 Fence           Fence                                              Fence                    Fence
                                                                                                Q1-1.5(IQR)                 Interquartile         Q3+1.5(IQR)
                                                                                                                             Range
                                                                                 Q1-3(IQR)                                                                            Q3+3(IQR)


           Review Descriptive Statistics
                                                                                              Poll Forecasting – Exit polls
• Graphical representations, frequency
  distribution                                                                             • Exit Polls in US election 2000 in the critical
                                                                                             state of Florida
• Measures of central tendency and dispersion
      – Computation and interpretation                                                     • Indian Election 2004, 2009,
      – Chebychev’s result                                                                 • UP 2012
• Skewness and Kurtosis                                                                    • Karnataka 2008
• Outliers
      – What are they? How to detect?
      – What to do if there are outliers?


             A simple example: Overview                                                        Some of the questions to be
  Population = all projects undertaken by a company                                                    answered
  An unknown proportion π of them took longer than scheduled
                                          *                                                • To what degree, the randomness in Y can be
   * Delay                                         *
                                *      ** *                  *                               attributed to sampling fluctuations?
                                          *         *
                            *
                                        * *
                                                                                           • How close is Y = p to π ?
                                 *              *                                                           n
                                                        **
                            *          * *      *                *                         • If we want p to be within ±0.05 of π , how
                                                                                             many projects do we need to look at?
A random sample of n projects are selected. Y of them are found to be delayed.

  (sample outcome) Y is random, but the randomness depends on π.

  Given the value of Y, one can make an objective inference about π.


                                                                                                                                                                                     2
Myth and Mystery of Probability
                                                        Overview of Probability
• What is chance of getting any rain today in   • Approaches for defining probability
  the campus?
• What is the probability that India will win   • Basic Probability rules
  WC2015?
• What is the chance that India’s space         • Conditional probability and notion of
  mission will send a human being to moon         independence
  by 2020?

                                                • Bayes’ rule


      Approaches for defining
                                                              Probability Laws
           probability
• Classical approach                            •   0 ≤ P[A] ≤1;
                                                •   P[impossible event]=0; P[Sure event]=1
• (Asymptotic) Relative frequency approach      •   P[A or B] = P[A] + P[B] - P[AB]
                                                •   In particular, P[not A] = 1- P[A]
• Subjective probability                        •   Look at the Venn diagram and write down
                                                    other formulae like
                                                       • P[A] = P[A and B] + P[A and (not B)]


                                                                                                3

Session 2

  • 1.
    Measures of Dispersion Variance and the standard deviation • Concept and objective Variance is the average squared deviation from the mean • Range, inter-quartile range (IQR =Q3 – Q1) • Variance and standard deviation (sd) 1 N • Computation σ2 = N ∑(X i =1 i − µ )2 x x x x • Chebyshev’s Inequality X1 Xi µ X2 XN • Relative dispersion -- the coefficient of σ, the standard deviation is the (+ve) square root of the variance variation In the sample variance calculation, use the denominator (n-1) σ C.V. = × 100% µ 1 n S2 = ∑ ( X i − X )2 n − 1 i =1 Chebyshev’s Inequality Chebyshev’s Inequality: • At least (1 - 1/k2) proportion of the data must be within k standard deviation of the mean. Illustration • Here k is a number (not necessarily an integer) greater than 1. • The statement is valid for ANY distribution, discrete or continuous, symmetric or otherwise. • If a r.v. X has a mean µ and a standard deviation σ then a equivalent probability statement is : µ-3σ µ-2σ µ-σ µ µ+σ µ+2σ µ+3σ 1 P [ | X − µ | > kσ ] ≤ At least 75% k2 At least 88.89% Understanding Standard deviation The Coefficient of Variation: 294 MLA of WB has an average wealth of 68 Lakh A measure of relative dispersion and s.d. = 10 Lakh. What does that tell you? σ S or × 100 % In particular, what can you say about % of MLAs µ X having wealth • Unit free • between 58L and 78L ? • Amenable to comparison • Often expressed in terms of percentages • between 53L and 83L ? • Less than 53 L or more than 83L? • between 50L and 1 crore ? • More than 1 crore? 1
  • 2.
    Box Plot Box Plot Elements of a Box Plot Smallest data Largest data point point not below not exceeding Suspected Outlier inner fence inner fence outlier o X X * o X X * Inner Q1 Median Outer Q3 Inner Outer Fence Fence Fence Fence Q1-1.5(IQR) Interquartile Q3+1.5(IQR) Range Q1-3(IQR) Q3+3(IQR) Review Descriptive Statistics Poll Forecasting – Exit polls • Graphical representations, frequency distribution • Exit Polls in US election 2000 in the critical state of Florida • Measures of central tendency and dispersion – Computation and interpretation • Indian Election 2004, 2009, – Chebychev’s result • UP 2012 • Skewness and Kurtosis • Karnataka 2008 • Outliers – What are they? How to detect? – What to do if there are outliers? A simple example: Overview Some of the questions to be Population = all projects undertaken by a company answered An unknown proportion π of them took longer than scheduled * • To what degree, the randomness in Y can be * Delay * * ** * * attributed to sampling fluctuations? * * * * * • How close is Y = p to π ? * * n ** * * * * * • If we want p to be within ±0.05 of π , how many projects do we need to look at? A random sample of n projects are selected. Y of them are found to be delayed. (sample outcome) Y is random, but the randomness depends on π. Given the value of Y, one can make an objective inference about π. 2
  • 3.
    Myth and Mysteryof Probability Overview of Probability • What is chance of getting any rain today in • Approaches for defining probability the campus? • What is the probability that India will win • Basic Probability rules WC2015? • What is the chance that India’s space • Conditional probability and notion of mission will send a human being to moon independence by 2020? • Bayes’ rule Approaches for defining Probability Laws probability • Classical approach • 0 ≤ P[A] ≤1; • P[impossible event]=0; P[Sure event]=1 • (Asymptotic) Relative frequency approach • P[A or B] = P[A] + P[B] - P[AB] • In particular, P[not A] = 1- P[A] • Subjective probability • Look at the Venn diagram and write down other formulae like • P[A] = P[A and B] + P[A and (not B)] 3