This document provides information about a Business Statistics course including objectives, policies, assessment details, topics, assignments, and formulas. The course aims to teach students how and when to apply statistical techniques to decision making. It will have 57 lectures, 2 class tests, 2 hourly tests, and 3 assignments. Internal assessment will be based on a mid-semester exam, presentation, tests, assignments. Topics will cover data collection, distributions, central tendency measures, dispersion measures, and correlation. Students will complete activities collecting and analyzing preference data, and presenting organizational sales and production data. Formulas taught will include measures of central tendency, dispersion, correlation, and error.

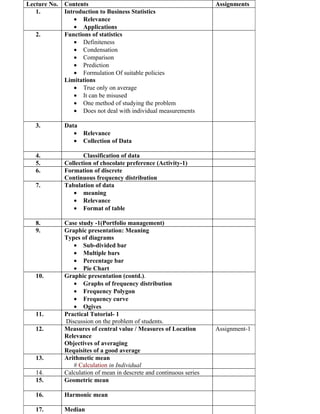
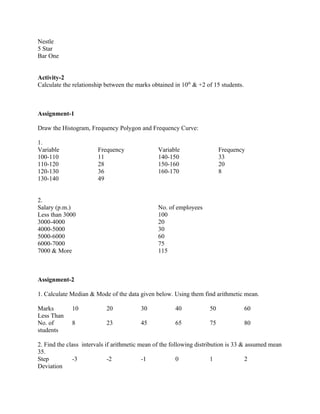
![Short Cut Method/ Indirect Method A.M.= A+ΣFdx/ΣF
Step-deviation Method A.M.=A+ΣFdx'/ΣF*i
Geometric Mean G.M.=√ab
Harmonic Mean
In Individual Series N/Σ(1/X)
In Discrete & Continuous series N/Σ(f*1/X)
Median
In Individual & Discrete Series M=N+1/2, (Nth term+N+1/2)/2
Continuous series N1=N/2, M=L+ N1-CF/F*i
Mode
In Individual Series Maximum repeated term
In Discrete & Continuous series Groupung Table & Analysis Table, M=
L+D1/(D1+D2)*i
Quartiles
In Individual & Discrete Series Q1=N+1/4, Q2=2(N+1)/4, Q3=3(N+1)/4
Continuous series N1=N/4, Q1=L+(N1-
C.F.)/F*i,N1=3N/4,Q3=L+(N1-C.F.)/F*i
Decile N1=N/10, D1=L+(N1-
C.F.)/F*i,N1=9N/10,D9=L+(N1-C.F.)/F*i
Percentile N1=10(N/100), P10=L+(N1-
C.F.)/F*i,N1=90N/100,P90=L+(N1-C.F.)/
F*i
Measures of dispersion
Range Highest Value-Lowest Value
Quartile Deviation Q3-Q1/2
Coeffcient of quartile deviation Q3-Q1/Q3+Q1
Mean Deviation
In Individual Series Σ[X-A.M.]/N
In Discrete & Continuous series ΣF[X-A.M.]/N
Coefficient Of Mean Deviation M.D./A.M.or M or Z
Standard Deviation
In Individual Series √Σd²/N-(Σd/N)2
In Discrete & Continuous series √Σfd²/N-(Σfd/N)2
Coefficient Of Standard Deviation S.D./A.M.
Variance S.D.²
Coefficient of variation S.D./A.M.*100
Coefficient Of Correlation
Karl Pearson r=NΣXY-(ΣX.ΣY)/√(NΣX²-
{ΣX}²).√(NΣY²-{ΣY}²)](https://image.slidesharecdn.com/modulestats-100827014720-phpapp01/85/Module-stats-7-320.jpg)
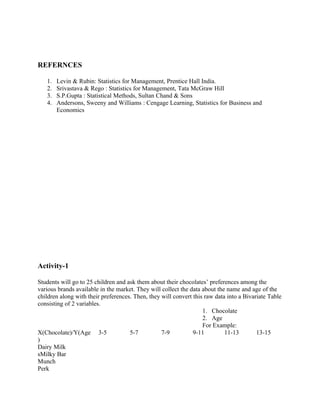
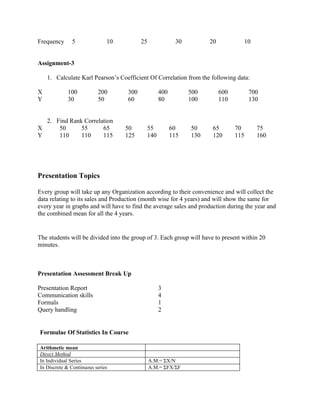
![Spearman 1-6ΣD²/N³-N When ranks are not
repeated
1-6[ΣD²+1/12{m³-m}]/N³-N, When ranks
are repeated
Concurrent deviation C √n (2C-n/n)
Standard Error 1-r²/√N
Probable Error 0.6745 (1-r²/√N)](https://image.slidesharecdn.com/modulestats-100827014720-phpapp01/85/Module-stats-8-320.jpg)


