Download as PDF, PPTX

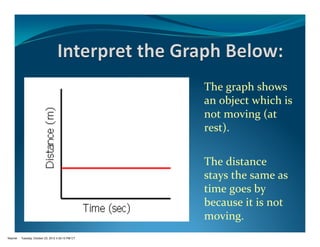
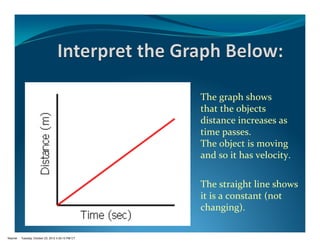
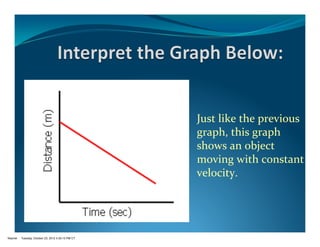
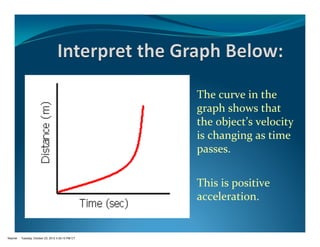
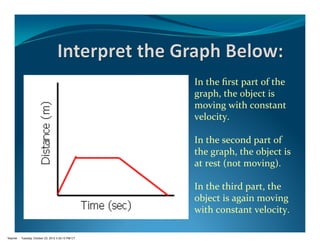

The document contains graphs showing the relationship between distance and time for objects that are moving at constant velocity, accelerating, and at rest. The first graph shows an object at rest with an unchanging distance over time. The second graph depicts constant velocity with a straight line indicating a consistent increase in distance as time passes. The third graph illustrates acceleration as revealed by a curved line, showing that the object's velocity is changing as time increases.