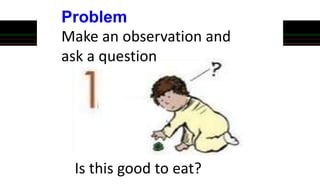
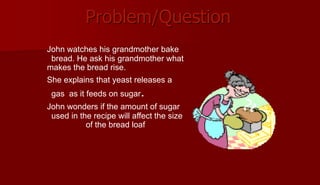
1. John observes his grandmother baking bread and wonders if the amount of sugar used affects the size of the finished loaf.
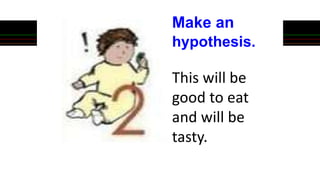
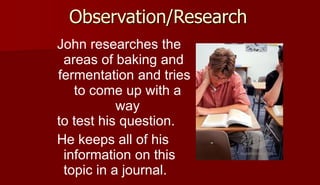
2. He researches baking and fermentation to design an experiment testing his question. He keeps notes on this topic in a journal.
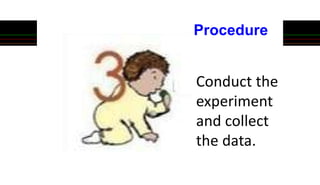
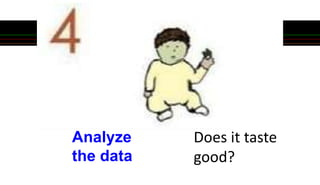
3. John will conduct an experiment varying the amount of sugar in bread recipes to determine if it impacts the loaf size, applying the scientific method to systematically answer his question.
1. OBJECTIVES
K- IDENTIFY THE DIFFERENT SCIENTIFIC
PROCESS SKILLS
- IDENTIFY THE PARTS OF A SCIENTIFIC
INVESTIGATION
S- APPLY THE SCIENTIFIC METHOD AND THE SCIENCE
PROCESS SKILLS
A- RECOGNIZE THE IMPORTANCE OF CONDUCTING A
SCIENTIFIC INVESTIGATION.
2.
3. THE PROCESS OF DOING SCIENCE
THESE SKILLS MAKE IT POSSIBLE TO
HAVE QUESTIONS ANSWERED AND
PROBLEMS SOLVED.
11. A statement or an explanation of what
one has observed. They are intelligent
guesses.
12. Observation: The plant is planted
inside the bottle.
Inferences:
1.The plant’s leaves will turn
yellow, and eventually, it will die.
2. The plant will grow healthy.
13. Measuring
Expressing the amount of an object in
quantitative terms, or comparing an
object to a standard…
Length in Meters
Volume in Liters
Mass in Grams
Force in Newtons
Temperature in Degrees Celsius
14. A temporary explanation for an
observation that has to be tested.
“If .....then....” statement
15. Observation: The plant is planted inside the
bottle.
Inferences: 1.The plant’s leaves will turn yellow,
and eventually, it will die.
2. The plant will grow healthy.
Hypotheses: 1. If plant is planted inside
the bottle, the plant’s leaves will turn
yellow and will die eventually.
2. If plant is planted inside the bottle, the
plant will grow healthy.
17. Variables – any factor that can affect
the end result of an experiment.
18.
19. 1. Controlled Variable – the factorthat
are the same
2. INDEPENDENT Variable – the factor that
has to be tested
3. DEPENDENT Variable – the factor that
affects the result in an experiment
20. No Water
Plant 1 Plant 2 Plant 3
20 mL
Water
every
day
40 mL
Water
every
day
23. Things that might affect how tall
the plant grows could include:
3. Controlled variables
1. the amount of light
2. the temperature of the air
3. the kind of soil
25. What would the
INDEPENDENT
variable be in this
experiment on how
much heat different
soils absorb?
What could be the
DEPENDENT
variable in this
experiment?
Remember you
should measure.
26. Look at the illustration at the right. Study how
hypotheses are formed.
e
Observation: The plant is planted inside the bottle.
Inferences: 1.The plant’s leaves will turn yellow, and
eventually, it will die.
2. The plant will grow healthy.
Hypotheses: 1. If plant is planted inside the bottle, th
plant’s leaves will turn yellow and will die eventually.
2. If plant is planted inside the bottle, then the plant will
grow healthy.
27. Communicating
Process of describing, recording,
and reporting experimental
procedures and results to others…
Oral, written, or mathematical
Organizes ideas using appropriate
vocabulary, graphs, other visual
representations, and mathematical
equations.
29. We introduced the variables
used in the Scientific Method in
a previous presentation. Let’s
think back about what was
covered in that presentation.
Do you remember what the
Scientific Method is?
30. 1. One way scientists find out
about the world around us.
The scientific method is:
2. A method that scientists use
to answer specific questions.
31. If a cat always lands on its feet and...
when you drop your toast it always lands
butter-side down.... what happens when
you tie a piece of buttered toast to a cat’s
back.
*No cats were harmed in this thought experiment.
For example:
32. VARIABLE
In order to understand the
Scientific Method, we first
need to know what a
is.
34. Yes,
a variable is
anything in an experiment
that can change.
Remember there are three
types of variables.
What do you recall about
these three variables?
41. The control variable: all the other things
that could cause the responding variable
to change—must be kept the same.
42. One more thing to remember:
The experimenter always
starts with a
that can be answered by
changing a variable and
observing the results.
?
? ?
? ? ?
? ?
question
44. The first step in this and any
experiment is coming up with a
Problem
45. 1. Problem
• Is a question
• Is made up of
the change and
responding
variable
46. Jane knows that plants
need light to grow. But she
wonders—what about
seeds. Do seeds need light
to sprout? She decides to
design an experiment to
answer her question.
47. So in Jane’s experiment with the seeds
what will her change variable be?
Yes, it will be whether or not the
seeds receive light.
What could her responding variable
be?—what could she observe or
measure to see whether or not seeds
need light to sprout or grow?
48. She plans to put 3 seeds in light and 3
seeds in the dark and then count the
number of seeds that sprout when
light is present and the number when
light is not present.
Now that we have the change variable
(light and dark) and the responding
variable (the number of seeds that
sprout), let us write the problem—the
question with the change and
responding variable.
49. Will more seeds sprout in the light
than in the dark?
or
Does light affect the number of
seeds that sprout?
50. After you come up with a Problem, the
next step in the Scientific Method is
coming up with:
The Hypothesis.
52. experiment with light and sprouting
seeds?
What do you think? Will more seeds
sprout in the light or in the dark?
Because plants need light to grow, Jane
thinks seeds will also need light to
What will be the hypothesis for Jane’s
sprout. So her hypothesis will be:
More seeds will sprout in the light
than in the dark.
53. This plan is called
The Procedure
After coming up with an
Hypothesis, the experimenter
writes out a plan to test the
Hypothesis.
54. 3. Procedure
• Steps to be
taken to test
the hypothesis
• Includes
control
variables
55. What would be some of the control
variables in Jane’s experiment. What
besides light might affect how many seeds
sprout?
Jane thinks seeds need light to sprout. On
the next slide, you will see the step by step
plan that Jane came up with to test her
hypothesis.
Circle the change variable in red, the
responding variable in green and underline
the control variables in purple.
56. 1. Find 10 identical potting containers and
fill them with the same type of potting soil.
Place 3 pinto bean seeds in each potting
container on top of the soil-- don’t cover the
seeds with soil.
2. All ten of the pots are to be placed in the
same area, getting the same amount of
sunlight for two weeks, but:
3. Cover 5 of the pots with black paper bags
so that the seeds receive no light except
when watered.
57. 5. After two weeks count
the number of seeds that
have sprouted (started to
grow) in each pot.
4. Each day pour 15 mL
of tap water into each
pot.
59. 1. Find 10 identical potting containers and
fill them with the same type of potting soil.
Place 3 pinto bean seeds in each potting
container on top of the soil-- don’t cover the
seeds with soil.
2. All ten of the pots are to be placed in the
same area, getting the same amount of
sunlight for two weeks, but:
3. Cover 5 of the pots with black paper bags
so that the seeds can receive light only
when watered.
60. 5. After two weeks count
the number of seeds that
have sprouted (started to
grow) in each pot.
4. Each day pour 15 mL
of tap water into each
pot.
61. Once the
experimenter has
come up with a
step-by-step
procedure, he or
she gathers the
materials and
conducts the
experiment.
62. As an experimenter conducts the
experiment, he or she records the
observations or measurements
(data) in a data chart.
63.
64. To make sure that the results did
not occur due to chance, an
experimenter repeats the
experiment several times
collecting data each time.
65. Trial 1 Trial 2 Trial 3 Average
Light 3 seeds 3 seeds 3 seeds 3 seeds
No Light 3 seeds 3 seeds 3 seeds 3 seeds
Here are the results of Jane’s
experiment as shown in a data
chart.
The number of seeds that sprouted
Sometimes the results are also
shown in a graph.
66. After conducting the
experiment and gathering the
data using the steps in the
Procedure, the experimenter
4. analyzes the data
67.
68. Trial 1 Trial 2 Trial 3 Average
Light 3 seeds 3 seeds 3 seeds 3 seeds
No Light 3 seeds 3 seeds 3 seeds 3 seeds
The number of seeds that sprouted
Let us analyze Jane’s data.
We see that all seeds sprouted
in both the light and in the
dark.
69. 5. Conclusion
After analyzing the data, the
experimenter comes up with a
• answers the question
allowing the experimenter to
decide if the hypothesis is right
or wrong.
78. Share your results and ask someone
else to duplicate your experiment.
Try this
and see
if you
think it
tastes
good.
79. Steps in the Scientific Method
• Problem
• Hypothesis
• Procedure
• Analyze data
• Conclusion
80. Let’s put our knowledge of the
Scientific Method to a realistic
example that includes some of
the terms you’ll be needing to
use and understand.
81. Problem/Question
John watches his grandmother bake
bread. He ask his grandmother what
makes the bread rise.
She explains that yeast releases a
gas as it feeds on sugar.
John wonders if the amount of sugar
used in the recipe will affect the size
of the bread loaf
82. Observation/Research
John researches the
areas of baking and
fermentation and tries
to come up with a
way
to test his question.
He keeps all of his
information on this
topic in a journal.
83. A Little Practice with the Scientific
Method
The next slide is a Bart Simpson scenario.
Read it carefully, and see whether you
can answer the associated questions.
84. Bart Simpson believes that mice exposed to microwaves will
become extra strong (maybe he’s been reading too much
Radioactive Man).
He decides to perform this experiment by placing 10 mice in a
microwave for 10 seconds (do not do this at home, Bart is a
misguided fictional character ). He compared these 10 mice to
another 10 mice that had not been exposed. His test
consisted of a heavy block of wood that blocked the mouse food.
He found that 8 out of the 10 microwaved mice were able to push
the block away. 7 out of 10 non-microwaved mice were able
to do the same.
4. What was Bart’s hypothesis?
5. Identify the Control group.
6. Identify the independent and dependent variables
7. What might be some of the possible constants?
8. What should Bart’s conclusion be?