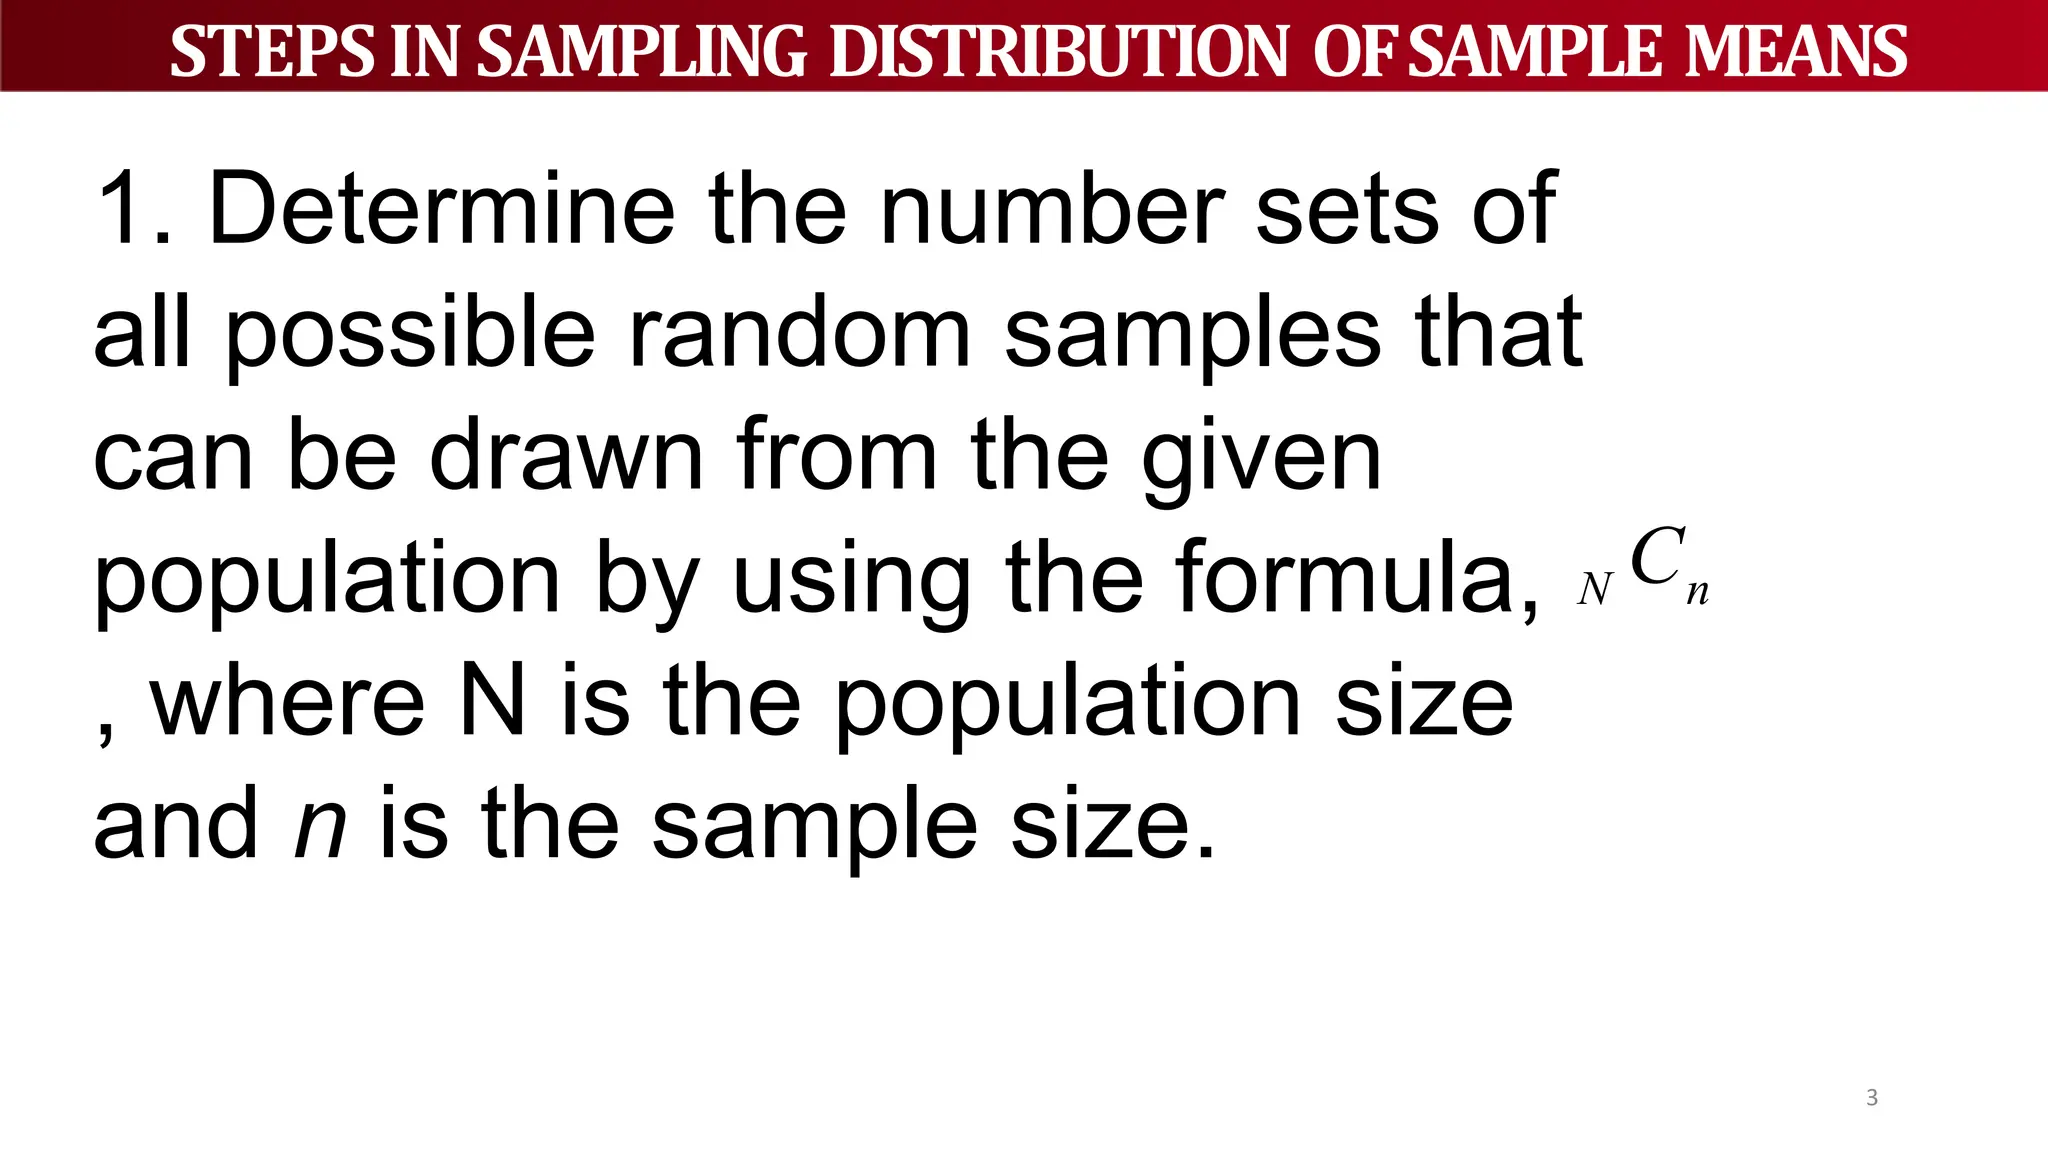
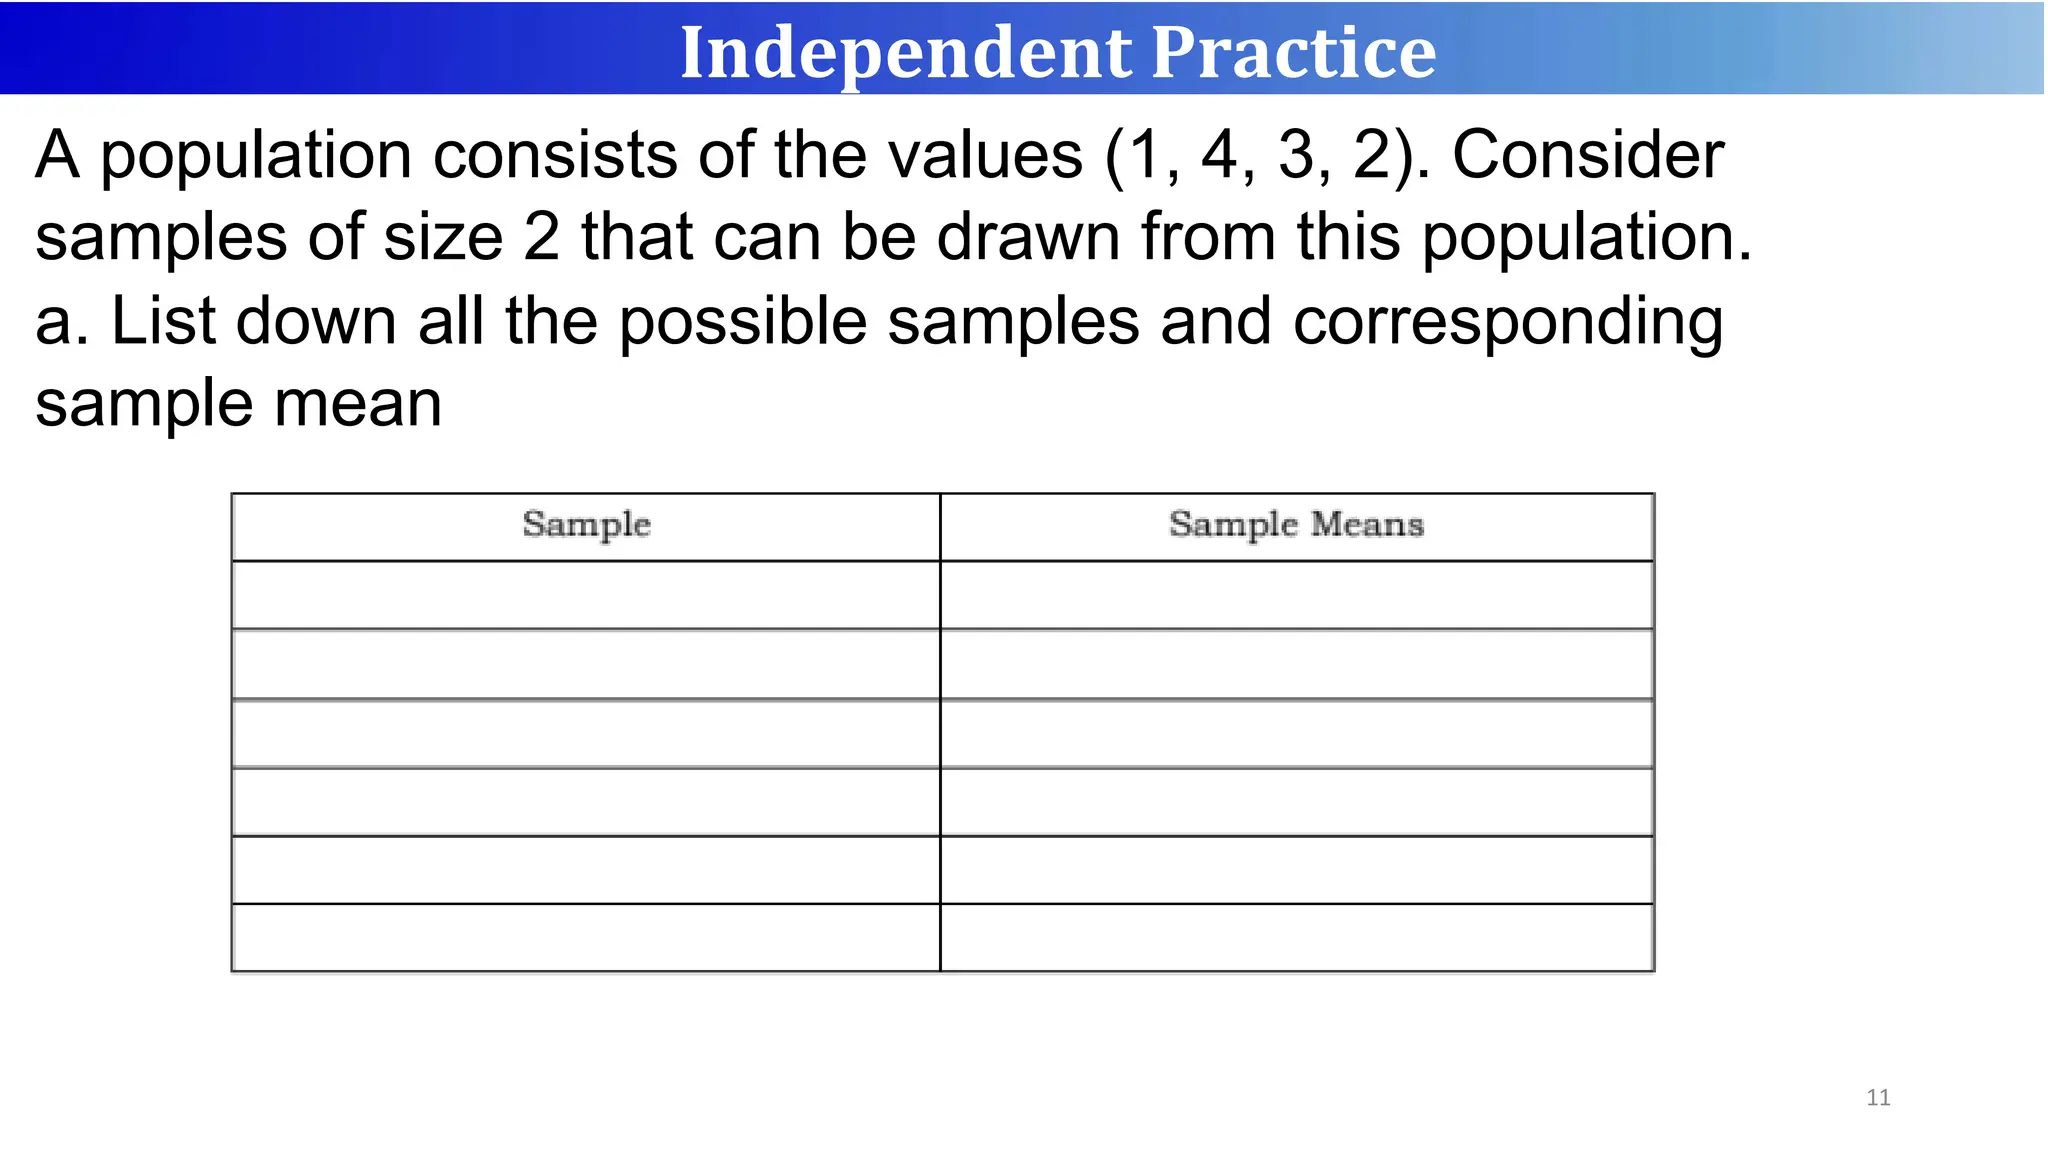
Sampling Distribution
of the Sample Mean
1
Is a frequency distribution using
the means computed from all
possible random samples of a
specific size taken from a
population. The means of the
samples are less than or greater
than the mean of the population.
SAMPLING DISTRIBUTION OFSAMPLE MEANS
2
1. Determine the number sets of
all possible random samples that
can be drawn from the given
population by using the formula,
, where N is the population size
and n is the sample size.
STEPSINSAMPLING DISTRIBUTION OFSAMPLE MEANS
3
N n
C
2. List all possible samples and
compute the mean of each
sample.
3. Construct a sampling
distribution.
4. Construct histogram of the
sampling distribution.
STEPSINSAMPLING DISTRIBUTION OFSAMPLE MEANS
4
A population of Senior High School
consists of numbers 1, 2, 3, 4, 5. Create a
sampling distribution of size 3.
EXAMPLE
5
1. Determine the number sets of all possible random
samples that can be drawn from the given
population by using the formula, , where N is the
population size and n is the sample size.
2. List all possible samples and compute the mean of
each sample.
6
N n
C
!
!( )!
N n
N
C
n N n


SOLUTION
7
SOLUTION
3. Construct a frequency and probability distribution table
of the sample means indicating its number of occurrences
or the frequency and probability.
8
SOLUTION
4. Construct histogram of the sampling distribution.
9
SOLUTION
How many different samples of size n can be obtained
from the following population N sizes?
10
Independent Practice
A population consists of the values (1, 4, 3, 2). Consider
samples of size 2 that can be drawn from this population.
a. List down all the possible samples and corresponding
sample mean
11
Independent Practice
A population consists of the values (1, 4, 3, 2). Consider
samples of size 2 that can be drawn from this population.
b. Construct the sampling distribution of the sample
means.
12
Independent Practice
1. What distribution pertains to the
frequency distribution of the sample
mean from all the possible random
samples of a particular sample size n
taken from the given population?
a. frequency c. population
b. normal d. sampling
13
QUIZ
2. Which of the following is NOT a step in
creating sampling distribution of the sample
mean?
a. Compute for the standard deviation and variance of the
samples.
b. Construct a frequency distribution table of the sample
means and probability.
c. Determine the number of sets of all possible random
samples.
d. List all the possible random samples and solve for the
sample mean of each set of samples.
14
QUIZ
3. Which of the following is the mean of
sample 6, 10, 21, 25, and 28?
a. 15.17
b. b. 18
c. c. 21.2
d. d. 22
15
QUIZ
For numbers 4-5, refer to the following set of
data of a population {11, 12, 13, 14}.
4. How many different samples of size n = 2 can
be drawn from the population?
a. 6
b. 5
c. 4
d. 3
16
QUIZ
For numbers 4-5, refer to the following set of
data of a population {11, 12, 13, 14}.
5. What is the lowest value of the sample mean
in this sampling distribution?
a. 11.5
b. b. 12
c. c. 12.5
d. d. 13
17
QUIZ
Loren was able to sell several pairs of Marikina
shoes that have sizes of 4, 5, 6, 7,
and 8. Consider samples of size 3 that can be
drawn from this population.
18
ACTIVITY
19
ACTIVITY

Sampling Distribution ofthe Sample Mean.pptx

  • 1.
  • 2.
    Is a frequencydistribution using the means computed from all possible random samples of a specific size taken from a population. The means of the samples are less than or greater than the mean of the population. SAMPLING DISTRIBUTION OFSAMPLE MEANS 2
  • 3.
    1. Determine thenumber sets of all possible random samples that can be drawn from the given population by using the formula, , where N is the population size and n is the sample size. STEPSINSAMPLING DISTRIBUTION OFSAMPLE MEANS 3 N n C
  • 4.
    2. List allpossible samples and compute the mean of each sample. 3. Construct a sampling distribution. 4. Construct histogram of the sampling distribution. STEPSINSAMPLING DISTRIBUTION OFSAMPLE MEANS 4
  • 5.
    A population ofSenior High School consists of numbers 1, 2, 3, 4, 5. Create a sampling distribution of size 3. EXAMPLE 5
  • 6.
    1. Determine thenumber sets of all possible random samples that can be drawn from the given population by using the formula, , where N is the population size and n is the sample size. 2. List all possible samples and compute the mean of each sample. 6 N n C ! !( )! N n N C n N n   SOLUTION
  • 7.
  • 8.
    3. Construct afrequency and probability distribution table of the sample means indicating its number of occurrences or the frequency and probability. 8 SOLUTION
  • 9.
    4. Construct histogramof the sampling distribution. 9 SOLUTION
  • 10.
    How many differentsamples of size n can be obtained from the following population N sizes? 10 Independent Practice
  • 11.
    A population consistsof the values (1, 4, 3, 2). Consider samples of size 2 that can be drawn from this population. a. List down all the possible samples and corresponding sample mean 11 Independent Practice
  • 12.
    A population consistsof the values (1, 4, 3, 2). Consider samples of size 2 that can be drawn from this population. b. Construct the sampling distribution of the sample means. 12 Independent Practice
  • 13.
    1. What distributionpertains to the frequency distribution of the sample mean from all the possible random samples of a particular sample size n taken from the given population? a. frequency c. population b. normal d. sampling 13 QUIZ
  • 14.
    2. Which ofthe following is NOT a step in creating sampling distribution of the sample mean? a. Compute for the standard deviation and variance of the samples. b. Construct a frequency distribution table of the sample means and probability. c. Determine the number of sets of all possible random samples. d. List all the possible random samples and solve for the sample mean of each set of samples. 14 QUIZ
  • 15.
    3. Which ofthe following is the mean of sample 6, 10, 21, 25, and 28? a. 15.17 b. b. 18 c. c. 21.2 d. d. 22 15 QUIZ
  • 16.
    For numbers 4-5,refer to the following set of data of a population {11, 12, 13, 14}. 4. How many different samples of size n = 2 can be drawn from the population? a. 6 b. 5 c. 4 d. 3 16 QUIZ
  • 17.
    For numbers 4-5,refer to the following set of data of a population {11, 12, 13, 14}. 5. What is the lowest value of the sample mean in this sampling distribution? a. 11.5 b. b. 12 c. c. 12.5 d. d. 13 17 QUIZ
  • 18.
    Loren was ableto sell several pairs of Marikina shoes that have sizes of 4, 5, 6, 7, and 8. Consider samples of size 3 that can be drawn from this population. 18 ACTIVITY
  • 19.