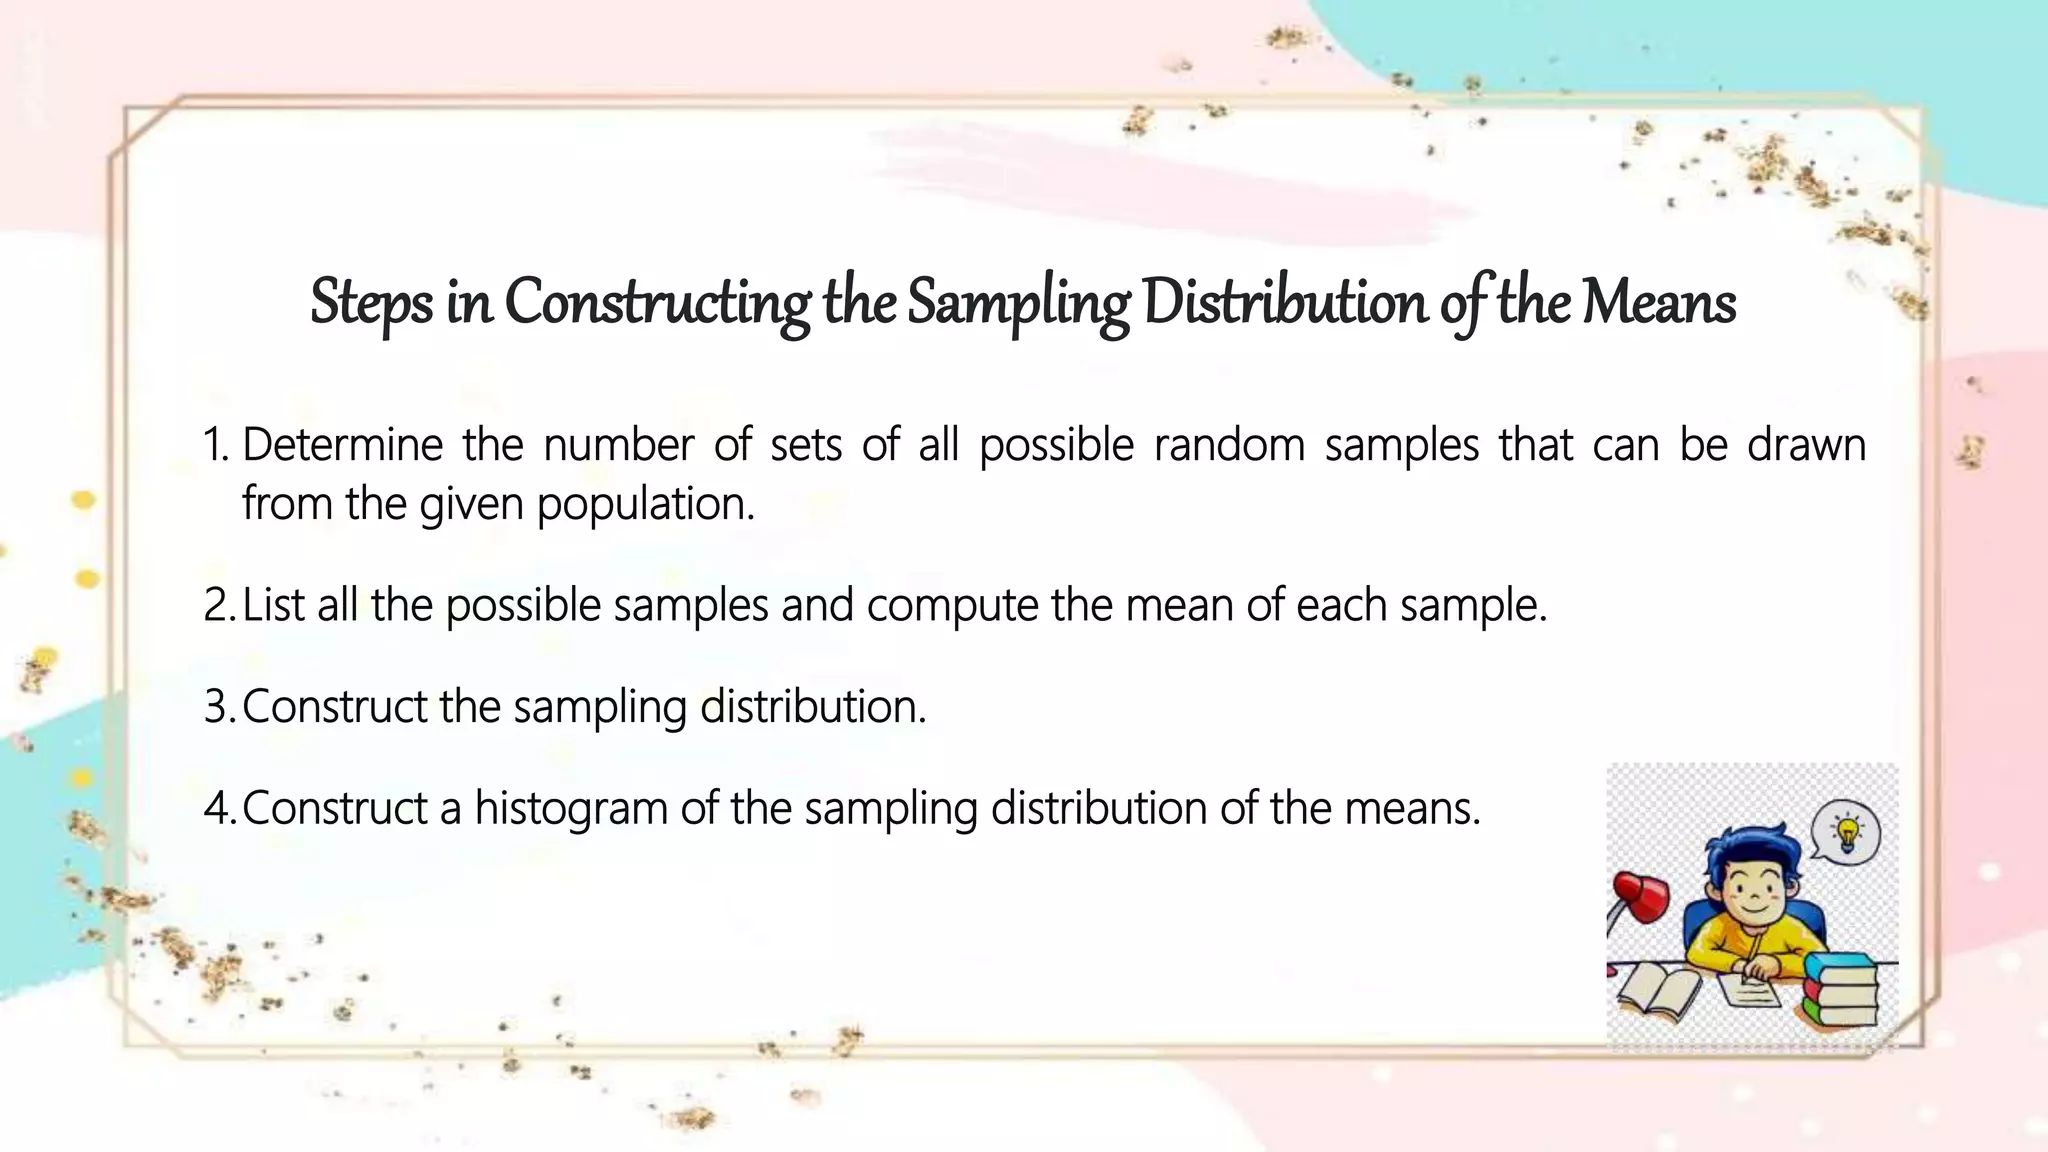
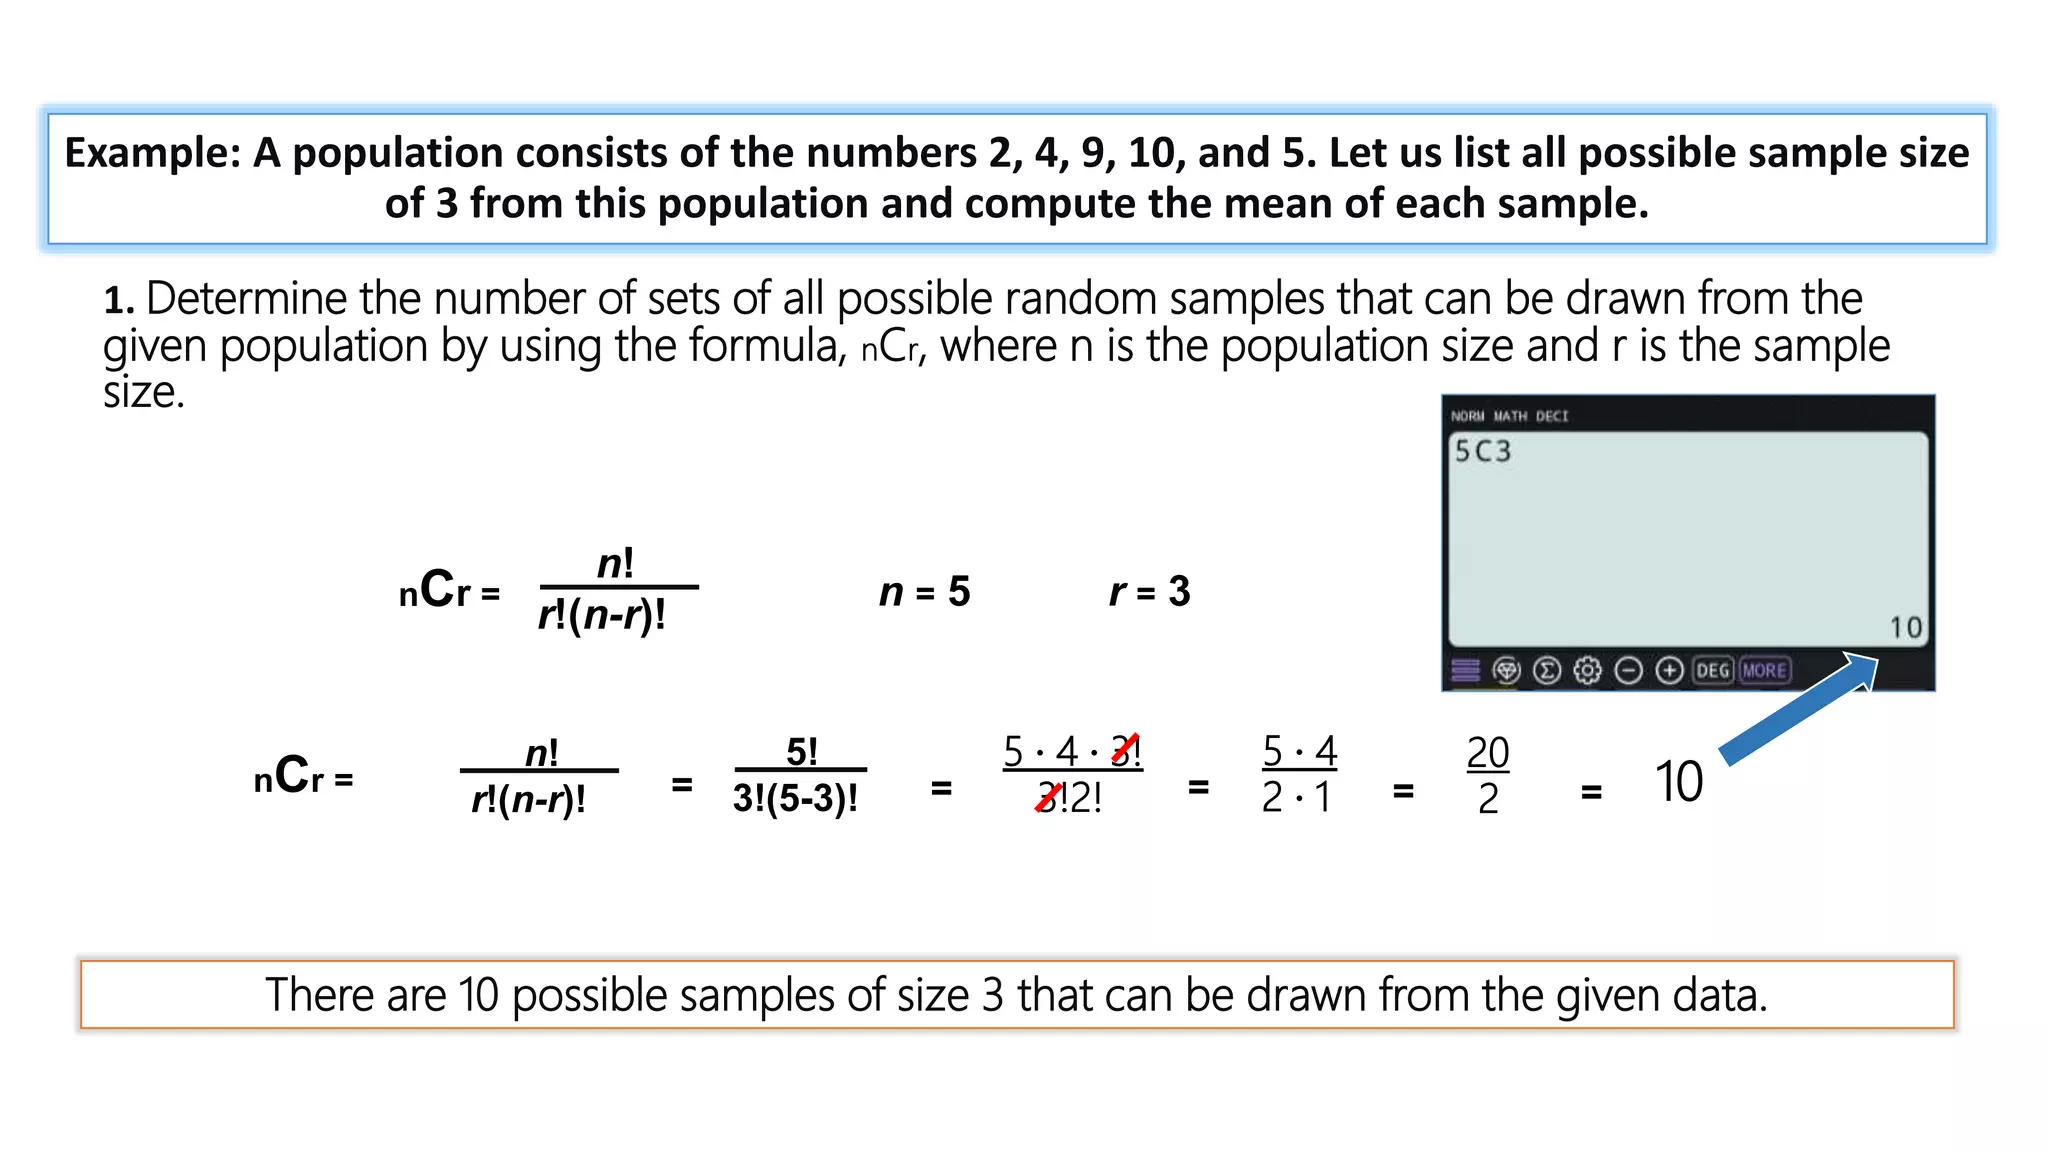
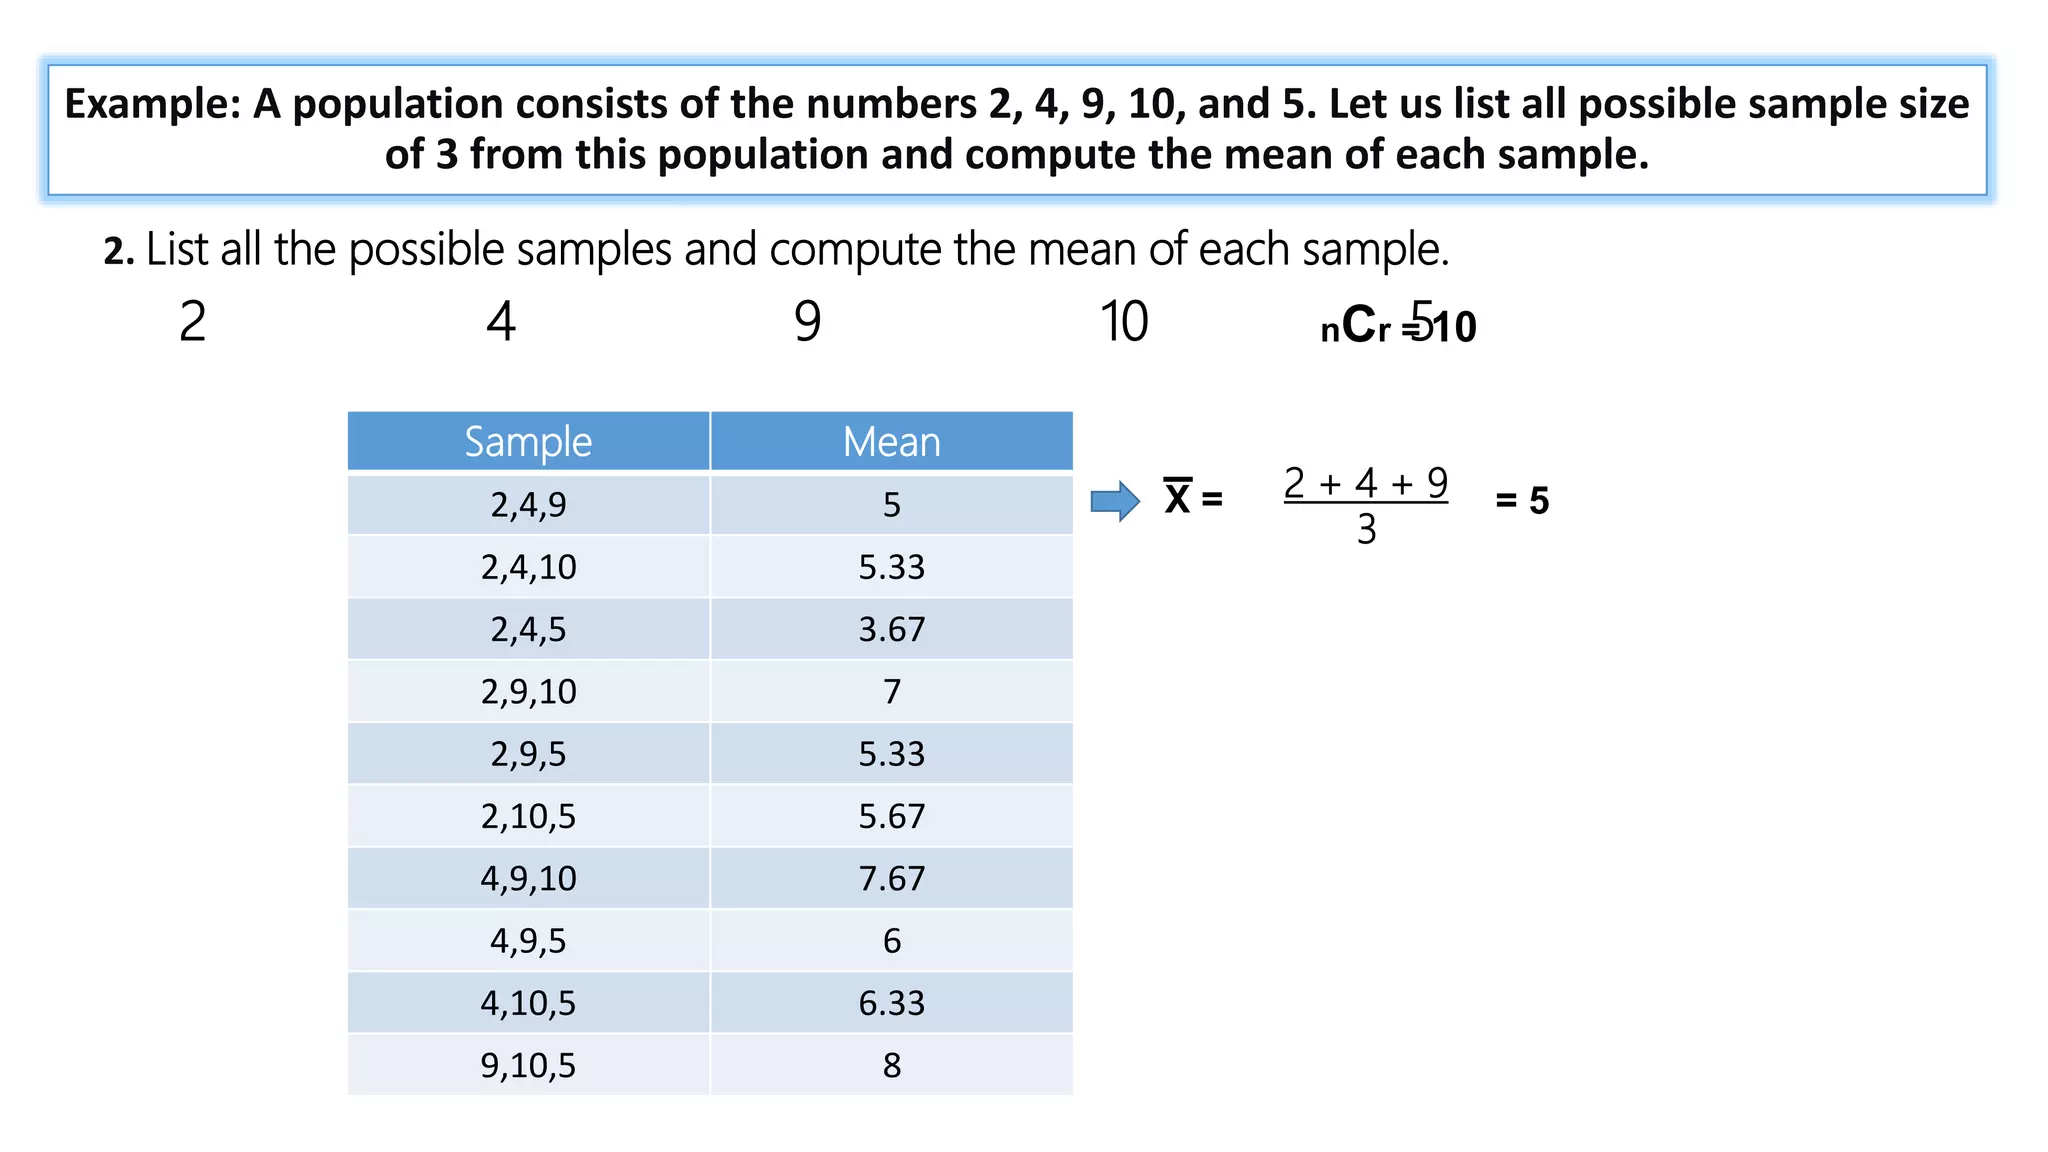
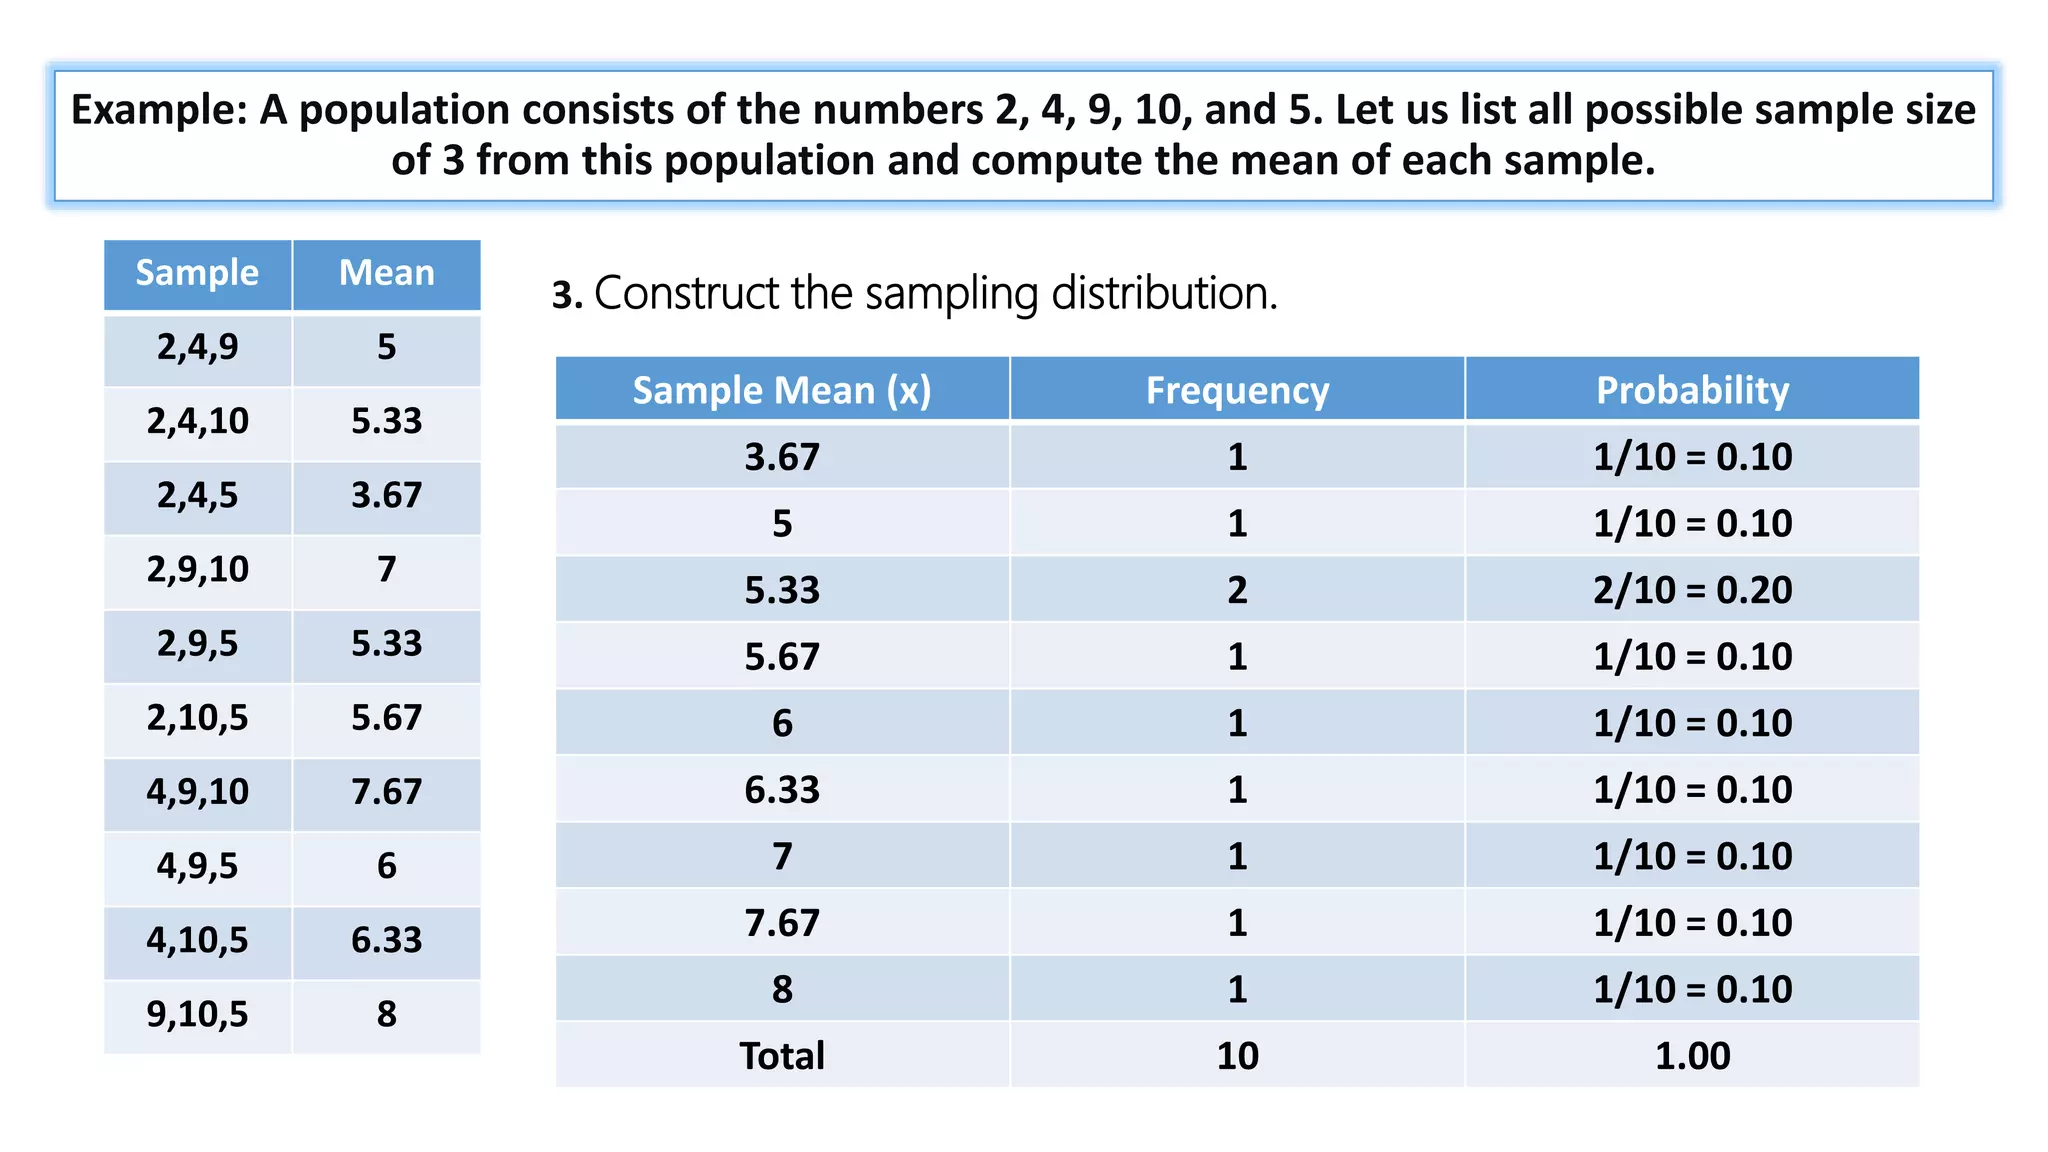
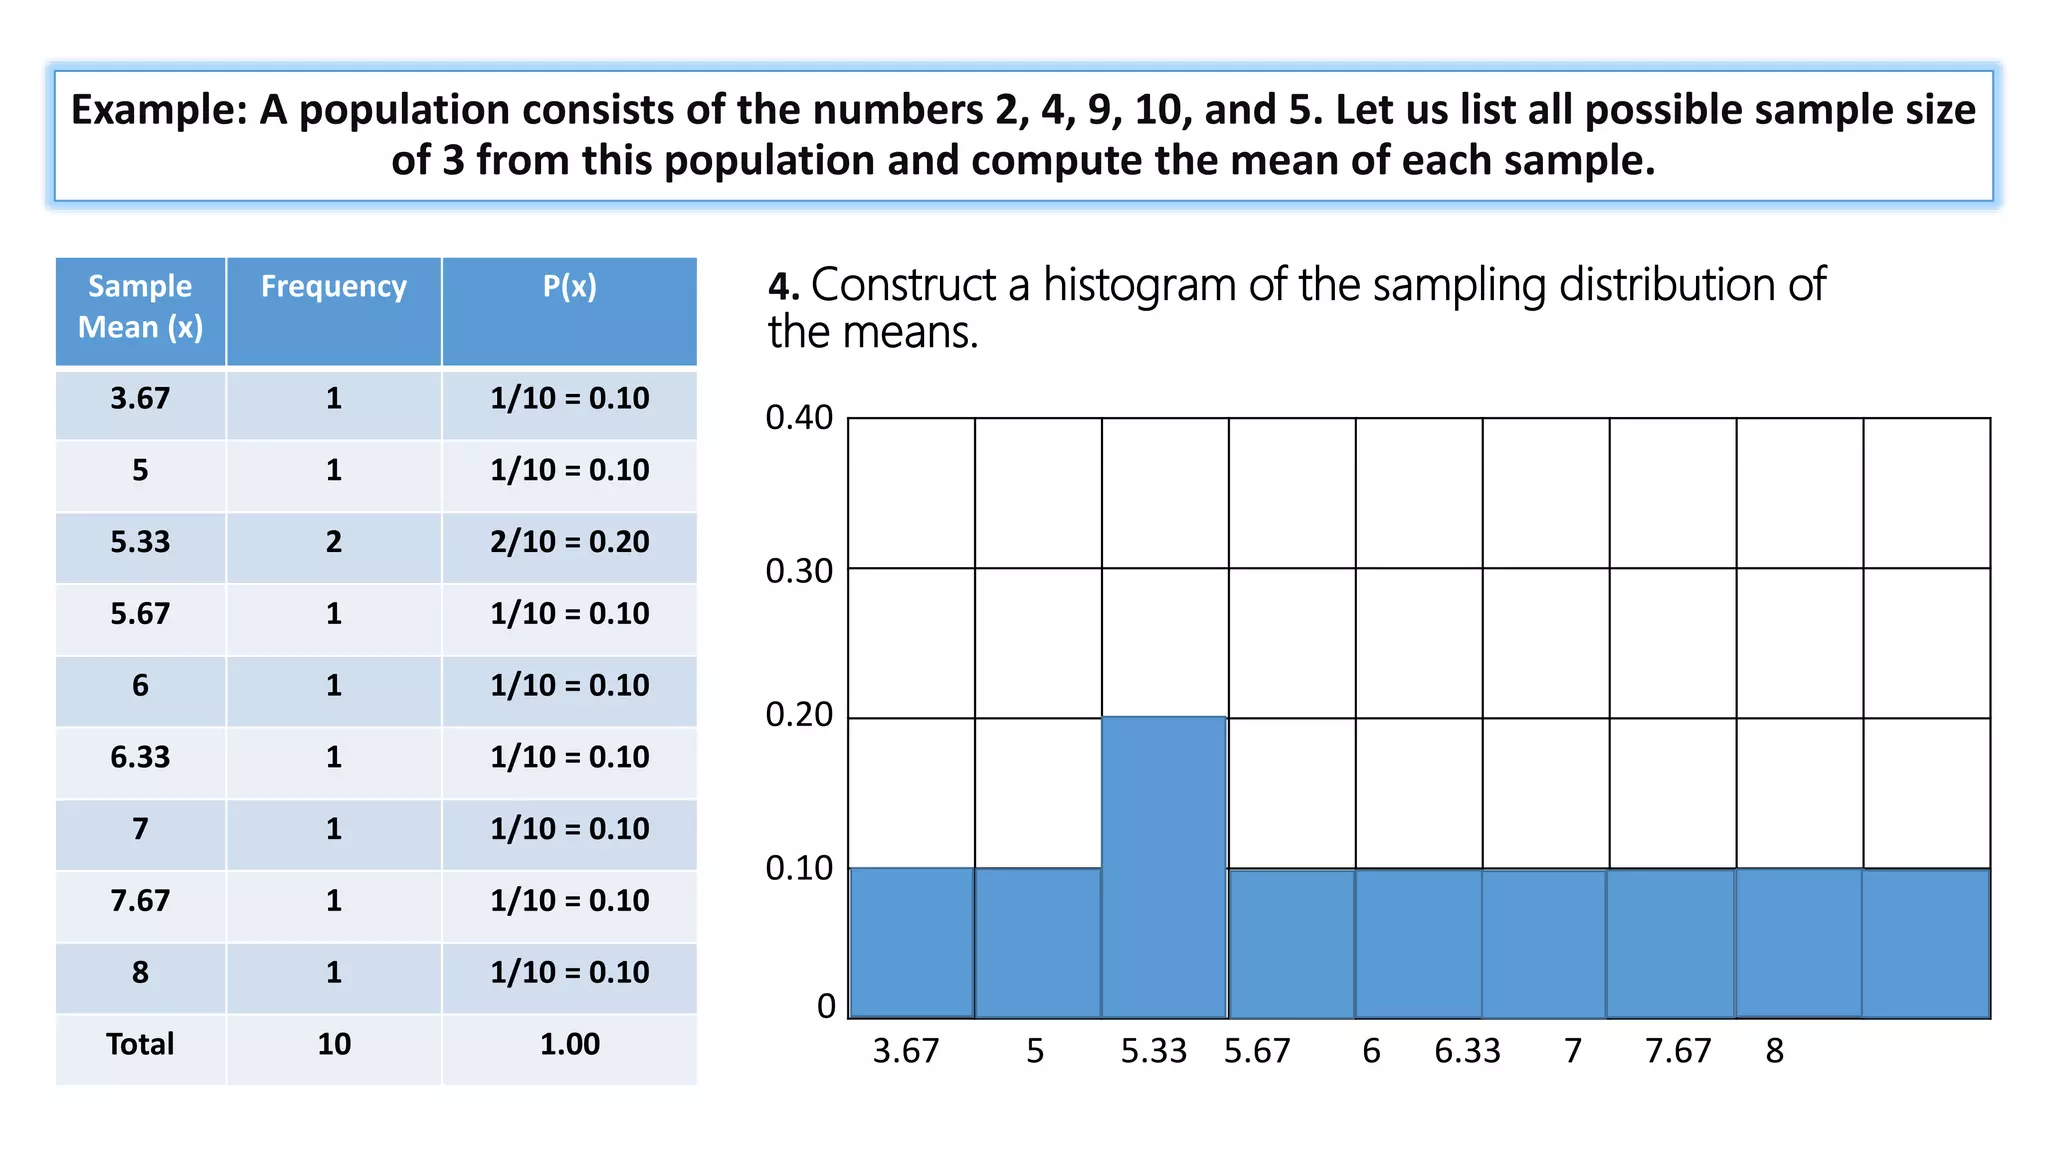
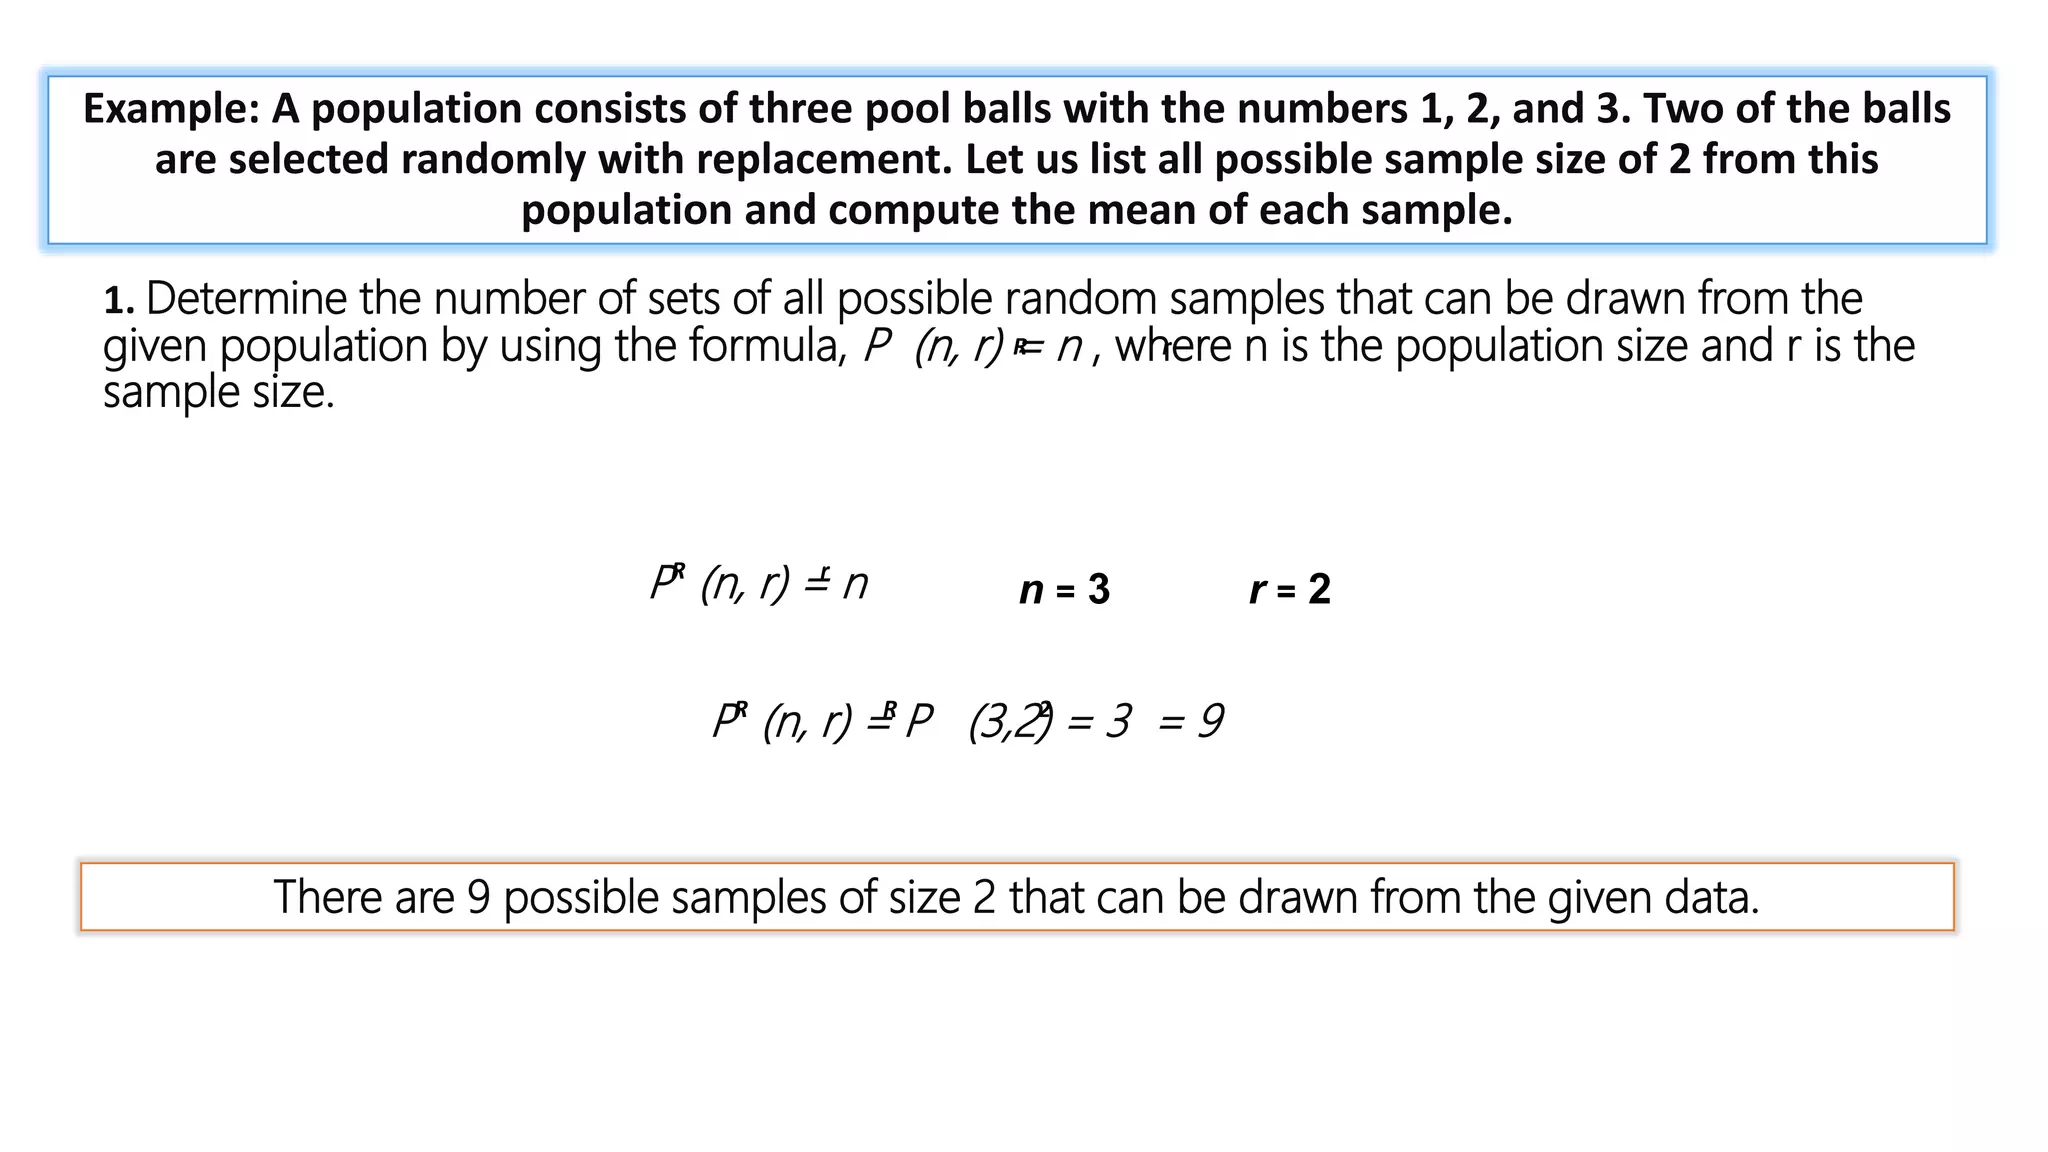
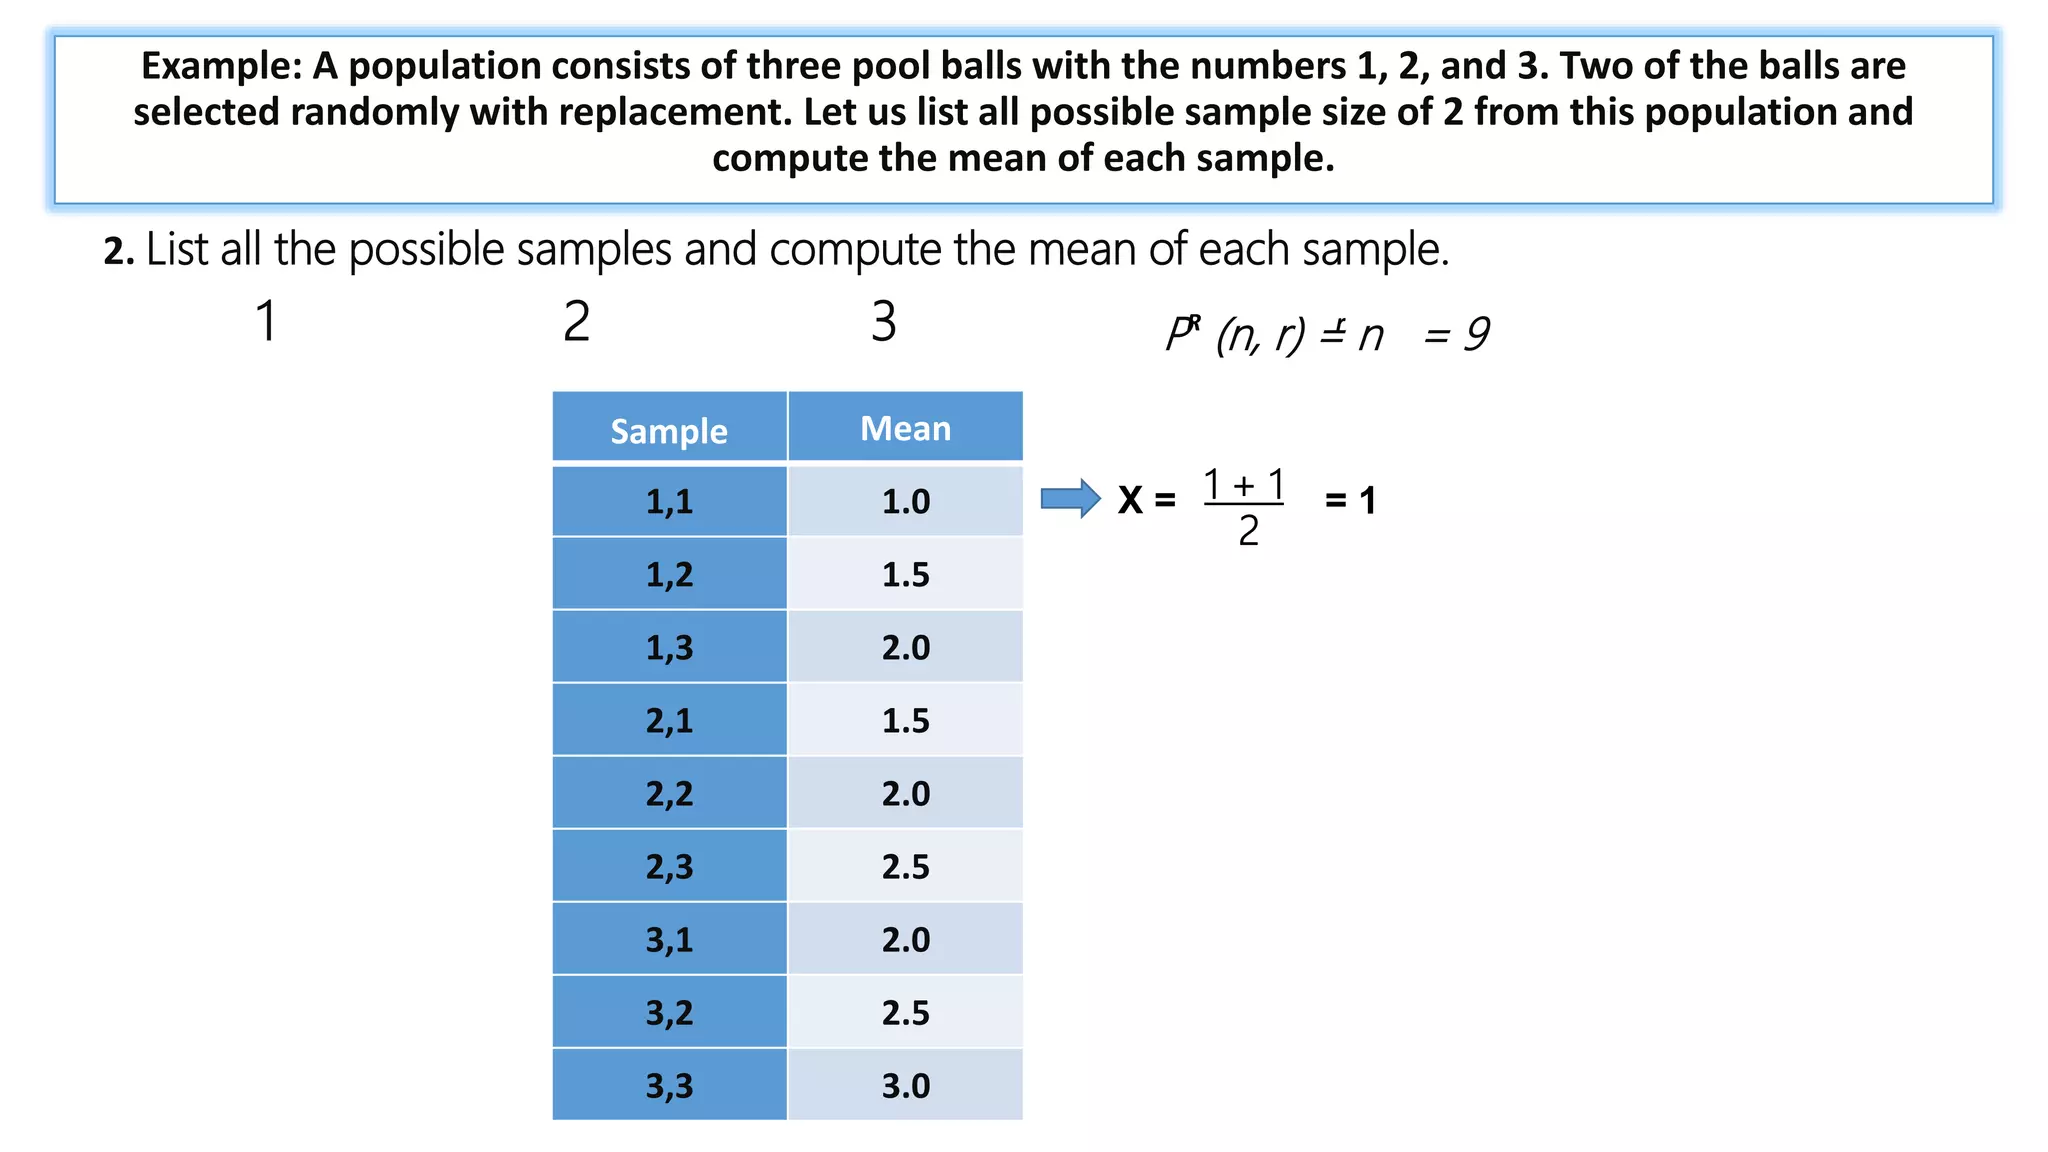
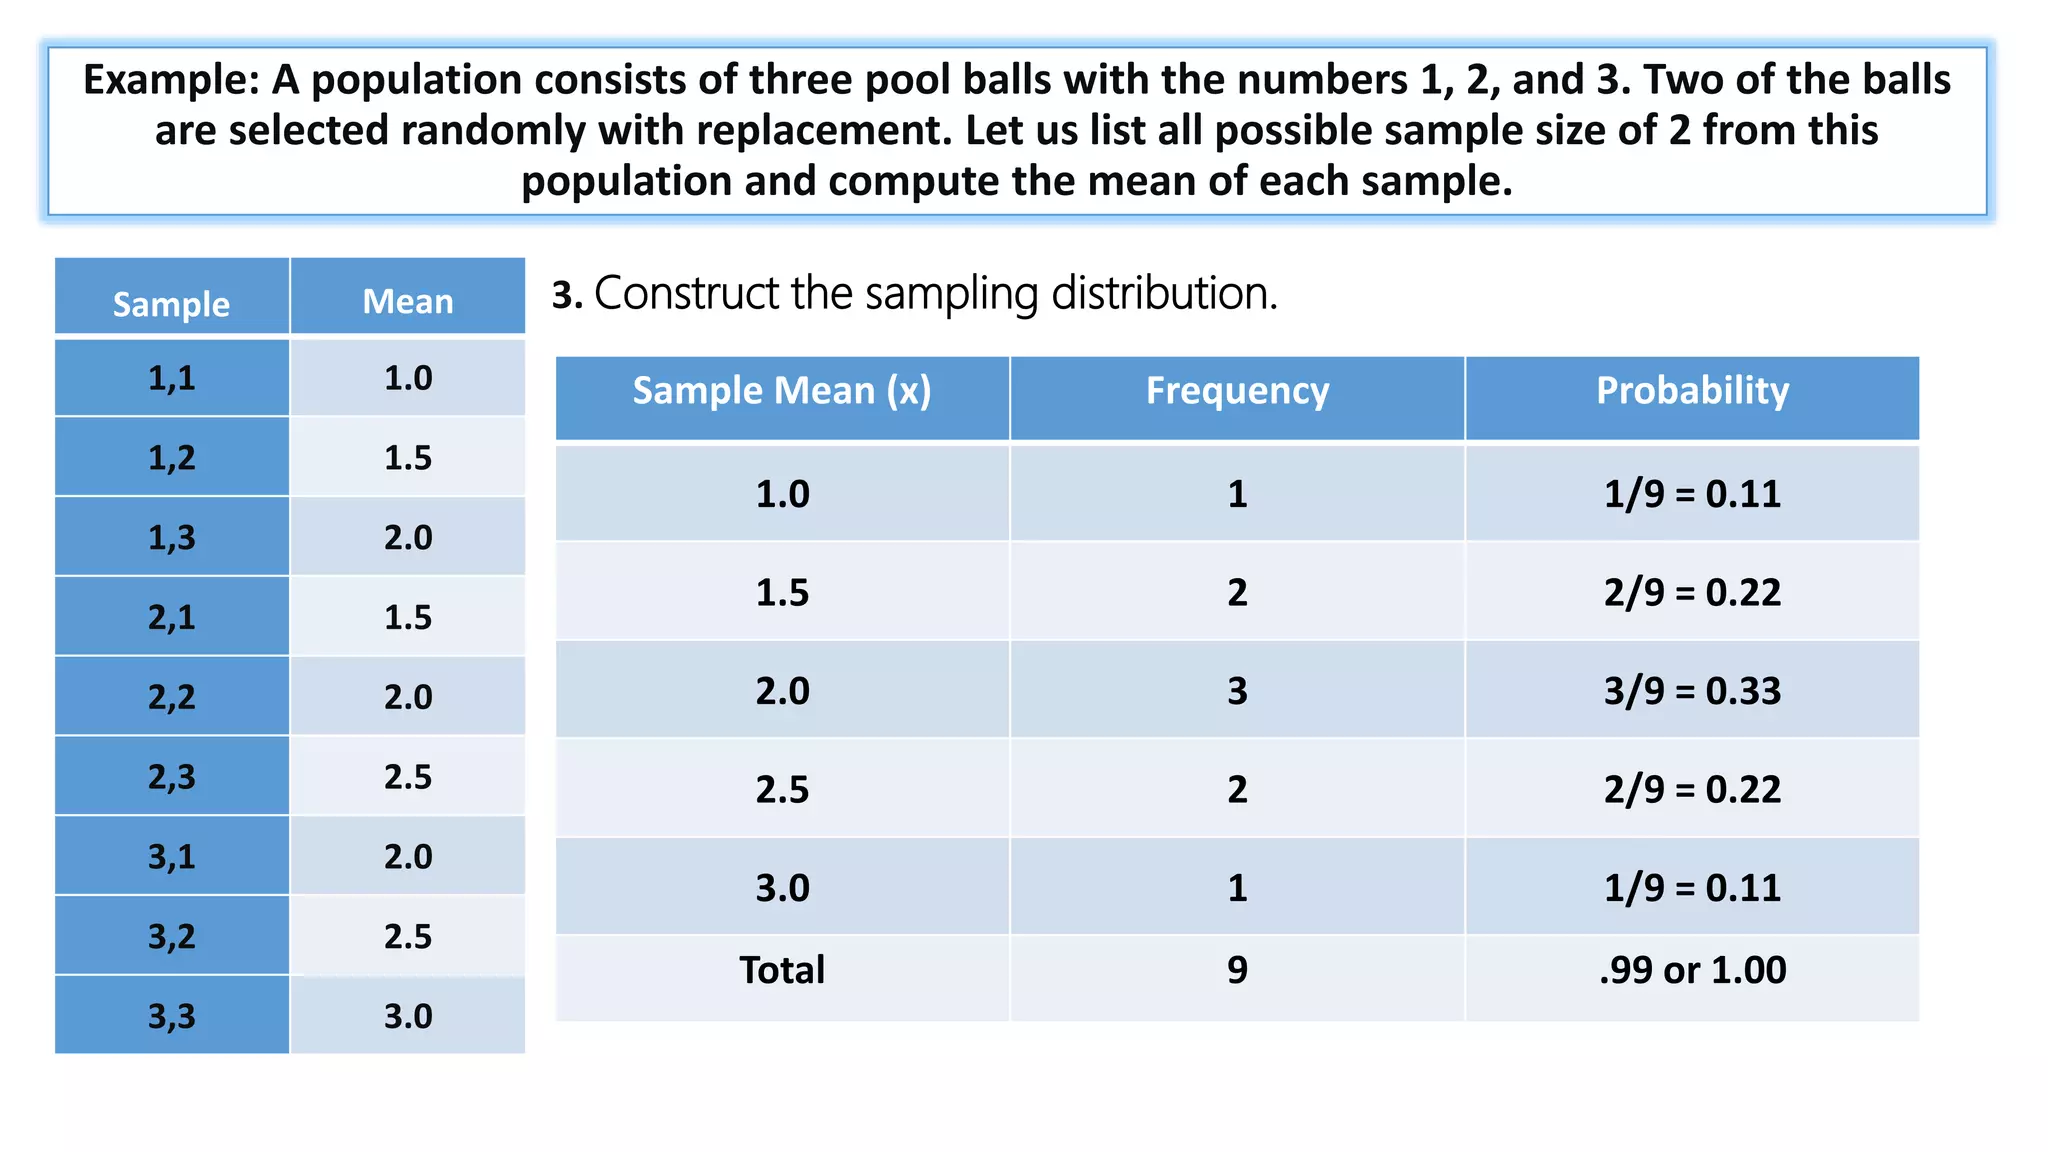
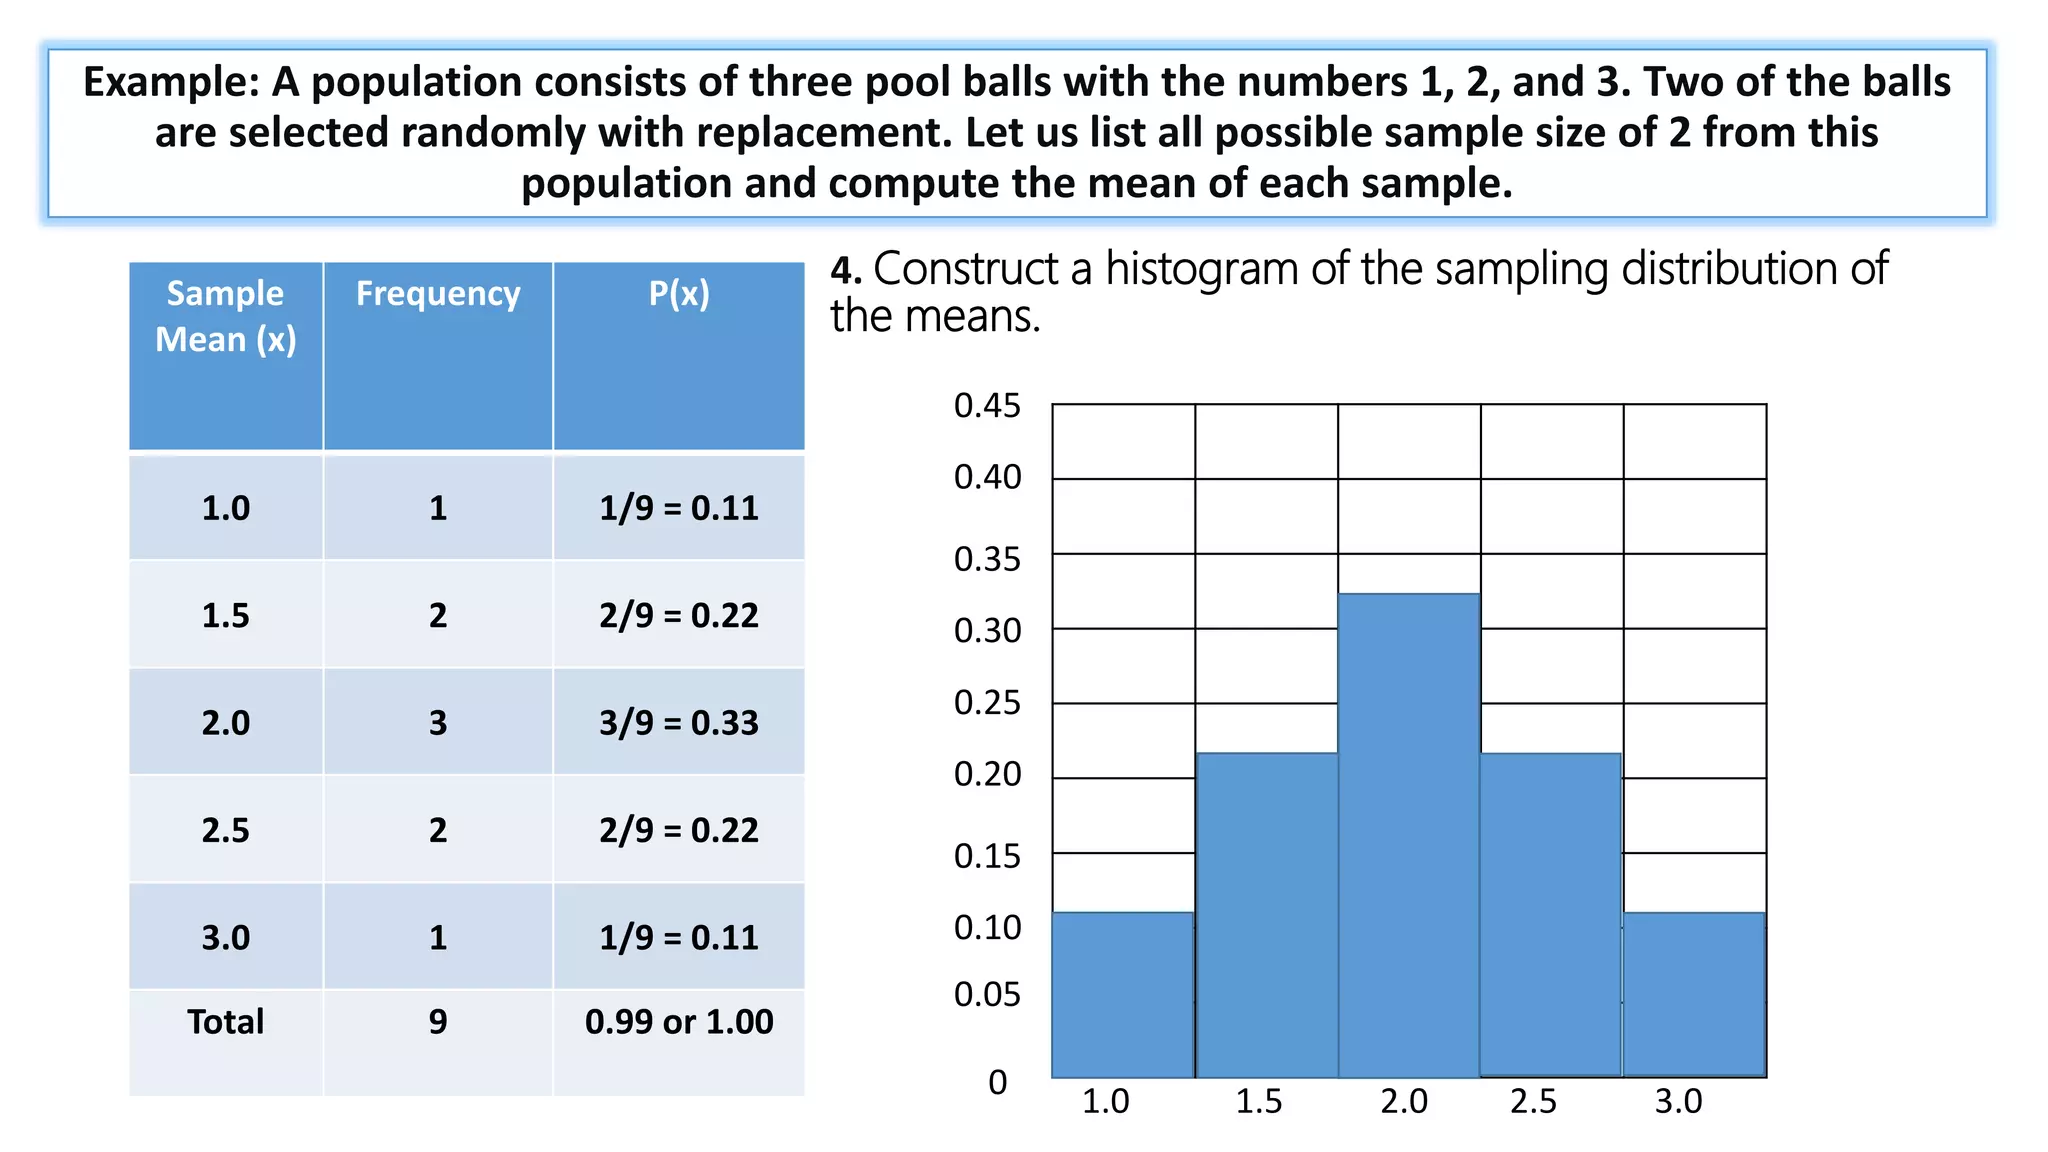
SlideShare a Scribd company logo
1 of 19
SAMPLING DISTRIBUTION
ED 202 – INFERENTIAL STATISTICS
Mark John P. Munda
Mamlad High School
Rommel C. Velasco
Zeferino Arroyo High School
REPORTERS :
Opening Prayer
ALMIGHTY, OUR FATHER, WE PRAISE AND THANK YOU FOR THIS DAY. WE COME
TO YOU THIS HOUR ASKING FOR YOUR BLESSING AND HELP US AS WE ARE
VIRTUALLY GATHERED TOGETHER. WE PRAY FOR GUIDANCE IN THE MATTERS AT
HAND AND ASK THAT YOU WOULD CLEARLY SHOW US HOW TO CONDUCT OUR
VIRTUAL CLASS WITH A SPIRIT OF JOY AND ENTHUSIASM. GIVE US THE
DESIRE TO FIND WAYS AND EXCEL IN OUR CLASS. HELP US TO WORK TOGETHER
AND ENCOURAGE EACH OTHER TO EXCELLENCE. WE ASK THAT WE WOULD
CHALLENGE EACH OTHER AND GAIN MORE KNOWLEDGE TO REACH HIGHER AND
FARTHER TO BE THE BEST WE CAN BE. WE ASK THIS IN THE NAME OF THE LORD
JESUS CHRIST, AMEN.
SAMPLING
DISTRIBUTION
What is sampling distribution of sample means?
• A sampling distribution of sample means is a frequency distribution using the means
computed from all possible random samples of a specific size taken from a
population. The means of the samples are less than or greater than the mean of the
population.
• Using a sampling distribution simplifies the process of making inferences about large
amounts of data. For this reason, it is used often as a statistical resource in data
science.
Sampling Distribution
(without and with replacement)
• In sampling without replacement, each sample unit of the population has only one
chance to be selected in the sample. For example, if one draws a simple random
sample such that no unit occurs more than one time in the sample, the sample is
drawn without replacement.
• If a unit can occur one or more times in the sample, then the sample is drawn with
replacement.
Population Size and Sample Size
• A population is the entire group that you want
to draw conclusions about.
• A sample is the specific group that you will
collect data from. The size of the sample is
always less than the total size of the
population.
• In research, a population doesn’t always refer
to people. It can mean a group containing
elements of anything you want to study, such
as objects, events, organizations, countries,
species, organisms, etc.
Steps in Constructing the Sampling Distribution of the Means
1. Determine the number of sets of all possible random samples that can be drawn
from the given population.
2.List all the possible samples and compute the mean of each sample.
3.Construct the sampling distribution.
4.Construct a histogram of the sampling distribution of the means.
SAMPLING DISTRIBUTION OF
THE MEANS
WITHOUT REPLACEMENT
= 1 +
𝑛𝑥
1!
+
𝑛 𝑛 − 1 𝑥2
2!
+ ⋯
Example: A population consists of the numbers 2, 4, 9, 10, and 5. Let us list all possible sample size
of 3 from this population and compute the mean of each sample.
1. Determine the number of sets of all possible random samples that can be drawn from the
given population by using the formula, nCr, where n is the population size and r is the sample
size.
nCr =
n!
r!(n-r)!
n = 5 r = 3
There are 10 possible samples of size 3 that can be drawn from the given data.
nCr =
n!
r!(n-r)! =
5!
3!(5-3)! =
5 · 4 · 3!
3!2! =
5 · 4
2 · 1 =
20
2 = 10
= 1 +
𝑛𝑥
1!
+
𝑛 𝑛 − 1 𝑥2
2!
+ ⋯
Example: A population consists of the numbers 2, 4, 9, 10, and 5. Let us list all possible sample size
of 3 from this population and compute the mean of each sample.
2. List all the possible samples and compute the mean of each sample.
2 4 9 10 5
nCr = 10
X = 2 + 4 + 9
3
_
= 5
Sample Mean
2,4,9 5
2,4,10 5.33
2,4,5 3.67
2,9,10 7
2,9,5 5.33
2,10,5 5.67
4,9,10 7.67
4,9,5 6
4,10,5 6.33
9,10,5 8
= 1 +
𝑛𝑥
1!
+
𝑛 𝑛 − 1 𝑥2
2!
+ ⋯
Example: A population consists of the numbers 2, 4, 9, 10, and 5. Let us list all possible sample size
of 3 from this population and compute the mean of each sample.
3. Construct the sampling distribution.
Sample Mean
2,4,9 5
2,4,10 5.33
2,4,5 3.67
2,9,10 7
2,9,5 5.33
2,10,5 5.67
4,9,10 7.67
4,9,5 6
4,10,5 6.33
9,10,5 8
Sample Mean (x) Frequency Probability
3.67 1 1/10 = 0.10
5 1 1/10 = 0.10
5.33 2 2/10 = 0.20
5.67 1 1/10 = 0.10
6 1 1/10 = 0.10
6.33 1 1/10 = 0.10
7 1 1/10 = 0.10
7.67 1 1/10 = 0.10
8 1 1/10 = 0.10
Total 10 1.00
= 1 +
𝑛𝑥
1!
+
𝑛 𝑛 − 1 𝑥2
2!
+ ⋯
Example: A population consists of the numbers 2, 4, 9, 10, and 5. Let us list all possible sample size
of 3 from this population and compute the mean of each sample.
4. Construct a histogram of the sampling distribution of
the means.
Sample
Mean (x)
Frequency P(x)
3.67 1 1/10 = 0.10
5 1 1/10 = 0.10
5.33 2 2/10 = 0.20
5.67 1 1/10 = 0.10
6 1 1/10 = 0.10
6.33 1 1/10 = 0.10
7 1 1/10 = 0.10
7.67 1 1/10 = 0.10
8 1 1/10 = 0.10
Total 10 1.00
0.40
0.30
0.20
0.10
0
3.67 5 5.33 5.67 6 6.33 7 7.67 8
SAMPLING DISTRIBUTION OF
THE MEANS
WITH REPLACEMENT
= 1 +
𝑛𝑥
1!
+
𝑛 𝑛 − 1 𝑥2
2!
+ ⋯
Example: A population consists of three pool balls with the numbers 1, 2, and 3. Two of the balls
are selected randomly with replacement. Let us list all possible sample size of 2 from this
population and compute the mean of each sample.
1. Determine the number of sets of all possible random samples that can be drawn from the
given population by using the formula, P (n, r) = n , where n is the population size and r is the
sample size.
P (n, r) = n n = 3 r = 2
There are 9 possible samples of size 2 that can be drawn from the given data.
R r
R r
P (n, r) = P (3,2) = 3 = 9
R R 2
= 1 +
𝑛𝑥
1!
+
𝑛 𝑛 − 1 𝑥2
2!
+ ⋯
2. List all the possible samples and compute the mean of each sample.
1 2 3
X = 2 + 4 + 9
3
_
= 5
P (n, r) = n = 9
R r
Sample Mean
1,1 1.0
1,2 1.5
1,3 2.0
2,1 1.5
2,2 2.0
2,3 2.5
3,1 2.0
3,2 2.5
3,3 3.0
X = 1 + 1
2
= 1
Example: A population consists of three pool balls with the numbers 1, 2, and 3. Two of the balls are
selected randomly with replacement. Let us list all possible sample size of 2 from this population and
compute the mean of each sample.
= 1 +
𝑛𝑥
1!
+
𝑛 𝑛 − 1 𝑥2
2!
+ ⋯
Example: A population consists of three pool balls with the numbers 1, 2, and 3. Two of the balls
are selected randomly with replacement. Let us list all possible sample size of 2 from this
population and compute the mean of each sample.
3. Construct the sampling distribution.
Sample Mean (x) Frequency Probability
1.0 1 1/9 = 0.11
1.5 2 2/9 = 0.22
2.0 3 3/9 = 0.33
2.5 2 2/9 = 0.22
3.0 1 1/9 = 0.11
Total 9 .99 or 1.00
Sample Mean
1,1 1.0
1,2 1.5
1,3 2.0
2,1 1.5
2,2 2.0
2,3 2.5
3,1 2.0
3,2 2.5
3,3 3.0
= 1 +
𝑛𝑥
1!
+
𝑛 𝑛 − 1 𝑥2
2!
+ ⋯
Example: A population consists of three pool balls with the numbers 1, 2, and 3. Two of the balls
are selected randomly with replacement. Let us list all possible sample size of 2 from this
population and compute the mean of each sample.
4. Construct a histogram of the sampling distribution of
the means.
Sample
Mean (x)
Frequency P(x)
1.0 1 1/9 = 0.11
1.5 2 2/9 = 0.22
2.0 3 3/9 = 0.33
2.5 2 2/9 = 0.22
3.0 1 1/9 = 0.11
Total 9 0.99 or 1.00
0.40
0.30
0.20
0.10
0 1.0 1.5 2.0 2.5 3.0
0.45
0.35
0.25
0.15
0.05
Generalization
Sampling is a statistical procedure that is concerned with the
selection of the individual observation; it helps us to make statistical
inferences about the population. In sampling, we assume that samples are
drawn from the population, and sample means and population means are
equal.
Sampling distributions are important for inferential statistics. In
practice, one will collect sample data and, from these data, estimate
parameters of the population distribution. Thus, knowledge of the sampling
distribution can be very useful in making inferences about the overall
population.
“One of the most sincere forms of respect is
actually listening to what another has to say.”
-Bryant McGill

More Related Content

Similar to SAMPLING DISTRIBUTION ppt..pptx

Chapter one on sampling distributions.ppt
Chapter one on sampling distributions.pptChapter one on sampling distributions.ppt
Chapter one on sampling distributions.pptFekaduAman
 
A study on the ANOVA ANALYSIS OF VARIANCE.pptx
A study on the ANOVA ANALYSIS OF VARIANCE.pptxA study on the ANOVA ANALYSIS OF VARIANCE.pptx
A study on the ANOVA ANALYSIS OF VARIANCE.pptxjibinjohn140
 
Pengenalan Ekonometrika
Pengenalan EkonometrikaPengenalan Ekonometrika
Pengenalan EkonometrikaXYZ Williams
 
Sampling Distribution ofthe Sample Mean.pptx
Sampling Distribution ofthe Sample Mean.pptxSampling Distribution ofthe Sample Mean.pptx
Sampling Distribution ofthe Sample Mean.pptxMaamLyca
 
Discrete probability distributions
Discrete probability distributionsDiscrete probability distributions
Discrete probability distributionsNadeem Uddin
 
Sample sample distribution
Sample sample distributionSample sample distribution
Sample sample distributionNur Suaidah
 
Identifying the sampling distribution module5
Identifying the sampling distribution module5Identifying the sampling distribution module5
Identifying the sampling distribution module5REYEMMANUELILUMBA
 
Quantitative Methods in Business - Lecture (2)
Quantitative Methods in Business - Lecture (2)Quantitative Methods in Business - Lecture (2)
Quantitative Methods in Business - Lecture (2)Mohamed Ramadan
 
Lect w2 measures_of_location_and_spread
Lect w2 measures_of_location_and_spreadLect w2 measures_of_location_and_spread
Lect w2 measures_of_location_and_spreadRione Drevale
 
Module01 basic statistics terms
Module01 basic statistics termsModule01 basic statistics terms
Module01 basic statistics termsREYEMMANUELILUMBA
 
statiscs and probability math college to help student
statiscs and probability math college  to help studentstatiscs and probability math college  to help student
statiscs and probability math college to help studentcharlezeannprodonram
 
Chp11 - Research Methods for Business By Authors Uma Sekaran and Roger Bougie
Chp11  - Research Methods for Business By Authors Uma Sekaran and Roger BougieChp11  - Research Methods for Business By Authors Uma Sekaran and Roger Bougie
Chp11 - Research Methods for Business By Authors Uma Sekaran and Roger BougieHassan Usman
 
Probability Distributions.pdf
Probability Distributions.pdfProbability Distributions.pdf
Probability Distributions.pdfShivakumar B N
 
Probability distribution of a random variable module
Probability distribution of a random variable moduleProbability distribution of a random variable module
Probability distribution of a random variable moduleMelody01082019
 
PSUnit_III_Lesson_2_Finding_the_Mean _and_Variance_of_the_Sampling_Distributi...
PSUnit_III_Lesson_2_Finding_the_Mean _and_Variance_of_the_Sampling_Distributi...PSUnit_III_Lesson_2_Finding_the_Mean _and_Variance_of_the_Sampling_Distributi...
PSUnit_III_Lesson_2_Finding_the_Mean _and_Variance_of_the_Sampling_Distributi...harlene9
 
Sampling distribution.pptx
Sampling distribution.pptxSampling distribution.pptx
Sampling distribution.pptxssusera0e0e9
 
05 samplingdistributions
05 samplingdistributions05 samplingdistributions
05 samplingdistributionsShaukat shahee
 
Lecture 5 Sampling distribution of sample mean.pptx
Lecture 5 Sampling distribution of sample mean.pptxLecture 5 Sampling distribution of sample mean.pptx
Lecture 5 Sampling distribution of sample mean.pptxshakirRahman10
 

Similar to SAMPLING DISTRIBUTION ppt..pptx (20)

Chapter one on sampling distributions.ppt
Chapter one on sampling distributions.pptChapter one on sampling distributions.ppt
Chapter one on sampling distributions.ppt
 
A study on the ANOVA ANALYSIS OF VARIANCE.pptx
A study on the ANOVA ANALYSIS OF VARIANCE.pptxA study on the ANOVA ANALYSIS OF VARIANCE.pptx
A study on the ANOVA ANALYSIS OF VARIANCE.pptx
 
Pengenalan Ekonometrika
Pengenalan EkonometrikaPengenalan Ekonometrika
Pengenalan Ekonometrika
 
Sampling Distribution ofthe Sample Mean.pptx
Sampling Distribution ofthe Sample Mean.pptxSampling Distribution ofthe Sample Mean.pptx
Sampling Distribution ofthe Sample Mean.pptx
 
Discrete probability distributions
Discrete probability distributionsDiscrete probability distributions
Discrete probability distributions
 
Sample sample distribution
Sample sample distributionSample sample distribution
Sample sample distribution
 
Identifying the sampling distribution module5
Identifying the sampling distribution module5Identifying the sampling distribution module5
Identifying the sampling distribution module5
 
Quantitative Methods in Business - Lecture (2)
Quantitative Methods in Business - Lecture (2)Quantitative Methods in Business - Lecture (2)
Quantitative Methods in Business - Lecture (2)
 
Lect w2 measures_of_location_and_spread
Lect w2 measures_of_location_and_spreadLect w2 measures_of_location_and_spread
Lect w2 measures_of_location_and_spread
 
Module01 basic statistics terms
Module01 basic statistics termsModule01 basic statistics terms
Module01 basic statistics terms
 
Lab7
Lab7Lab7
Lab7
 
statiscs and probability math college to help student
statiscs and probability math college  to help studentstatiscs and probability math college  to help student
statiscs and probability math college to help student
 
Chp11 - Research Methods for Business By Authors Uma Sekaran and Roger Bougie
Chp11  - Research Methods for Business By Authors Uma Sekaran and Roger BougieChp11  - Research Methods for Business By Authors Uma Sekaran and Roger Bougie
Chp11 - Research Methods for Business By Authors Uma Sekaran and Roger Bougie
 
Probability Distributions.pdf
Probability Distributions.pdfProbability Distributions.pdf
Probability Distributions.pdf
 
Statistics - Basics
Statistics - BasicsStatistics - Basics
Statistics - Basics
 
Probability distribution of a random variable module
Probability distribution of a random variable moduleProbability distribution of a random variable module
Probability distribution of a random variable module
 
PSUnit_III_Lesson_2_Finding_the_Mean _and_Variance_of_the_Sampling_Distributi...
PSUnit_III_Lesson_2_Finding_the_Mean _and_Variance_of_the_Sampling_Distributi...PSUnit_III_Lesson_2_Finding_the_Mean _and_Variance_of_the_Sampling_Distributi...
PSUnit_III_Lesson_2_Finding_the_Mean _and_Variance_of_the_Sampling_Distributi...
 
Sampling distribution.pptx
Sampling distribution.pptxSampling distribution.pptx
Sampling distribution.pptx
 
05 samplingdistributions
05 samplingdistributions05 samplingdistributions
05 samplingdistributions
 
Lecture 5 Sampling distribution of sample mean.pptx
Lecture 5 Sampling distribution of sample mean.pptxLecture 5 Sampling distribution of sample mean.pptx
Lecture 5 Sampling distribution of sample mean.pptx
 

More from MarkJohnPedragetaMun

Session Presentation - The Nature of Reading.pptx
Session Presentation - The Nature of Reading.pptxSession Presentation - The Nature of Reading.pptx
Session Presentation - The Nature of Reading.pptxMarkJohnPedragetaMun
 
3 r’s PRINCIPLES AGRI-CROP JOY C,.pptx
3 r’s  PRINCIPLES AGRI-CROP JOY C,.pptx3 r’s  PRINCIPLES AGRI-CROP JOY C,.pptx
3 r’s PRINCIPLES AGRI-CROP JOY C,.pptxMarkJohnPedragetaMun
 
SUMMATIVE TEST FOR EAPP PERFORM HARVESTING ACTIVITY.pptx
SUMMATIVE TEST FOR EAPP PERFORM HARVESTING ACTIVITY.pptxSUMMATIVE TEST FOR EAPP PERFORM HARVESTING ACTIVITY.pptx
SUMMATIVE TEST FOR EAPP PERFORM HARVESTING ACTIVITY.pptxMarkJohnPedragetaMun
 
AGRICROP...DEN MARK... CASEY PALLAN PRESENTATION.pptx
AGRICROP...DEN MARK... CASEY PALLAN PRESENTATION.pptxAGRICROP...DEN MARK... CASEY PALLAN PRESENTATION.pptx
AGRICROP...DEN MARK... CASEY PALLAN PRESENTATION.pptxMarkJohnPedragetaMun
 
MEETING WITH THE PARENTS-FINAL PPT.pptx
MEETING WITH THE PARENTS-FINAL PPT.pptxMEETING WITH THE PARENTS-FINAL PPT.pptx
MEETING WITH THE PARENTS-FINAL PPT.pptxMarkJohnPedragetaMun
 
SCRIPT VIRTUAL 14TH GRADUATION, 6TH COMPLETION AND RECOGNITION RITES OF MHS.pptx
SCRIPT VIRTUAL 14TH GRADUATION, 6TH COMPLETION AND RECOGNITION RITES OF MHS.pptxSCRIPT VIRTUAL 14TH GRADUATION, 6TH COMPLETION AND RECOGNITION RITES OF MHS.pptx
SCRIPT VIRTUAL 14TH GRADUATION, 6TH COMPLETION AND RECOGNITION RITES OF MHS.pptxMarkJohnPedragetaMun
 
Buwan ng Wikang Pambansa 2022.docx
Buwan ng Wikang Pambansa 2022.docxBuwan ng Wikang Pambansa 2022.docx
Buwan ng Wikang Pambansa 2022.docxMarkJohnPedragetaMun
 

More from MarkJohnPedragetaMun (10)

Session Presentation - The Nature of Reading.pptx
Session Presentation - The Nature of Reading.pptxSession Presentation - The Nature of Reading.pptx
Session Presentation - The Nature of Reading.pptx
 
year end report mundaa.pptx
year end report mundaa.pptxyear end report mundaa.pptx
year end report mundaa.pptx
 
MYJOURNAL.pptx
MYJOURNAL.pptxMYJOURNAL.pptx
MYJOURNAL.pptx
 
3 r’s PRINCIPLES AGRI-CROP JOY C,.pptx
3 r’s  PRINCIPLES AGRI-CROP JOY C,.pptx3 r’s  PRINCIPLES AGRI-CROP JOY C,.pptx
3 r’s PRINCIPLES AGRI-CROP JOY C,.pptx
 
SUMMATIVE TEST FOR EAPP PERFORM HARVESTING ACTIVITY.pptx
SUMMATIVE TEST FOR EAPP PERFORM HARVESTING ACTIVITY.pptxSUMMATIVE TEST FOR EAPP PERFORM HARVESTING ACTIVITY.pptx
SUMMATIVE TEST FOR EAPP PERFORM HARVESTING ACTIVITY.pptx
 
AGRICROP...DEN MARK... CASEY PALLAN PRESENTATION.pptx
AGRICROP...DEN MARK... CASEY PALLAN PRESENTATION.pptxAGRICROP...DEN MARK... CASEY PALLAN PRESENTATION.pptx
AGRICROP...DEN MARK... CASEY PALLAN PRESENTATION.pptx
 
MEETING WITH THE PARENTS-FINAL PPT.pptx
MEETING WITH THE PARENTS-FINAL PPT.pptxMEETING WITH THE PARENTS-FINAL PPT.pptx
MEETING WITH THE PARENTS-FINAL PPT.pptx
 
SCRIPT VIRTUAL 14TH GRADUATION, 6TH COMPLETION AND RECOGNITION RITES OF MHS.pptx
SCRIPT VIRTUAL 14TH GRADUATION, 6TH COMPLETION AND RECOGNITION RITES OF MHS.pptxSCRIPT VIRTUAL 14TH GRADUATION, 6TH COMPLETION AND RECOGNITION RITES OF MHS.pptx
SCRIPT VIRTUAL 14TH GRADUATION, 6TH COMPLETION AND RECOGNITION RITES OF MHS.pptx
 
M.A CLASS PSYCOLOGY.pptx
M.A CLASS PSYCOLOGY.pptxM.A CLASS PSYCOLOGY.pptx
M.A CLASS PSYCOLOGY.pptx
 
Buwan ng Wikang Pambansa 2022.docx
Buwan ng Wikang Pambansa 2022.docxBuwan ng Wikang Pambansa 2022.docx
Buwan ng Wikang Pambansa 2022.docx
 

Recently uploaded

Graduate Outcomes Presentation Slides - English (v3).pptx
Graduate Outcomes Presentation Slides - English (v3).pptxGraduate Outcomes Presentation Slides - English (v3).pptx
Graduate Outcomes Presentation Slides - English (v3).pptxneillewis46
 
Spring gala 2024 photo slideshow - Celebrating School-Community Partnerships
Spring gala 2024 photo slideshow - Celebrating School-Community PartnershipsSpring gala 2024 photo slideshow - Celebrating School-Community Partnerships
Spring gala 2024 photo slideshow - Celebrating School-Community Partnershipsexpandedwebsite
 
DEMONSTRATION LESSON IN ENGLISH 4 MATATAG CURRICULUM
DEMONSTRATION LESSON IN ENGLISH 4 MATATAG CURRICULUMDEMONSTRATION LESSON IN ENGLISH 4 MATATAG CURRICULUM
DEMONSTRATION LESSON IN ENGLISH 4 MATATAG CURRICULUMELOISARIVERA8
 
TỔNG HỢP HƠN 100 ĐỀ THI THỬ TỐT NGHIỆP THPT TOÁN 2024 - TỪ CÁC TRƯỜNG, TRƯỜNG...
TỔNG HỢP HƠN 100 ĐỀ THI THỬ TỐT NGHIỆP THPT TOÁN 2024 - TỪ CÁC TRƯỜNG, TRƯỜNG...TỔNG HỢP HƠN 100 ĐỀ THI THỬ TỐT NGHIỆP THPT TOÁN 2024 - TỪ CÁC TRƯỜNG, TRƯỜNG...
TỔNG HỢP HƠN 100 ĐỀ THI THỬ TỐT NGHIỆP THPT TOÁN 2024 - TỪ CÁC TRƯỜNG, TRƯỜNG...Nguyen Thanh Tu Collection
 
會考英聽會考英聽會考英聽會考英聽會考英聽會考英聽會考英聽會考英聽會考英聽會考英聽
會考英聽會考英聽會考英聽會考英聽會考英聽會考英聽會考英聽會考英聽會考英聽會考英聽會考英聽會考英聽會考英聽會考英聽會考英聽會考英聽會考英聽會考英聽會考英聽會考英聽
會考英聽會考英聽會考英聽會考英聽會考英聽會考英聽會考英聽會考英聽會考英聽會考英聽中 央社
 
Basic Civil Engineering notes on Transportation Engineering & Modes of Transport
Basic Civil Engineering notes on Transportation Engineering & Modes of TransportBasic Civil Engineering notes on Transportation Engineering & Modes of Transport
Basic Civil Engineering notes on Transportation Engineering & Modes of TransportDenish Jangid
 
How to Send Pro Forma Invoice to Your Customers in Odoo 17
How to Send Pro Forma Invoice to Your Customers in Odoo 17How to Send Pro Forma Invoice to Your Customers in Odoo 17
How to Send Pro Forma Invoice to Your Customers in Odoo 17Celine George
 
Rich Dad Poor Dad ( PDFDrive.com )--.pdf
Rich Dad Poor Dad ( PDFDrive.com )--.pdfRich Dad Poor Dad ( PDFDrive.com )--.pdf
Rich Dad Poor Dad ( PDFDrive.com )--.pdfJerry Chew
 
PSYPACT- Practicing Over State Lines May 2024.pptx
PSYPACT- Practicing Over State Lines May 2024.pptxPSYPACT- Practicing Over State Lines May 2024.pptx
PSYPACT- Practicing Over State Lines May 2024.pptxMarlene Maheu
 
diagnosting testing bsc 2nd sem.pptx....
diagnosting testing bsc 2nd sem.pptx....diagnosting testing bsc 2nd sem.pptx....
diagnosting testing bsc 2nd sem.pptx....Ritu480198
 
Analyzing and resolving a communication crisis in Dhaka textiles LTD.pptx
Analyzing and resolving a communication crisis in Dhaka textiles LTD.pptxAnalyzing and resolving a communication crisis in Dhaka textiles LTD.pptx
Analyzing and resolving a communication crisis in Dhaka textiles LTD.pptxLimon Prince
 
COMMUNICATING NEGATIVE NEWS - APPROACHES .pptx
COMMUNICATING NEGATIVE NEWS - APPROACHES .pptxCOMMUNICATING NEGATIVE NEWS - APPROACHES .pptx
COMMUNICATING NEGATIVE NEWS - APPROACHES .pptxannathomasp01
 
Contoh Aksi Nyata Refleksi Diri ( NUR ).pdf
Contoh Aksi Nyata Refleksi Diri ( NUR ).pdfContoh Aksi Nyata Refleksi Diri ( NUR ).pdf
Contoh Aksi Nyata Refleksi Diri ( NUR ).pdfcupulin
 
Spellings Wk 4 and Wk 5 for Grade 4 at CAPS
Spellings Wk 4 and Wk 5 for Grade 4 at CAPSSpellings Wk 4 and Wk 5 for Grade 4 at CAPS
Spellings Wk 4 and Wk 5 for Grade 4 at CAPSAnaAcapella
 
8 Tips for Effective Working Capital Management
8 Tips for Effective Working Capital Management8 Tips for Effective Working Capital Management
8 Tips for Effective Working Capital ManagementMBA Assignment Experts
 
Improved Approval Flow in Odoo 17 Studio App
Improved Approval Flow in Odoo 17 Studio AppImproved Approval Flow in Odoo 17 Studio App
Improved Approval Flow in Odoo 17 Studio AppCeline George
 
Major project report on Tata Motors and its marketing strategies
Major project report on Tata Motors and its marketing strategiesMajor project report on Tata Motors and its marketing strategies
Major project report on Tata Motors and its marketing strategiesAmanpreetKaur157993
 
When Quality Assurance Meets Innovation in Higher Education - Report launch w...
When Quality Assurance Meets Innovation in Higher Education - Report launch w...When Quality Assurance Meets Innovation in Higher Education - Report launch w...
When Quality Assurance Meets Innovation in Higher Education - Report launch w...Gary Wood
 

Recently uploaded (20)

Graduate Outcomes Presentation Slides - English (v3).pptx
Graduate Outcomes Presentation Slides - English (v3).pptxGraduate Outcomes Presentation Slides - English (v3).pptx
Graduate Outcomes Presentation Slides - English (v3).pptx
 
Spring gala 2024 photo slideshow - Celebrating School-Community Partnerships
Spring gala 2024 photo slideshow - Celebrating School-Community PartnershipsSpring gala 2024 photo slideshow - Celebrating School-Community Partnerships
Spring gala 2024 photo slideshow - Celebrating School-Community Partnerships
 
DEMONSTRATION LESSON IN ENGLISH 4 MATATAG CURRICULUM
DEMONSTRATION LESSON IN ENGLISH 4 MATATAG CURRICULUMDEMONSTRATION LESSON IN ENGLISH 4 MATATAG CURRICULUM
DEMONSTRATION LESSON IN ENGLISH 4 MATATAG CURRICULUM
 
Including Mental Health Support in Project Delivery, 14 May.pdf
Including Mental Health Support in Project Delivery, 14 May.pdfIncluding Mental Health Support in Project Delivery, 14 May.pdf
Including Mental Health Support in Project Delivery, 14 May.pdf
 
TỔNG HỢP HƠN 100 ĐỀ THI THỬ TỐT NGHIỆP THPT TOÁN 2024 - TỪ CÁC TRƯỜNG, TRƯỜNG...
TỔNG HỢP HƠN 100 ĐỀ THI THỬ TỐT NGHIỆP THPT TOÁN 2024 - TỪ CÁC TRƯỜNG, TRƯỜNG...TỔNG HỢP HƠN 100 ĐỀ THI THỬ TỐT NGHIỆP THPT TOÁN 2024 - TỪ CÁC TRƯỜNG, TRƯỜNG...
TỔNG HỢP HƠN 100 ĐỀ THI THỬ TỐT NGHIỆP THPT TOÁN 2024 - TỪ CÁC TRƯỜNG, TRƯỜNG...
 
VAMOS CUIDAR DO NOSSO PLANETA! .
VAMOS CUIDAR DO NOSSO PLANETA!                    .VAMOS CUIDAR DO NOSSO PLANETA!                    .
VAMOS CUIDAR DO NOSSO PLANETA! .
 
會考英聽會考英聽會考英聽會考英聽會考英聽會考英聽會考英聽會考英聽會考英聽會考英聽
會考英聽會考英聽會考英聽會考英聽會考英聽會考英聽會考英聽會考英聽會考英聽會考英聽會考英聽會考英聽會考英聽會考英聽會考英聽會考英聽會考英聽會考英聽會考英聽會考英聽
會考英聽會考英聽會考英聽會考英聽會考英聽會考英聽會考英聽會考英聽會考英聽會考英聽
 
Basic Civil Engineering notes on Transportation Engineering & Modes of Transport
Basic Civil Engineering notes on Transportation Engineering & Modes of TransportBasic Civil Engineering notes on Transportation Engineering & Modes of Transport
Basic Civil Engineering notes on Transportation Engineering & Modes of Transport
 
How to Send Pro Forma Invoice to Your Customers in Odoo 17
How to Send Pro Forma Invoice to Your Customers in Odoo 17How to Send Pro Forma Invoice to Your Customers in Odoo 17
How to Send Pro Forma Invoice to Your Customers in Odoo 17
 
Rich Dad Poor Dad ( PDFDrive.com )--.pdf
Rich Dad Poor Dad ( PDFDrive.com )--.pdfRich Dad Poor Dad ( PDFDrive.com )--.pdf
Rich Dad Poor Dad ( PDFDrive.com )--.pdf
 
PSYPACT- Practicing Over State Lines May 2024.pptx
PSYPACT- Practicing Over State Lines May 2024.pptxPSYPACT- Practicing Over State Lines May 2024.pptx
PSYPACT- Practicing Over State Lines May 2024.pptx
 
diagnosting testing bsc 2nd sem.pptx....
diagnosting testing bsc 2nd sem.pptx....diagnosting testing bsc 2nd sem.pptx....
diagnosting testing bsc 2nd sem.pptx....
 
Analyzing and resolving a communication crisis in Dhaka textiles LTD.pptx
Analyzing and resolving a communication crisis in Dhaka textiles LTD.pptxAnalyzing and resolving a communication crisis in Dhaka textiles LTD.pptx
Analyzing and resolving a communication crisis in Dhaka textiles LTD.pptx
 
COMMUNICATING NEGATIVE NEWS - APPROACHES .pptx
COMMUNICATING NEGATIVE NEWS - APPROACHES .pptxCOMMUNICATING NEGATIVE NEWS - APPROACHES .pptx
COMMUNICATING NEGATIVE NEWS - APPROACHES .pptx
 
Contoh Aksi Nyata Refleksi Diri ( NUR ).pdf
Contoh Aksi Nyata Refleksi Diri ( NUR ).pdfContoh Aksi Nyata Refleksi Diri ( NUR ).pdf
Contoh Aksi Nyata Refleksi Diri ( NUR ).pdf
 
Spellings Wk 4 and Wk 5 for Grade 4 at CAPS
Spellings Wk 4 and Wk 5 for Grade 4 at CAPSSpellings Wk 4 and Wk 5 for Grade 4 at CAPS
Spellings Wk 4 and Wk 5 for Grade 4 at CAPS
 
8 Tips for Effective Working Capital Management
8 Tips for Effective Working Capital Management8 Tips for Effective Working Capital Management
8 Tips for Effective Working Capital Management
 
Improved Approval Flow in Odoo 17 Studio App
Improved Approval Flow in Odoo 17 Studio AppImproved Approval Flow in Odoo 17 Studio App
Improved Approval Flow in Odoo 17 Studio App
 
Major project report on Tata Motors and its marketing strategies
Major project report on Tata Motors and its marketing strategiesMajor project report on Tata Motors and its marketing strategies
Major project report on Tata Motors and its marketing strategies
 
When Quality Assurance Meets Innovation in Higher Education - Report launch w...
When Quality Assurance Meets Innovation in Higher Education - Report launch w...When Quality Assurance Meets Innovation in Higher Education - Report launch w...
When Quality Assurance Meets Innovation in Higher Education - Report launch w...
 

SAMPLING DISTRIBUTION ppt..pptx

  • 1. SAMPLING DISTRIBUTION ED 202 – INFERENTIAL STATISTICS Mark John P. Munda Mamlad High School Rommel C. Velasco Zeferino Arroyo High School REPORTERS :
  • 2. Opening Prayer ALMIGHTY, OUR FATHER, WE PRAISE AND THANK YOU FOR THIS DAY. WE COME TO YOU THIS HOUR ASKING FOR YOUR BLESSING AND HELP US AS WE ARE VIRTUALLY GATHERED TOGETHER. WE PRAY FOR GUIDANCE IN THE MATTERS AT HAND AND ASK THAT YOU WOULD CLEARLY SHOW US HOW TO CONDUCT OUR VIRTUAL CLASS WITH A SPIRIT OF JOY AND ENTHUSIASM. GIVE US THE DESIRE TO FIND WAYS AND EXCEL IN OUR CLASS. HELP US TO WORK TOGETHER AND ENCOURAGE EACH OTHER TO EXCELLENCE. WE ASK THAT WE WOULD CHALLENGE EACH OTHER AND GAIN MORE KNOWLEDGE TO REACH HIGHER AND FARTHER TO BE THE BEST WE CAN BE. WE ASK THIS IN THE NAME OF THE LORD JESUS CHRIST, AMEN.
  • 4. What is sampling distribution of sample means? • A sampling distribution of sample means is a frequency distribution using the means computed from all possible random samples of a specific size taken from a population. The means of the samples are less than or greater than the mean of the population. • Using a sampling distribution simplifies the process of making inferences about large amounts of data. For this reason, it is used often as a statistical resource in data science.
  • 5. Sampling Distribution (without and with replacement) • In sampling without replacement, each sample unit of the population has only one chance to be selected in the sample. For example, if one draws a simple random sample such that no unit occurs more than one time in the sample, the sample is drawn without replacement. • If a unit can occur one or more times in the sample, then the sample is drawn with replacement.
  • 6. Population Size and Sample Size • A population is the entire group that you want to draw conclusions about. • A sample is the specific group that you will collect data from. The size of the sample is always less than the total size of the population. • In research, a population doesn’t always refer to people. It can mean a group containing elements of anything you want to study, such as objects, events, organizations, countries, species, organisms, etc.
  • 7. Steps in Constructing the Sampling Distribution of the Means 1. Determine the number of sets of all possible random samples that can be drawn from the given population. 2.List all the possible samples and compute the mean of each sample. 3.Construct the sampling distribution. 4.Construct a histogram of the sampling distribution of the means.
  • 8. SAMPLING DISTRIBUTION OF THE MEANS WITHOUT REPLACEMENT
  • 9. = 1 + 𝑛𝑥 1! + 𝑛 𝑛 − 1 𝑥2 2! + ⋯ Example: A population consists of the numbers 2, 4, 9, 10, and 5. Let us list all possible sample size of 3 from this population and compute the mean of each sample. 1. Determine the number of sets of all possible random samples that can be drawn from the given population by using the formula, nCr, where n is the population size and r is the sample size. nCr = n! r!(n-r)! n = 5 r = 3 There are 10 possible samples of size 3 that can be drawn from the given data. nCr = n! r!(n-r)! = 5! 3!(5-3)! = 5 · 4 · 3! 3!2! = 5 · 4 2 · 1 = 20 2 = 10
  • 10. = 1 + 𝑛𝑥 1! + 𝑛 𝑛 − 1 𝑥2 2! + ⋯ Example: A population consists of the numbers 2, 4, 9, 10, and 5. Let us list all possible sample size of 3 from this population and compute the mean of each sample. 2. List all the possible samples and compute the mean of each sample. 2 4 9 10 5 nCr = 10 X = 2 + 4 + 9 3 _ = 5 Sample Mean 2,4,9 5 2,4,10 5.33 2,4,5 3.67 2,9,10 7 2,9,5 5.33 2,10,5 5.67 4,9,10 7.67 4,9,5 6 4,10,5 6.33 9,10,5 8
  • 11. = 1 + 𝑛𝑥 1! + 𝑛 𝑛 − 1 𝑥2 2! + ⋯ Example: A population consists of the numbers 2, 4, 9, 10, and 5. Let us list all possible sample size of 3 from this population and compute the mean of each sample. 3. Construct the sampling distribution. Sample Mean 2,4,9 5 2,4,10 5.33 2,4,5 3.67 2,9,10 7 2,9,5 5.33 2,10,5 5.67 4,9,10 7.67 4,9,5 6 4,10,5 6.33 9,10,5 8 Sample Mean (x) Frequency Probability 3.67 1 1/10 = 0.10 5 1 1/10 = 0.10 5.33 2 2/10 = 0.20 5.67 1 1/10 = 0.10 6 1 1/10 = 0.10 6.33 1 1/10 = 0.10 7 1 1/10 = 0.10 7.67 1 1/10 = 0.10 8 1 1/10 = 0.10 Total 10 1.00
  • 12. = 1 + 𝑛𝑥 1! + 𝑛 𝑛 − 1 𝑥2 2! + ⋯ Example: A population consists of the numbers 2, 4, 9, 10, and 5. Let us list all possible sample size of 3 from this population and compute the mean of each sample. 4. Construct a histogram of the sampling distribution of the means. Sample Mean (x) Frequency P(x) 3.67 1 1/10 = 0.10 5 1 1/10 = 0.10 5.33 2 2/10 = 0.20 5.67 1 1/10 = 0.10 6 1 1/10 = 0.10 6.33 1 1/10 = 0.10 7 1 1/10 = 0.10 7.67 1 1/10 = 0.10 8 1 1/10 = 0.10 Total 10 1.00 0.40 0.30 0.20 0.10 0 3.67 5 5.33 5.67 6 6.33 7 7.67 8
  • 13. SAMPLING DISTRIBUTION OF THE MEANS WITH REPLACEMENT
  • 14. = 1 + 𝑛𝑥 1! + 𝑛 𝑛 − 1 𝑥2 2! + ⋯ Example: A population consists of three pool balls with the numbers 1, 2, and 3. Two of the balls are selected randomly with replacement. Let us list all possible sample size of 2 from this population and compute the mean of each sample. 1. Determine the number of sets of all possible random samples that can be drawn from the given population by using the formula, P (n, r) = n , where n is the population size and r is the sample size. P (n, r) = n n = 3 r = 2 There are 9 possible samples of size 2 that can be drawn from the given data. R r R r P (n, r) = P (3,2) = 3 = 9 R R 2
  • 15. = 1 + 𝑛𝑥 1! + 𝑛 𝑛 − 1 𝑥2 2! + ⋯ 2. List all the possible samples and compute the mean of each sample. 1 2 3 X = 2 + 4 + 9 3 _ = 5 P (n, r) = n = 9 R r Sample Mean 1,1 1.0 1,2 1.5 1,3 2.0 2,1 1.5 2,2 2.0 2,3 2.5 3,1 2.0 3,2 2.5 3,3 3.0 X = 1 + 1 2 = 1 Example: A population consists of three pool balls with the numbers 1, 2, and 3. Two of the balls are selected randomly with replacement. Let us list all possible sample size of 2 from this population and compute the mean of each sample.
  • 16. = 1 + 𝑛𝑥 1! + 𝑛 𝑛 − 1 𝑥2 2! + ⋯ Example: A population consists of three pool balls with the numbers 1, 2, and 3. Two of the balls are selected randomly with replacement. Let us list all possible sample size of 2 from this population and compute the mean of each sample. 3. Construct the sampling distribution. Sample Mean (x) Frequency Probability 1.0 1 1/9 = 0.11 1.5 2 2/9 = 0.22 2.0 3 3/9 = 0.33 2.5 2 2/9 = 0.22 3.0 1 1/9 = 0.11 Total 9 .99 or 1.00 Sample Mean 1,1 1.0 1,2 1.5 1,3 2.0 2,1 1.5 2,2 2.0 2,3 2.5 3,1 2.0 3,2 2.5 3,3 3.0
  • 17. = 1 + 𝑛𝑥 1! + 𝑛 𝑛 − 1 𝑥2 2! + ⋯ Example: A population consists of three pool balls with the numbers 1, 2, and 3. Two of the balls are selected randomly with replacement. Let us list all possible sample size of 2 from this population and compute the mean of each sample. 4. Construct a histogram of the sampling distribution of the means. Sample Mean (x) Frequency P(x) 1.0 1 1/9 = 0.11 1.5 2 2/9 = 0.22 2.0 3 3/9 = 0.33 2.5 2 2/9 = 0.22 3.0 1 1/9 = 0.11 Total 9 0.99 or 1.00 0.40 0.30 0.20 0.10 0 1.0 1.5 2.0 2.5 3.0 0.45 0.35 0.25 0.15 0.05
  • 18. Generalization Sampling is a statistical procedure that is concerned with the selection of the individual observation; it helps us to make statistical inferences about the population. In sampling, we assume that samples are drawn from the population, and sample means and population means are equal. Sampling distributions are important for inferential statistics. In practice, one will collect sample data and, from these data, estimate parameters of the population distribution. Thus, knowledge of the sampling distribution can be very useful in making inferences about the overall population.
  • 19. “One of the most sincere forms of respect is actually listening to what another has to say.” -Bryant McGill