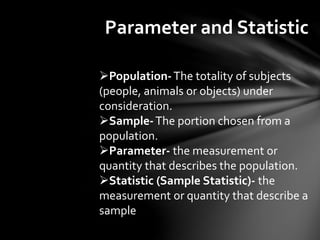
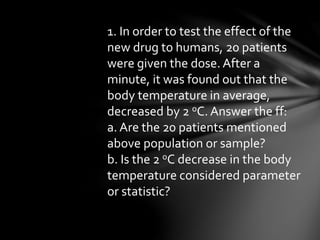
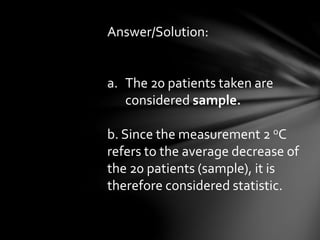
Objectives
distinguishes
between parameter
and statistic.
(M11/12SP-IIId-3)
At the end of the lesson, you
should be able to:
a. distinguishes between parameter and
statistic.
b. create your own definition of parameter
and statistics;
c. perform and cooperate with group mates
in doing activities related to parameter and
statistic;
d. relate importance of parameters and
statistics in our lives.
Presentation of the Lesson
Learning Stations
You will be grouped into three and
prepare 1 whole paper. Each group will be
assigned to every station. When I say “go”
and you will proceed to the next station.
Then, you will take note of the concepts
learned in each station; tasks are given as
well . At the end of the activity, you will
create a comparison table (write it in
manila paper) and present it to the class.
(20 minutes)
Learning Stations
Station 1: Picture Analysis
Station 2:Task Cards
Station 3: Interaction:
AVideo Presentation
Presentation per group
5 minutes
Discussion
Parameter and Statistic
Population-The totality of subjects
(people, animals or objects) under
consideration.
Sample-The portion chosen from a
population.
Parameter- the measurement or
quantity that describes the population.
Statistic (Sample Statistic)- the
measurement or quantity that describe a
sample
BASIS FOR
COMPARISON
STATISTIC PARAMETER
Meaning Statistic is a
measure which
describes a
fraction of
population.
Parameter
refers to a
measure which
describes
population.
Numerical
value
Variable and
Known
Fixed and
Unknown
ComparisonTable
Practice exercise
1. In order to test the effect of the
new drug to humans, 20 patients
were given the dose. After a
minute, it was found out that the
body temperature in average,
decreased by 2 oC. Answer the ff:
a. Are the 20 patients mentioned
above population or sample?
b. Is the 2 oC decrease in the body
temperature considered parameter
or statistic?
Answer/Solution:
a. The 20 patients taken are
considered sample.
b. Since the measurement 2 oC
refers to the average decrease of
the 20 patients (sample), it is
therefore considered statistic.
2. A researcher wants to know
the average weight of females
aged 22 years or older in Iloilo
City.The researcher obtains the
average weight of 54 kg, from a
random sample of 40 females.
Describe the given quantity as
parameter or statistic.
Answer/Solution:
In the given situation, the
statistics are the average weight
of 54 kg, calculated from a simple
random sample of 40 females in
Iloilo City while the parameter is
the mean weight of all females
aged 22 years or older.
Real-life Examples/ situations
A statistic is a measure based on a
sample.
A parameter is a measure of an
entire population.
Example of parameter:The average
amount of left handed people in
Bo. Obrero, Lapuz.
Example of Statistic:The average
amount of left handed people in Bo
Obrero National High School.
Let’s generalize…
1. How will you compare or
distinguish parameter from
statistic?
2. Cite real life situations or
examples related to parameter
and statistic..
Direction: Find a pair and create a concept
map on how mastered the lesson.
Rubrics:
20 points- correct concept and answer with examples
15 points- partially correct concept and answer with
examples
10 points – partially correct concept,answer and
examples
5 points- incorrect answer
Assignment
Create a powerpoint presentation/video
presentation on parameter and statistic
and send it thru messenger (FB).
Rubrics:
50 points- correct concept and answer with examples
30 points- partially correct concept and answer with
examples
25 points – partially correct concept,answer and examples
20 ponits- incorrect answer
parameter and statistic - Copy.pptx

parameter and statistic - Copy.pptx

  • 2.
  • 3.
    At the endof the lesson, you should be able to: a. distinguishes between parameter and statistic. b. create your own definition of parameter and statistics; c. perform and cooperate with group mates in doing activities related to parameter and statistic; d. relate importance of parameters and statistics in our lives.
  • 4.
  • 5.
    Learning Stations You willbe grouped into three and prepare 1 whole paper. Each group will be assigned to every station. When I say “go” and you will proceed to the next station. Then, you will take note of the concepts learned in each station; tasks are given as well . At the end of the activity, you will create a comparison table (write it in manila paper) and present it to the class. (20 minutes)
  • 6.
    Learning Stations Station 1:Picture Analysis Station 2:Task Cards Station 3: Interaction: AVideo Presentation
  • 7.
  • 8.
  • 9.
    Parameter and Statistic Population-Thetotality of subjects (people, animals or objects) under consideration. Sample-The portion chosen from a population. Parameter- the measurement or quantity that describes the population. Statistic (Sample Statistic)- the measurement or quantity that describe a sample
  • 10.
    BASIS FOR COMPARISON STATISTIC PARAMETER MeaningStatistic is a measure which describes a fraction of population. Parameter refers to a measure which describes population. Numerical value Variable and Known Fixed and Unknown ComparisonTable
  • 11.
  • 12.
    1. In orderto test the effect of the new drug to humans, 20 patients were given the dose. After a minute, it was found out that the body temperature in average, decreased by 2 oC. Answer the ff: a. Are the 20 patients mentioned above population or sample? b. Is the 2 oC decrease in the body temperature considered parameter or statistic?
  • 13.
    Answer/Solution: a. The 20patients taken are considered sample. b. Since the measurement 2 oC refers to the average decrease of the 20 patients (sample), it is therefore considered statistic.
  • 14.
    2. A researcherwants to know the average weight of females aged 22 years or older in Iloilo City.The researcher obtains the average weight of 54 kg, from a random sample of 40 females. Describe the given quantity as parameter or statistic.
  • 15.
    Answer/Solution: In the givensituation, the statistics are the average weight of 54 kg, calculated from a simple random sample of 40 females in Iloilo City while the parameter is the mean weight of all females aged 22 years or older.
  • 16.
  • 17.
    A statistic isa measure based on a sample. A parameter is a measure of an entire population. Example of parameter:The average amount of left handed people in Bo. Obrero, Lapuz. Example of Statistic:The average amount of left handed people in Bo Obrero National High School.
  • 18.
  • 19.
    1. How willyou compare or distinguish parameter from statistic? 2. Cite real life situations or examples related to parameter and statistic..
  • 20.
    Direction: Find apair and create a concept map on how mastered the lesson. Rubrics: 20 points- correct concept and answer with examples 15 points- partially correct concept and answer with examples 10 points – partially correct concept,answer and examples 5 points- incorrect answer
  • 21.
  • 22.
    Create a powerpointpresentation/video presentation on parameter and statistic and send it thru messenger (FB). Rubrics: 50 points- correct concept and answer with examples 30 points- partially correct concept and answer with examples 25 points – partially correct concept,answer and examples 20 ponits- incorrect answer