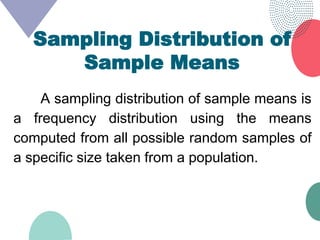
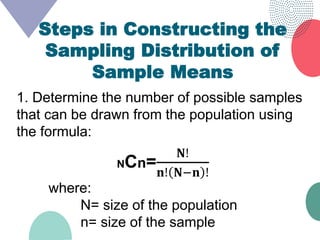
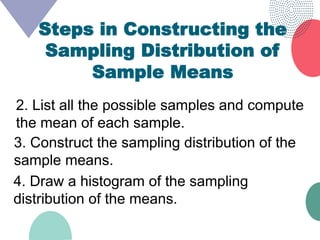
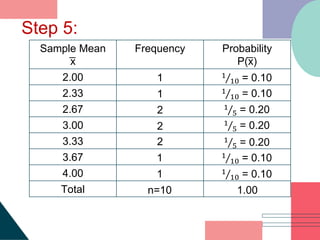
1. The document describes how to construct a sampling distribution of sample means from a population. It provides steps to list all possible samples, compute the mean of each sample, and construct a frequency distribution of the sample means.
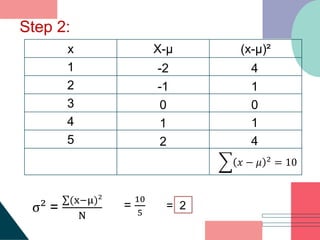
2. It also gives steps to find the mean and variance of the sampling distribution, which includes computing the population mean and variance, determining possible samples, computing sample means, and calculating the mean and variance of the sampling distribution.
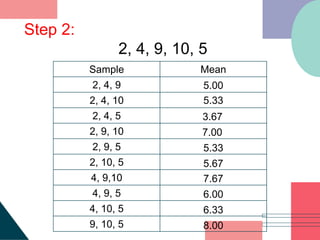
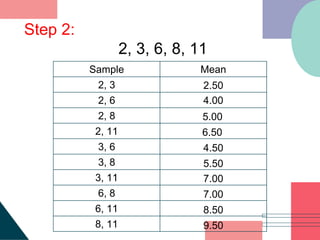
3. Examples are provided to demonstrate constructing sampling distributions of sample means and finding the mean and variance of the distributions using populations with different sample sizes.