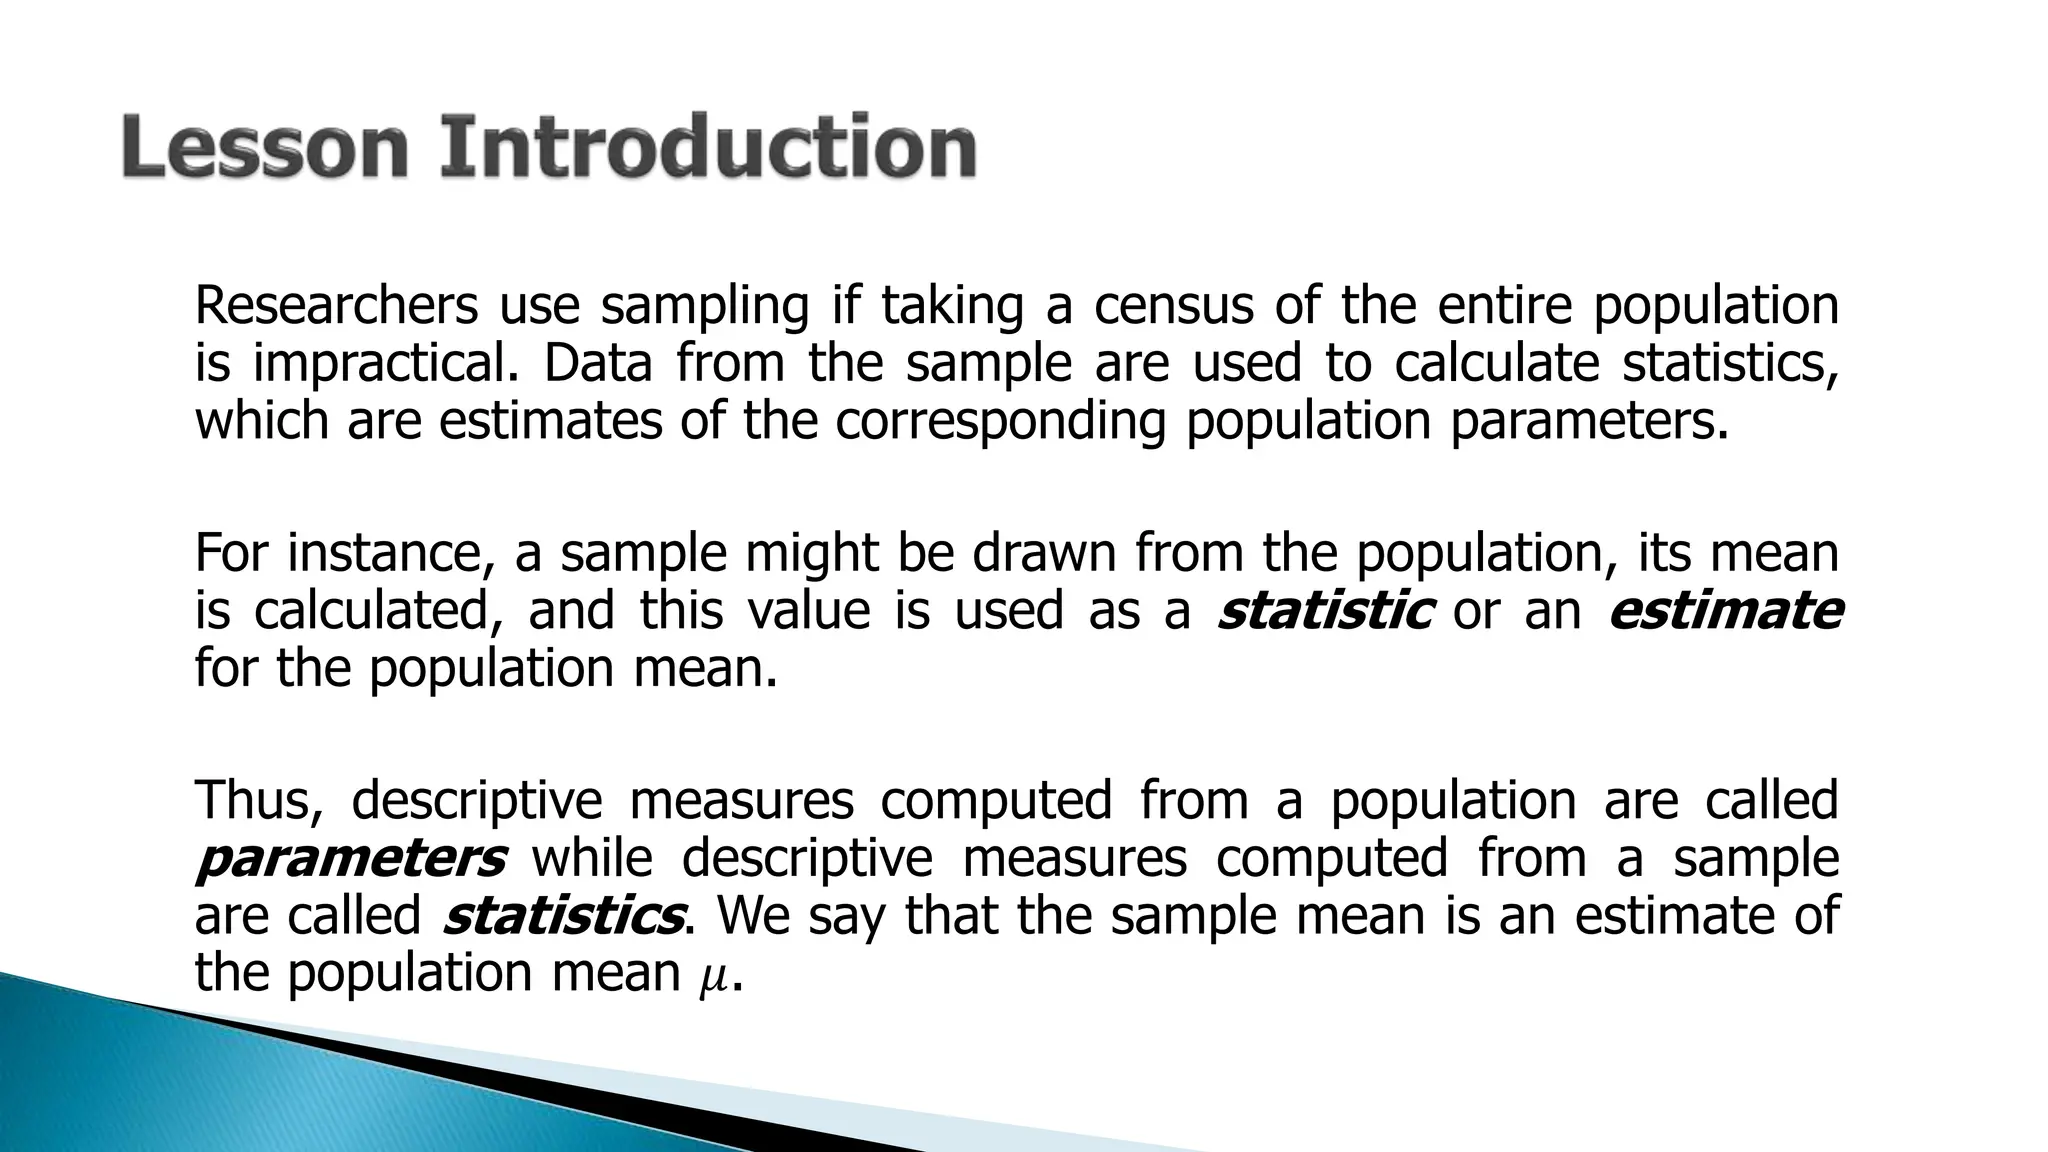
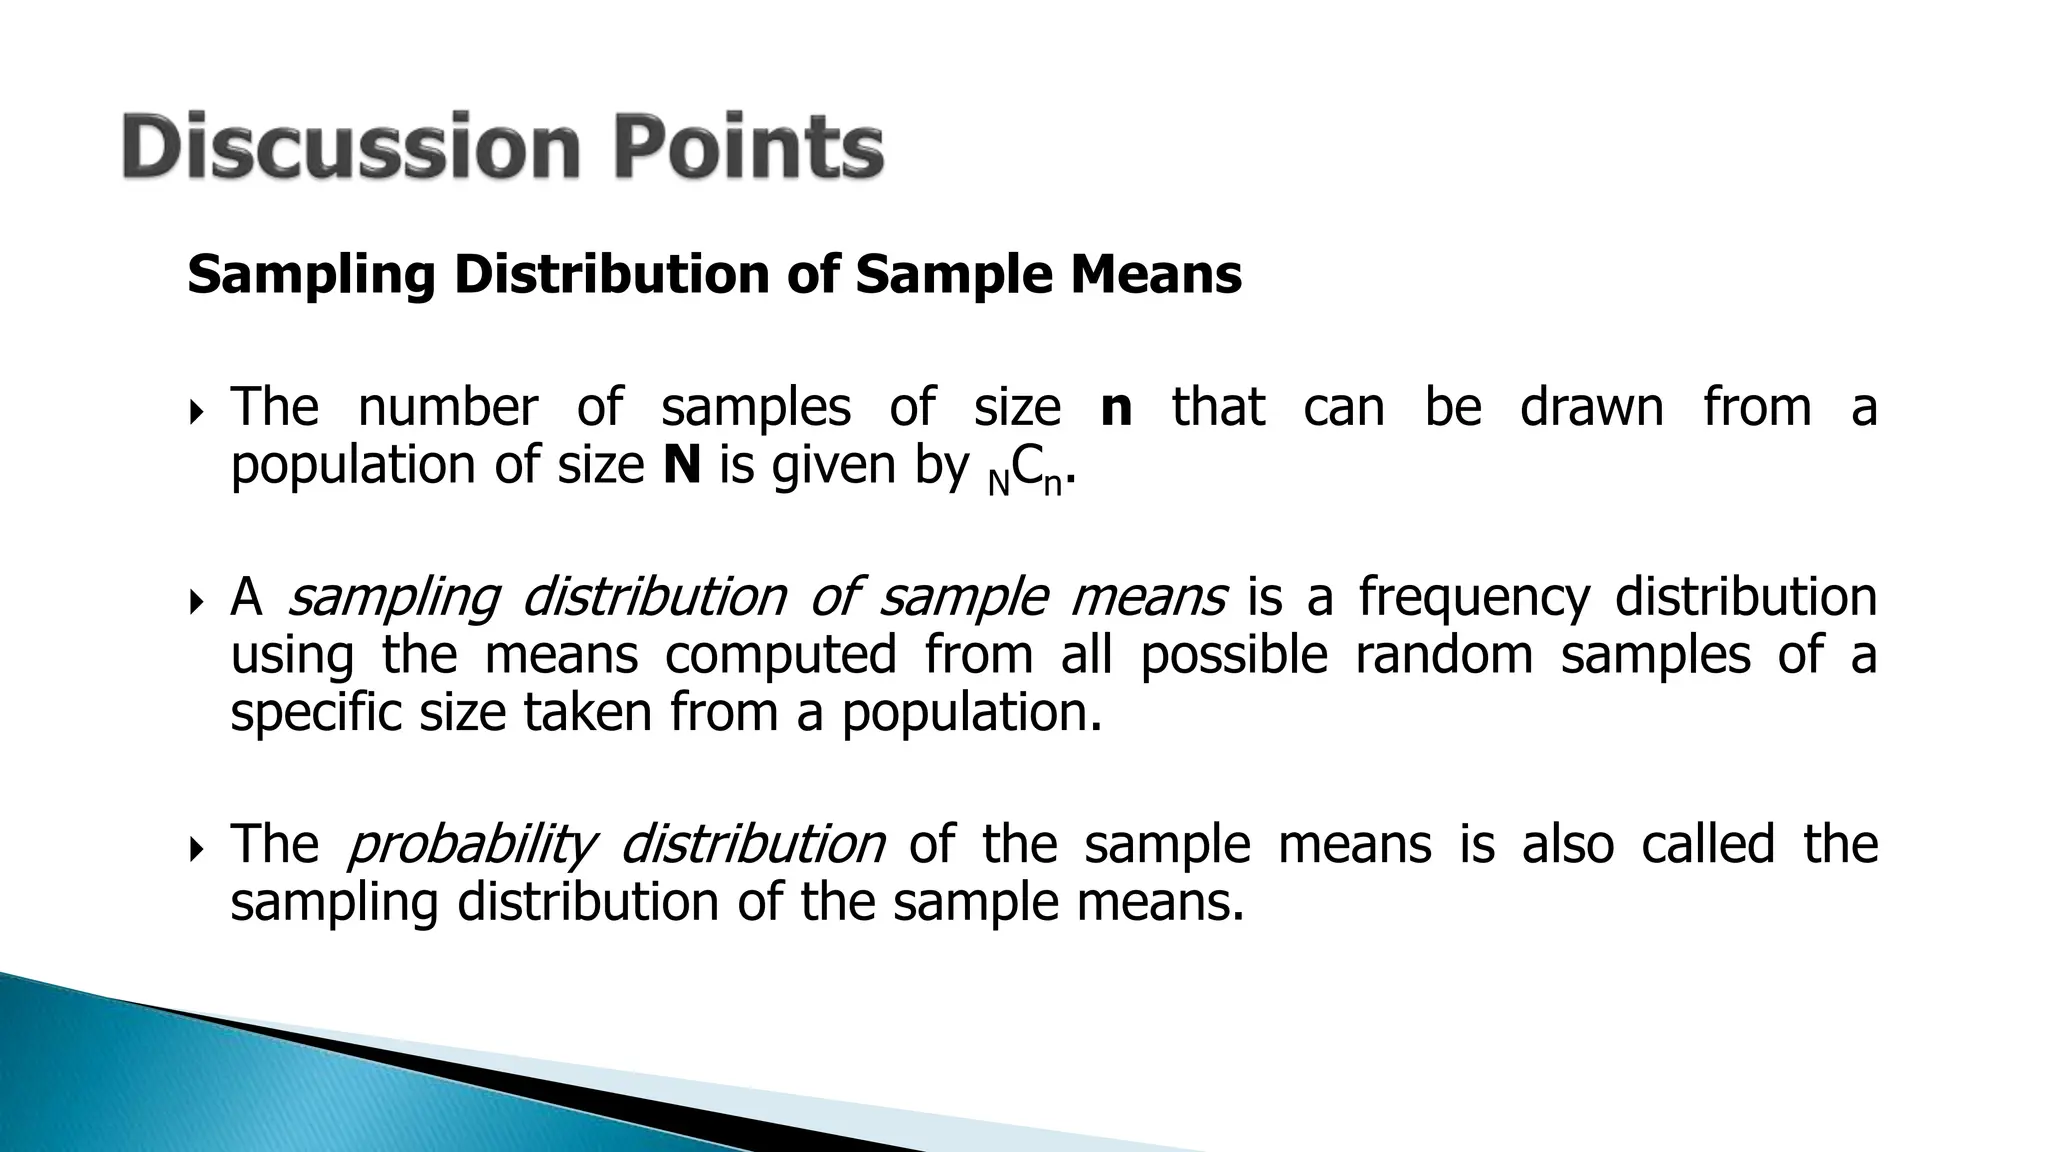
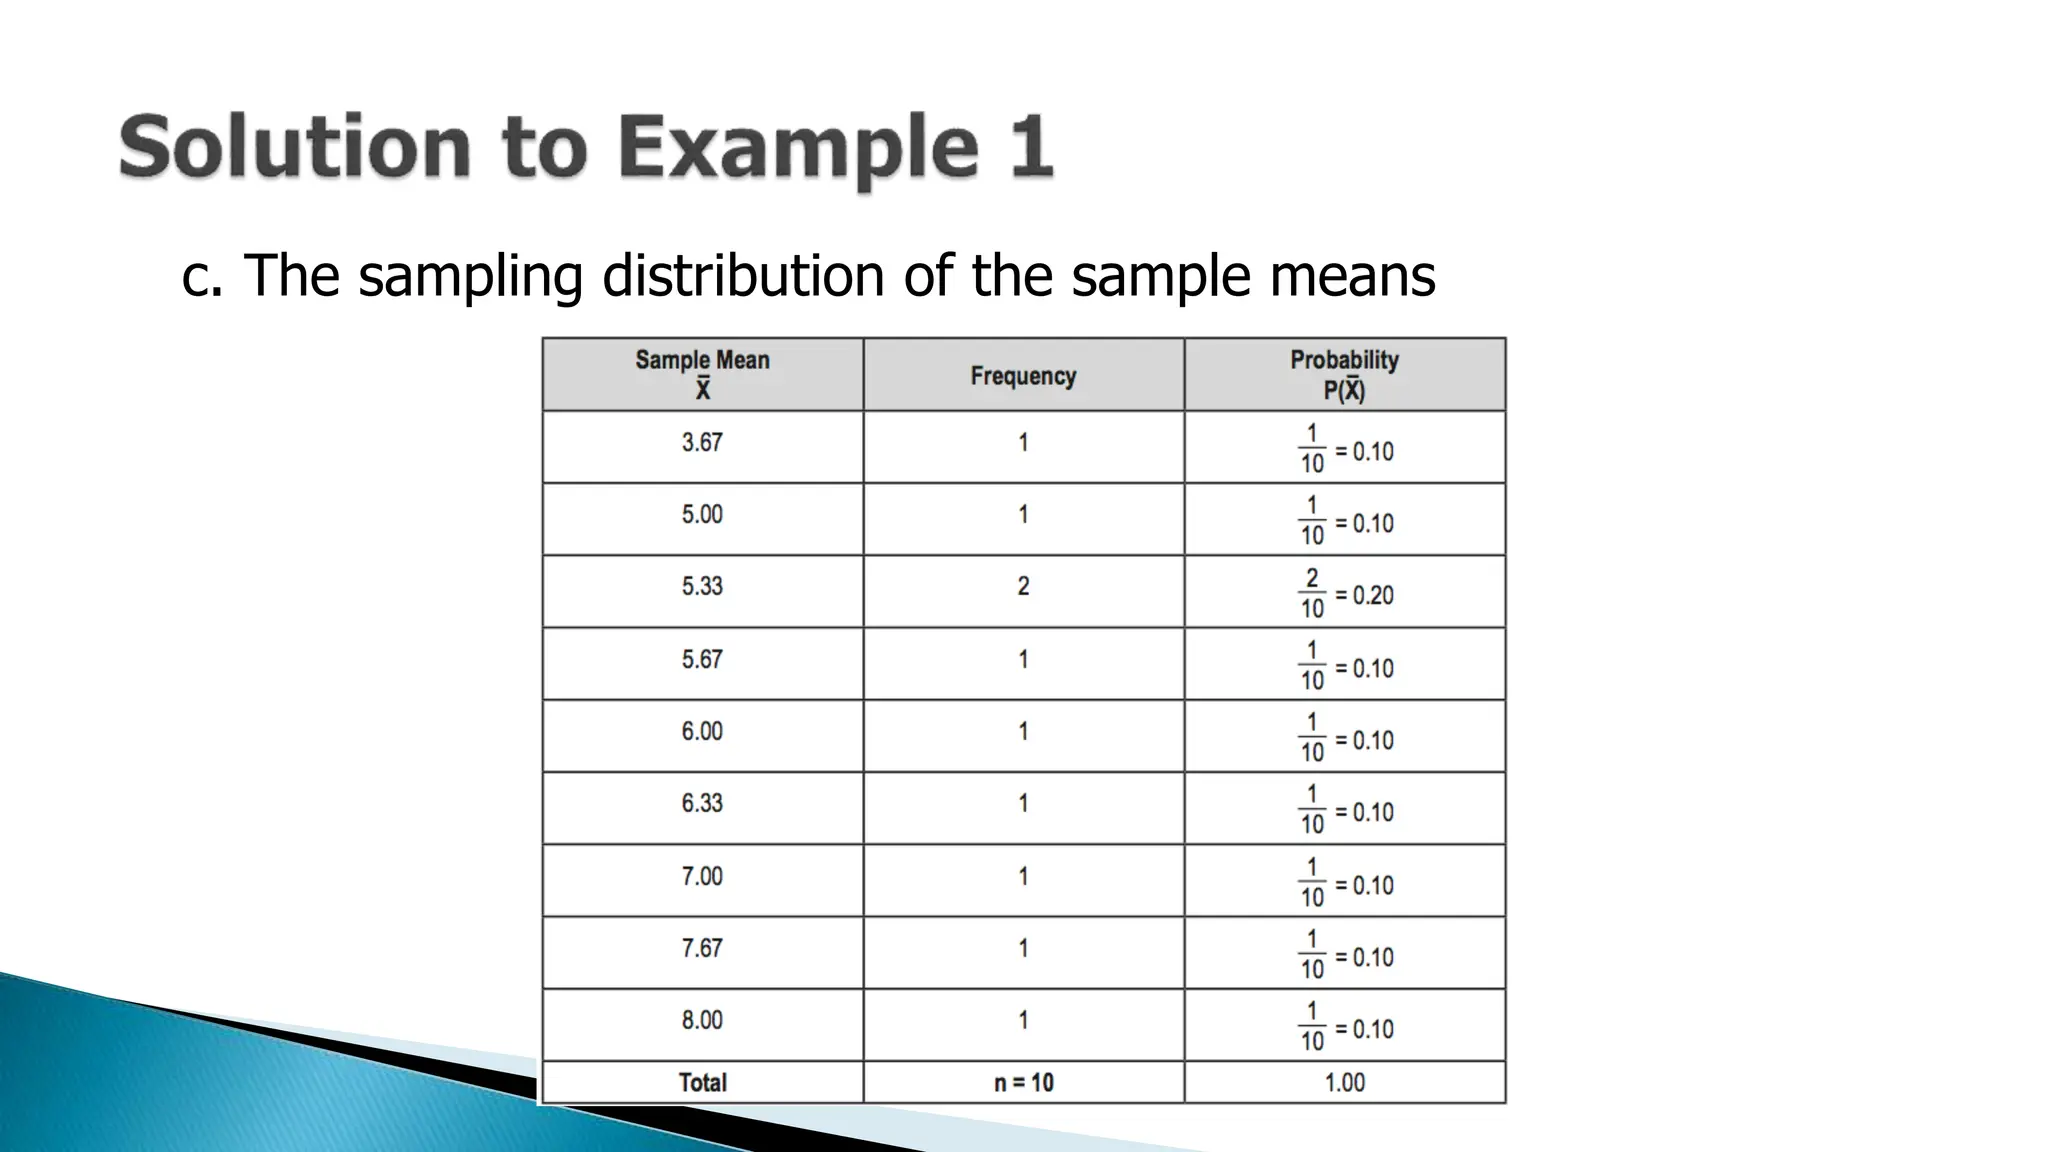
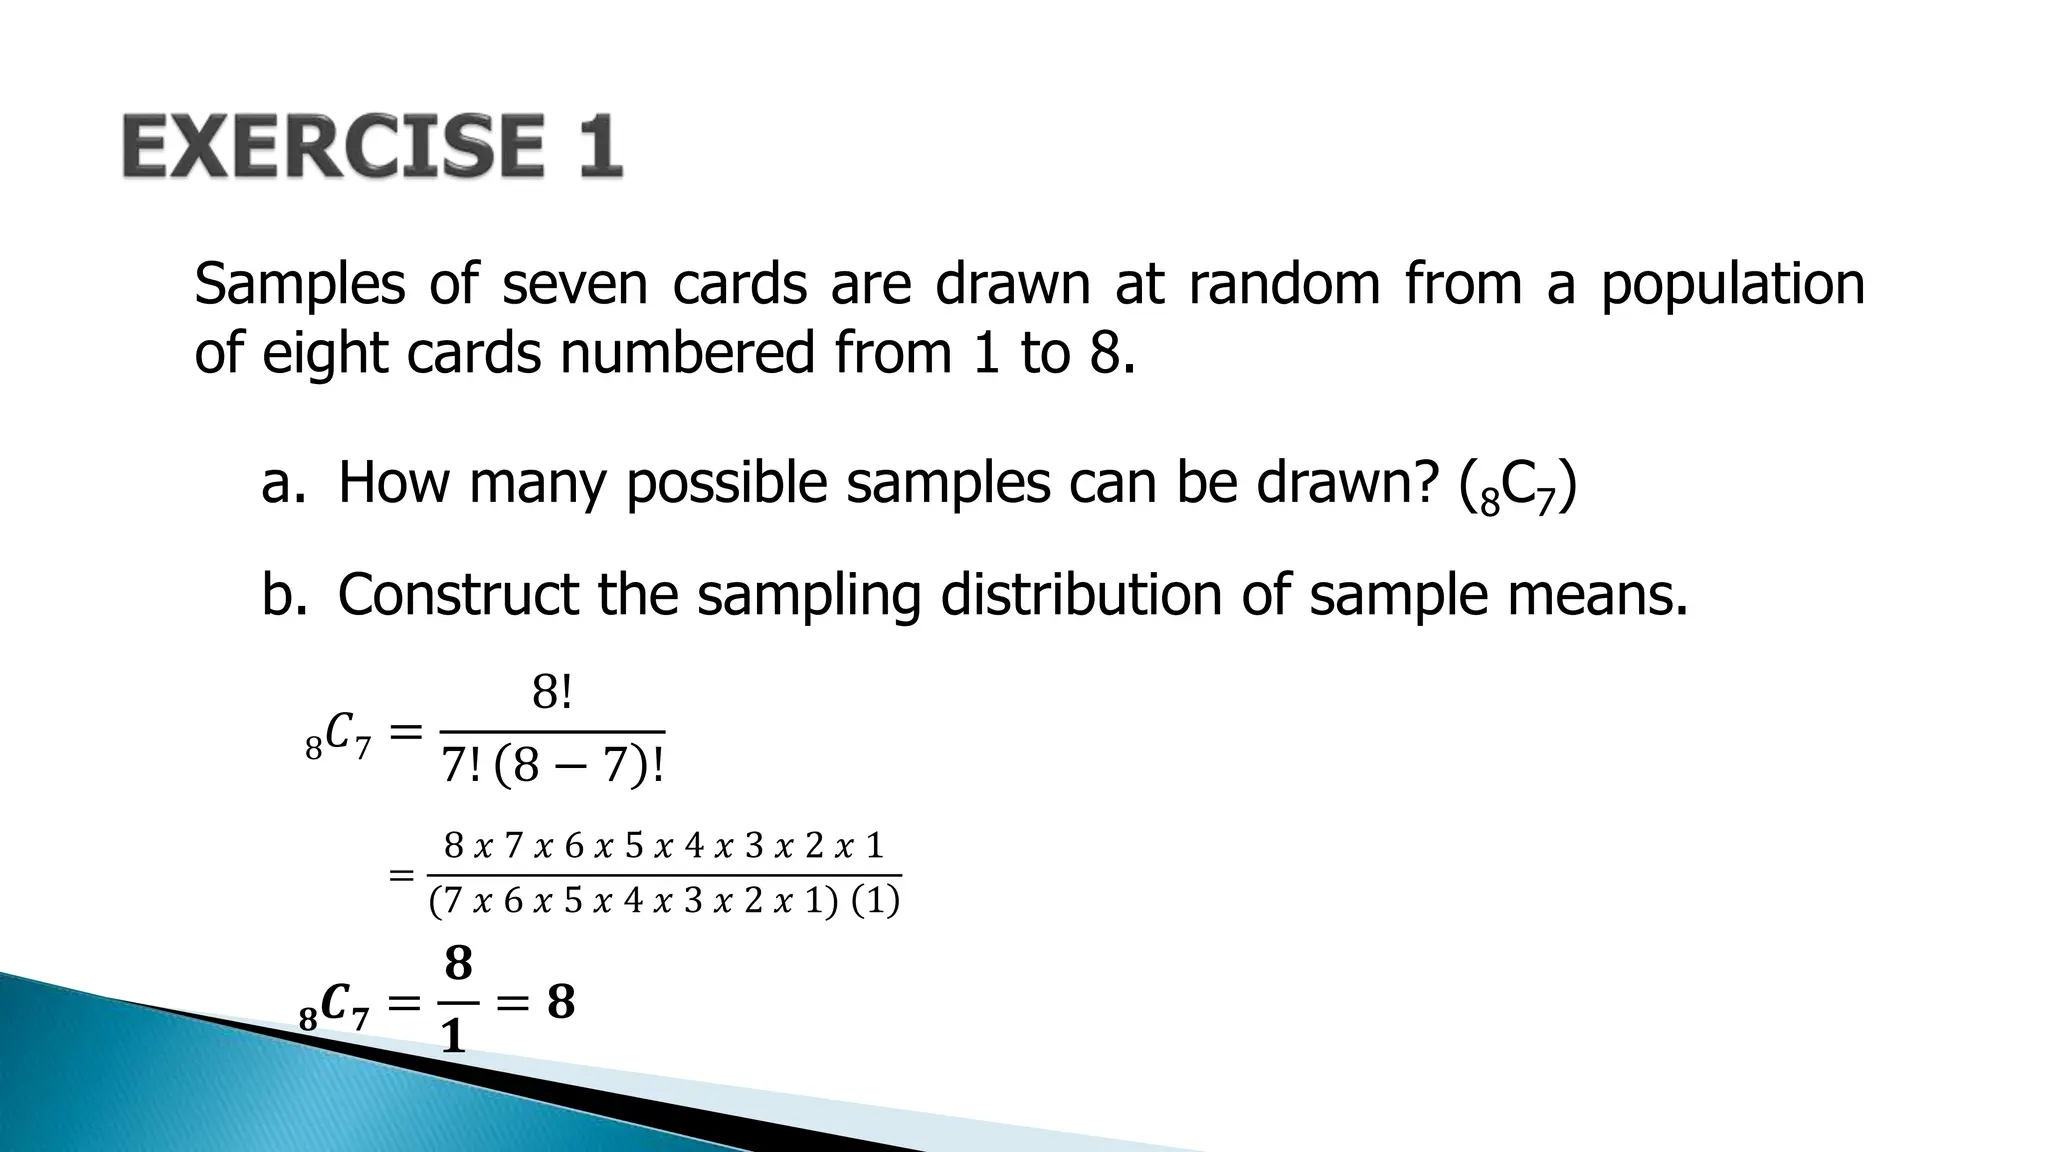
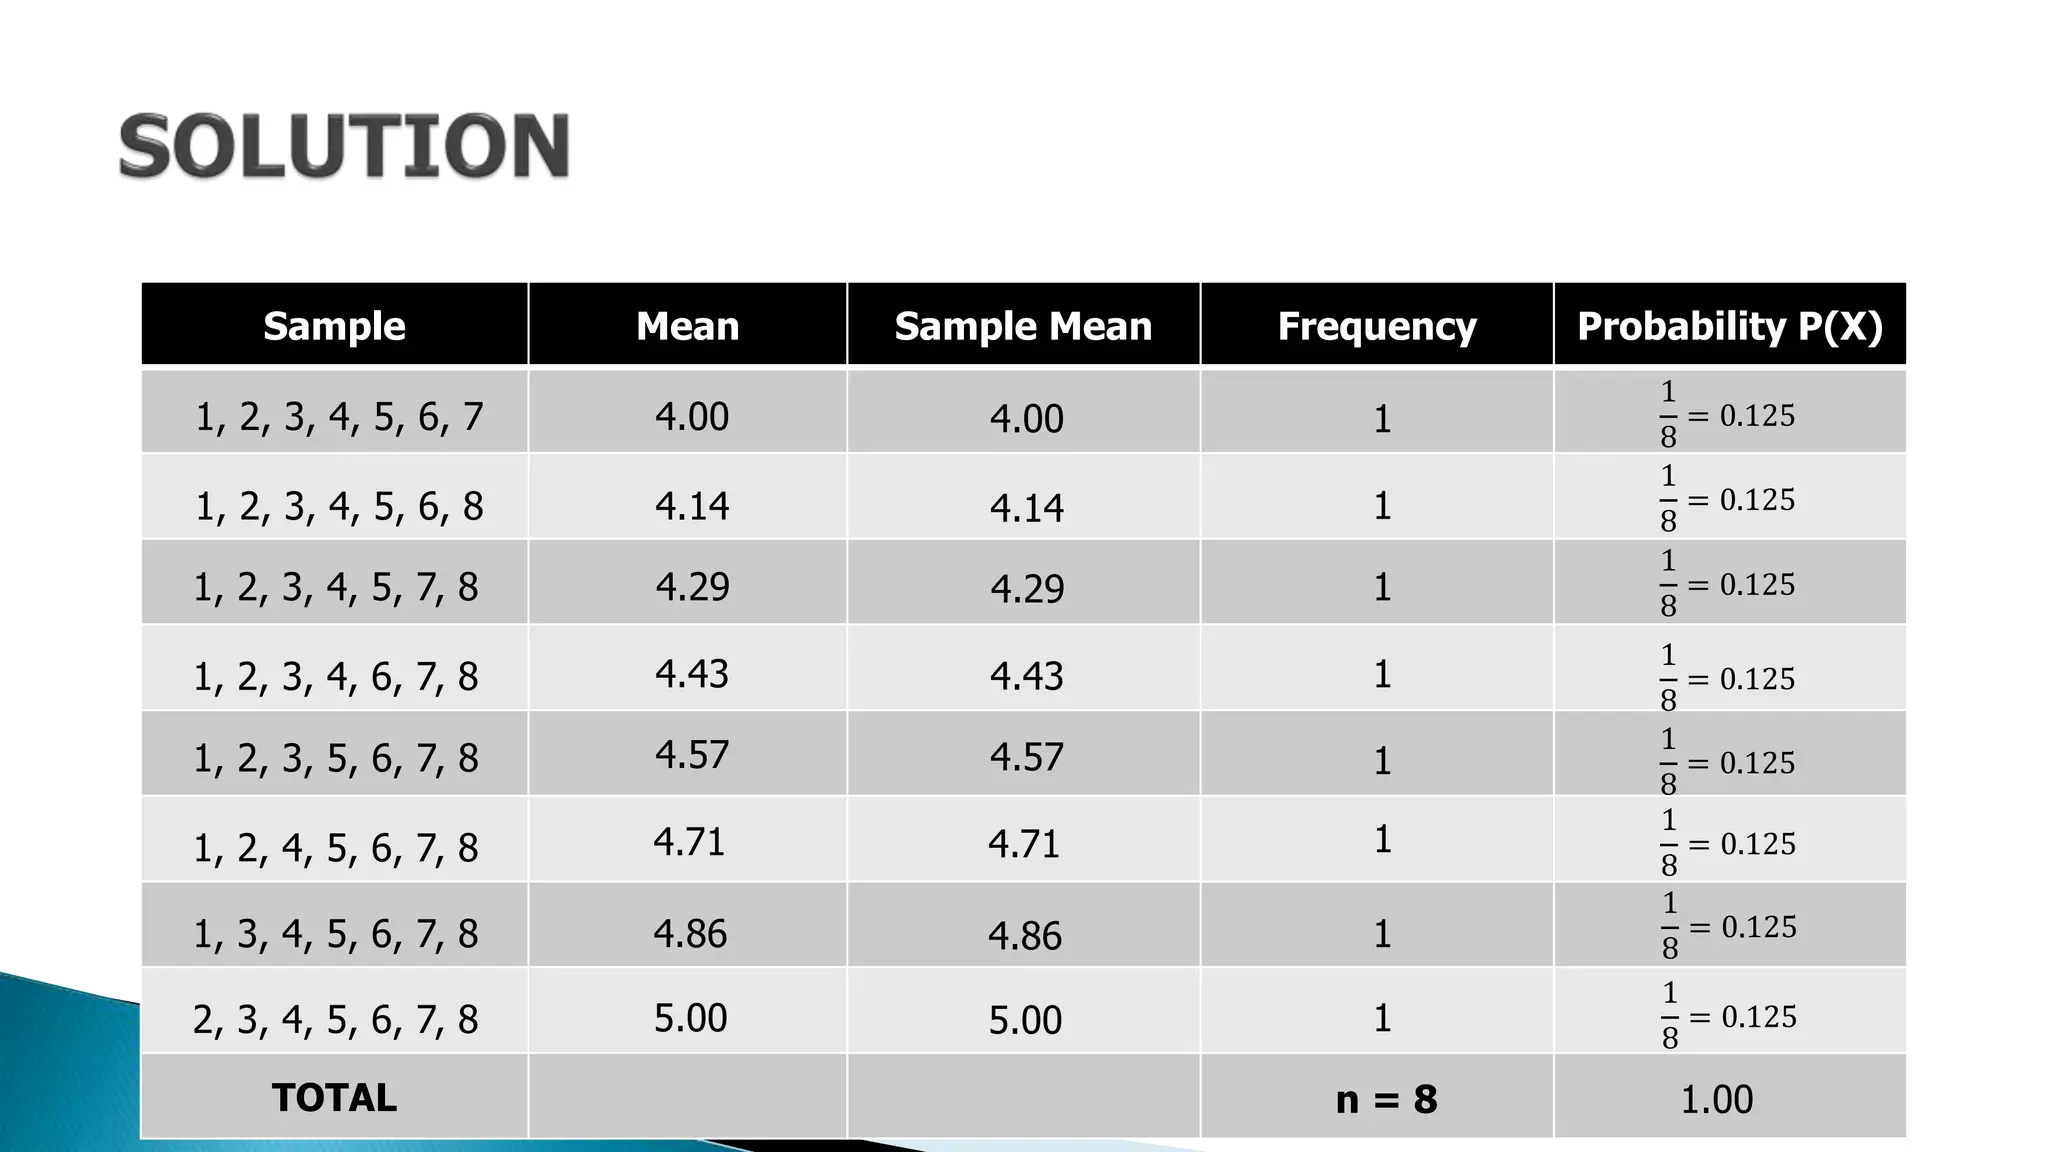
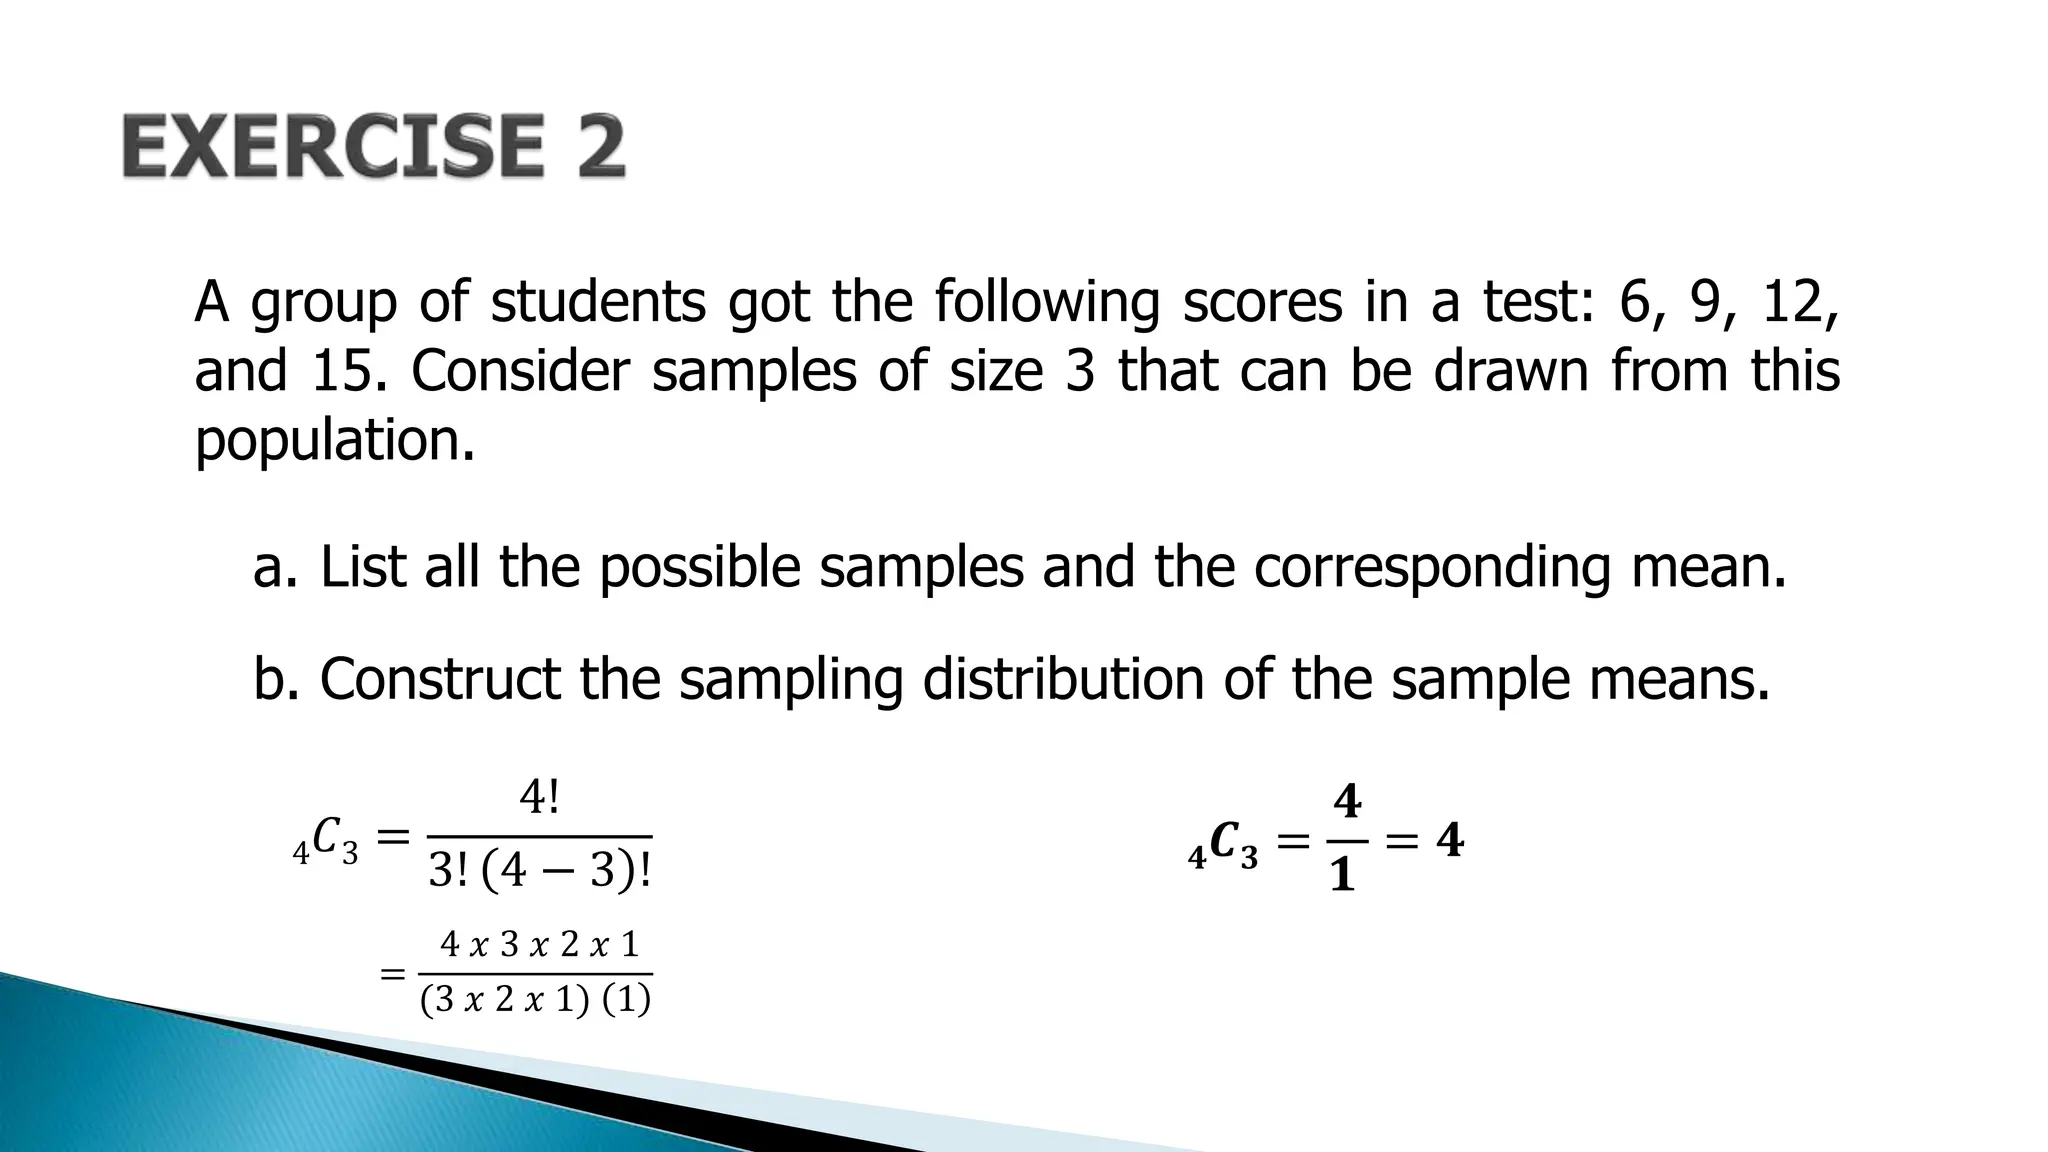
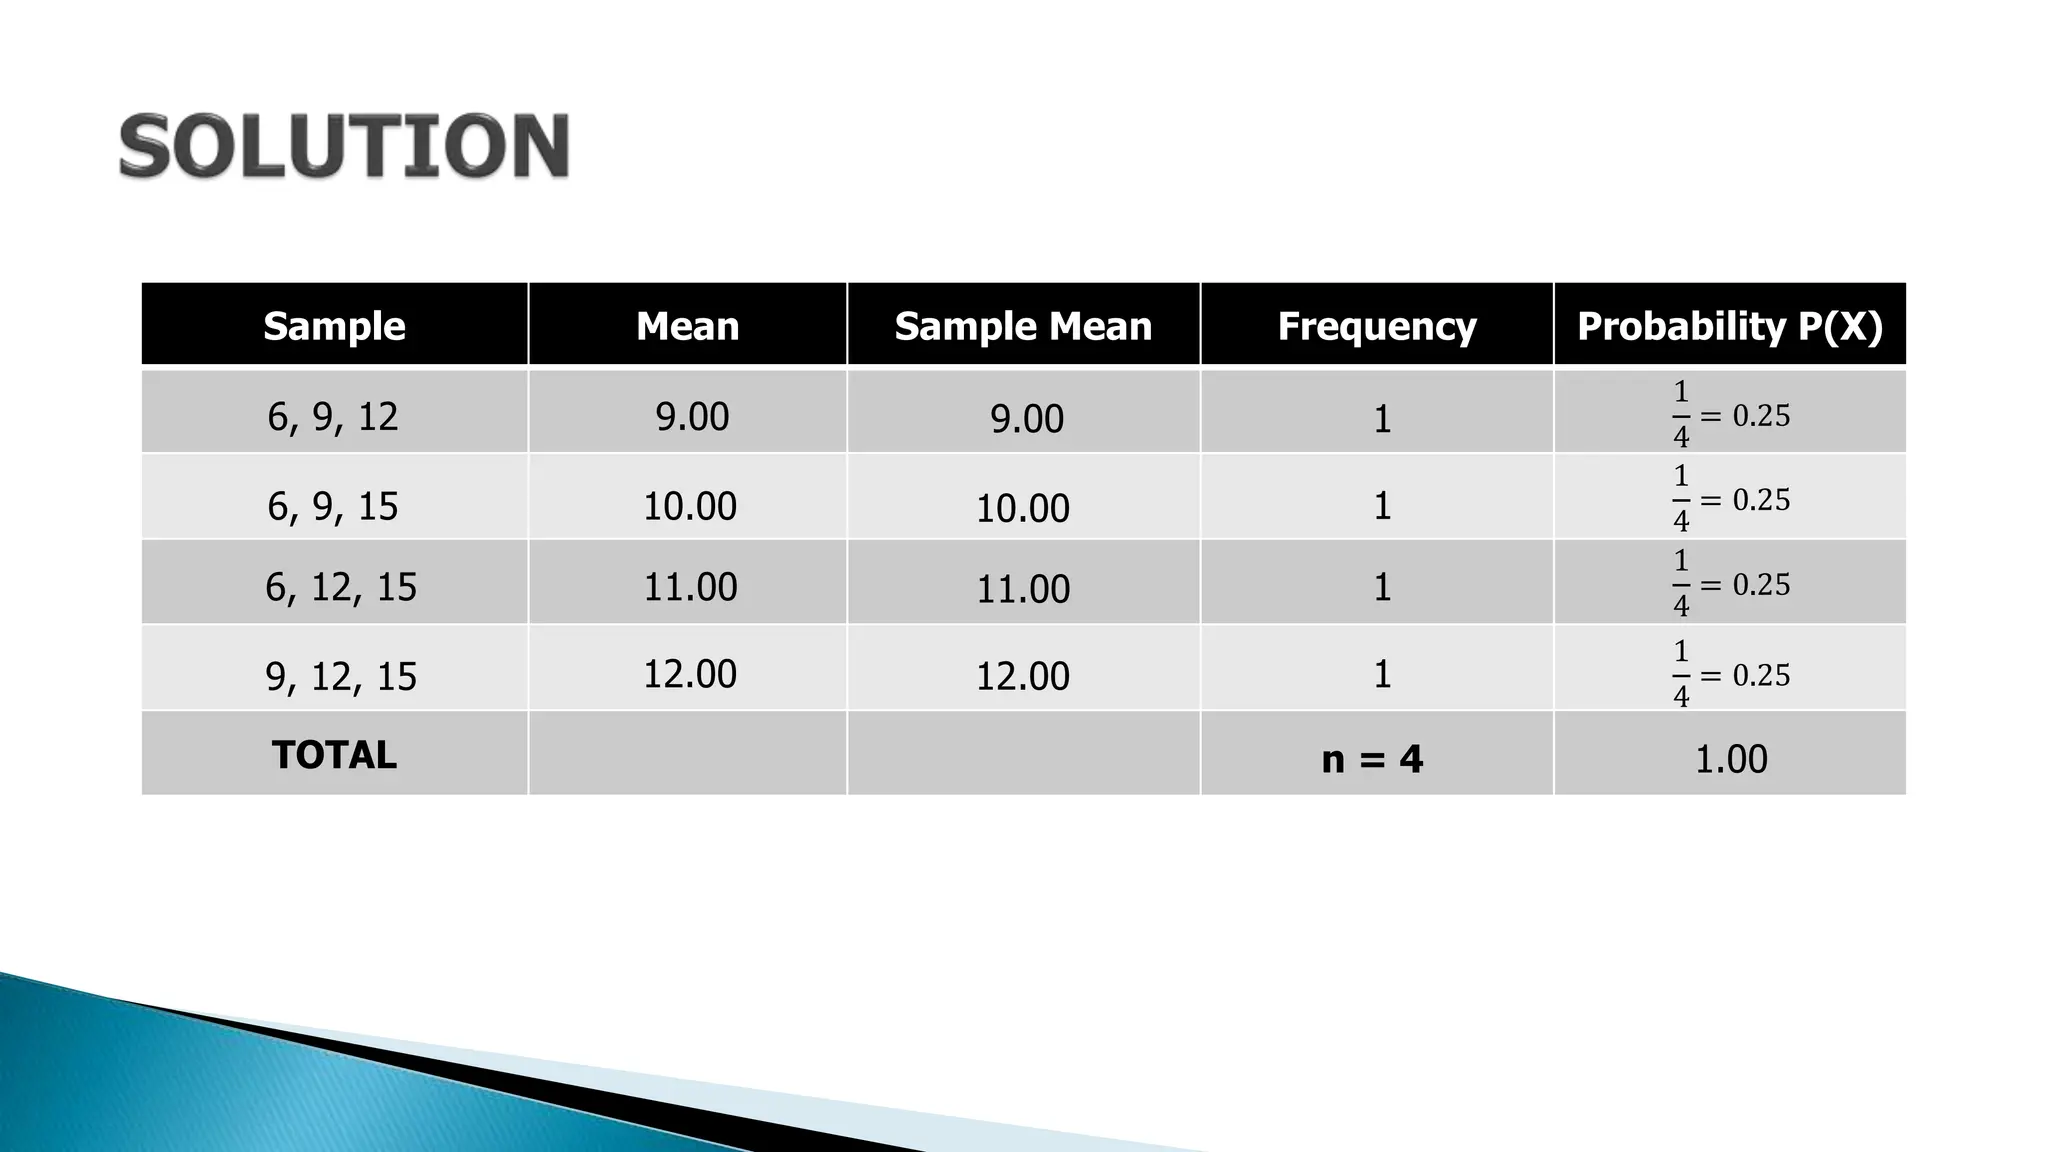
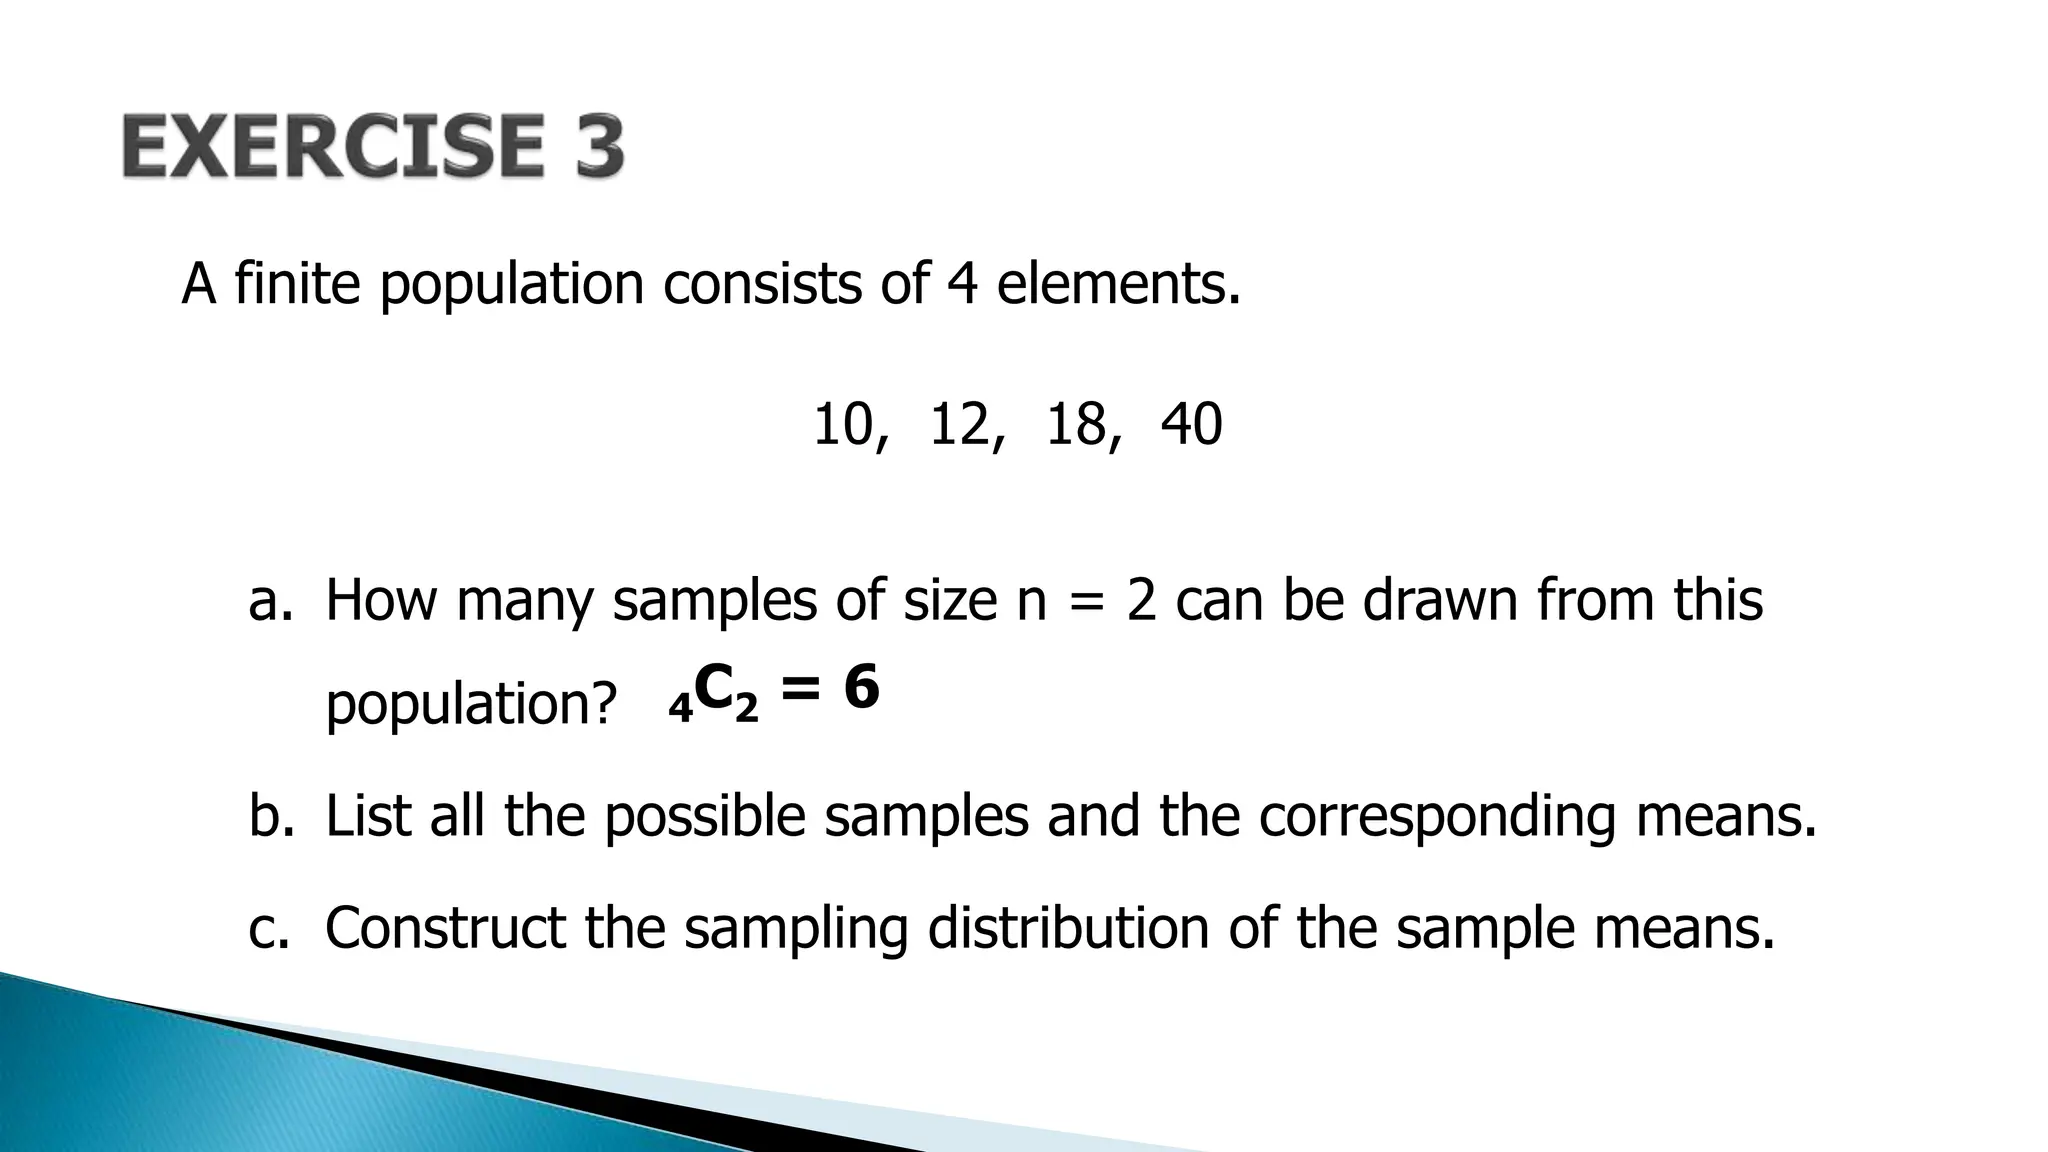
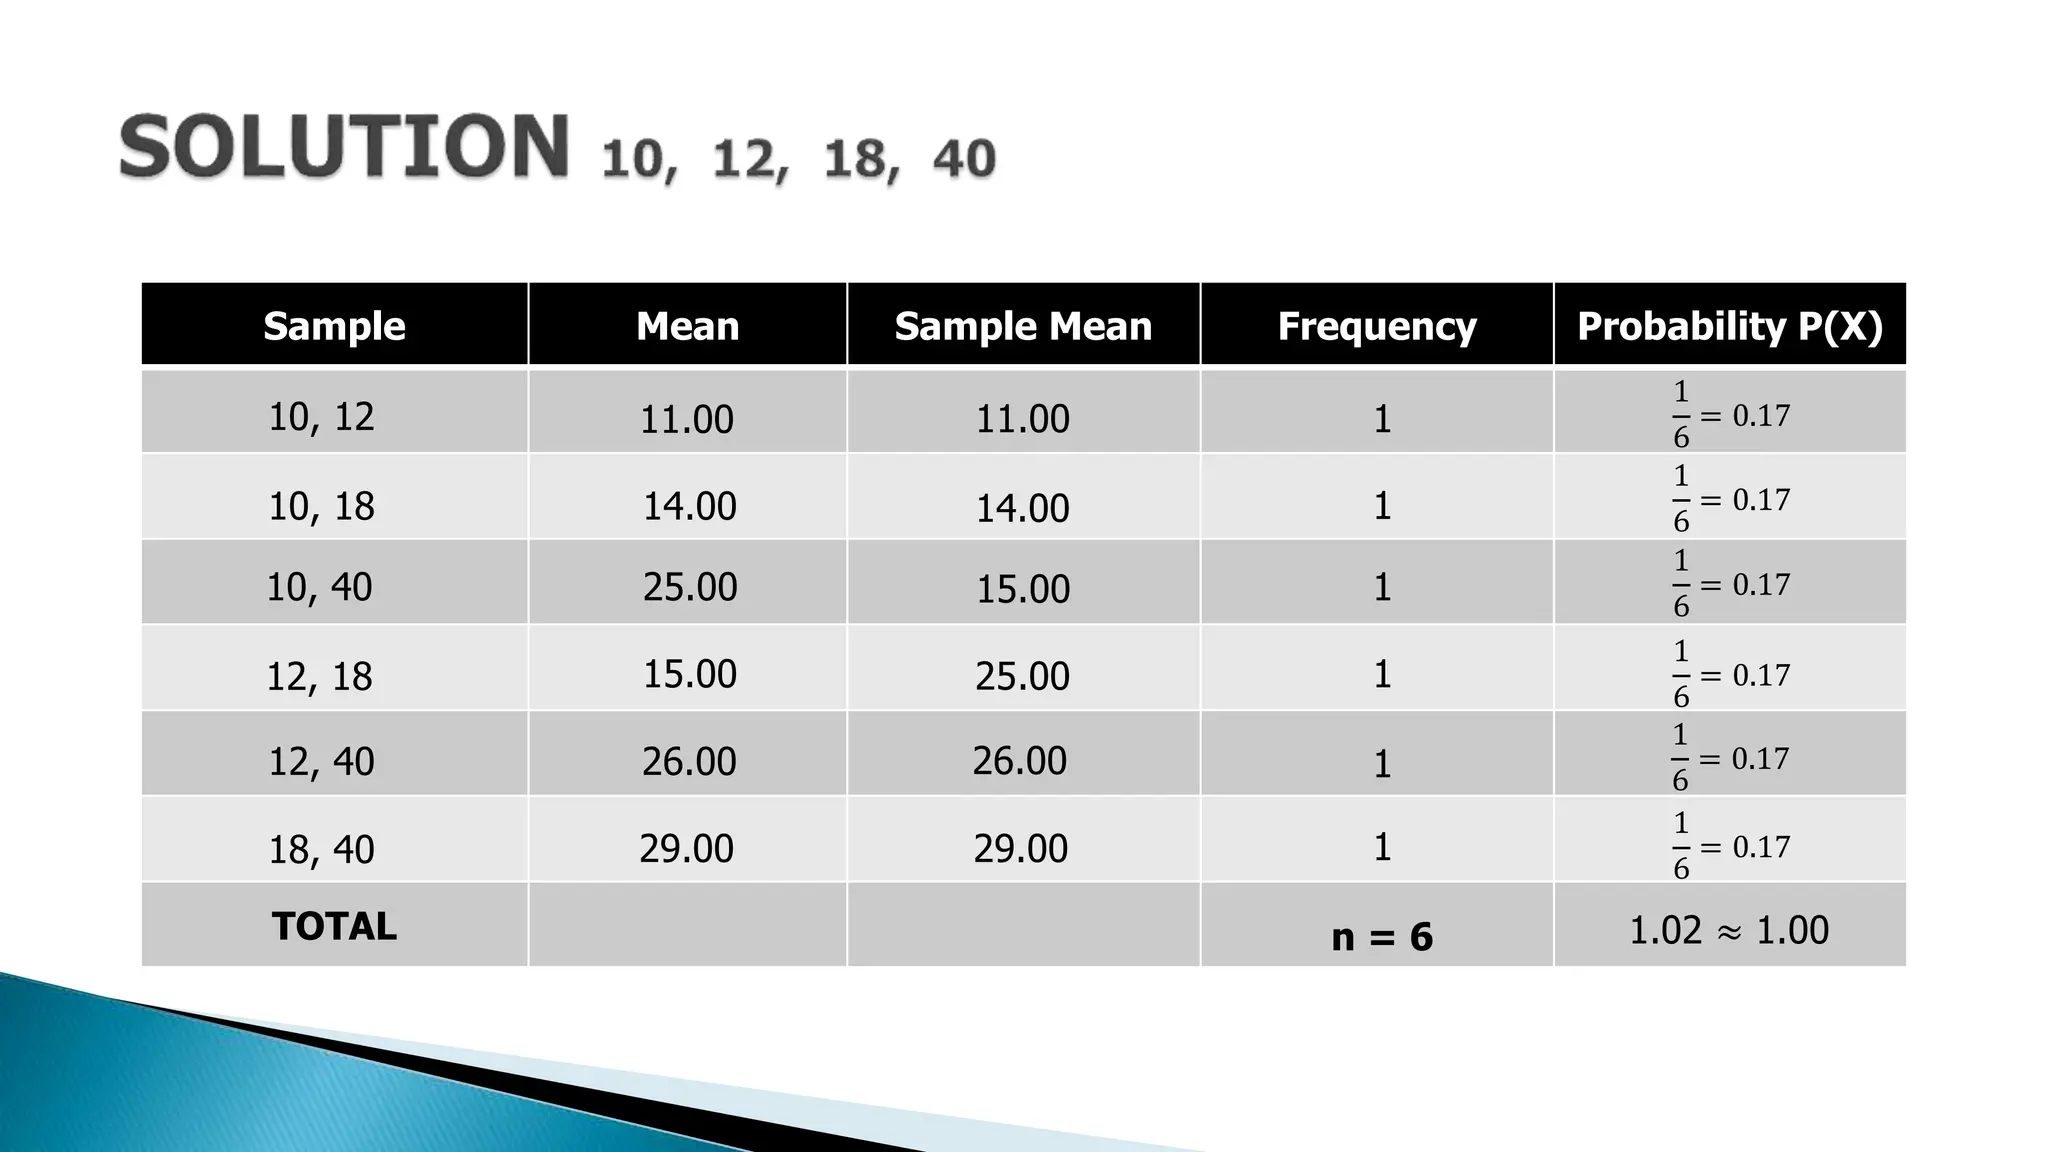
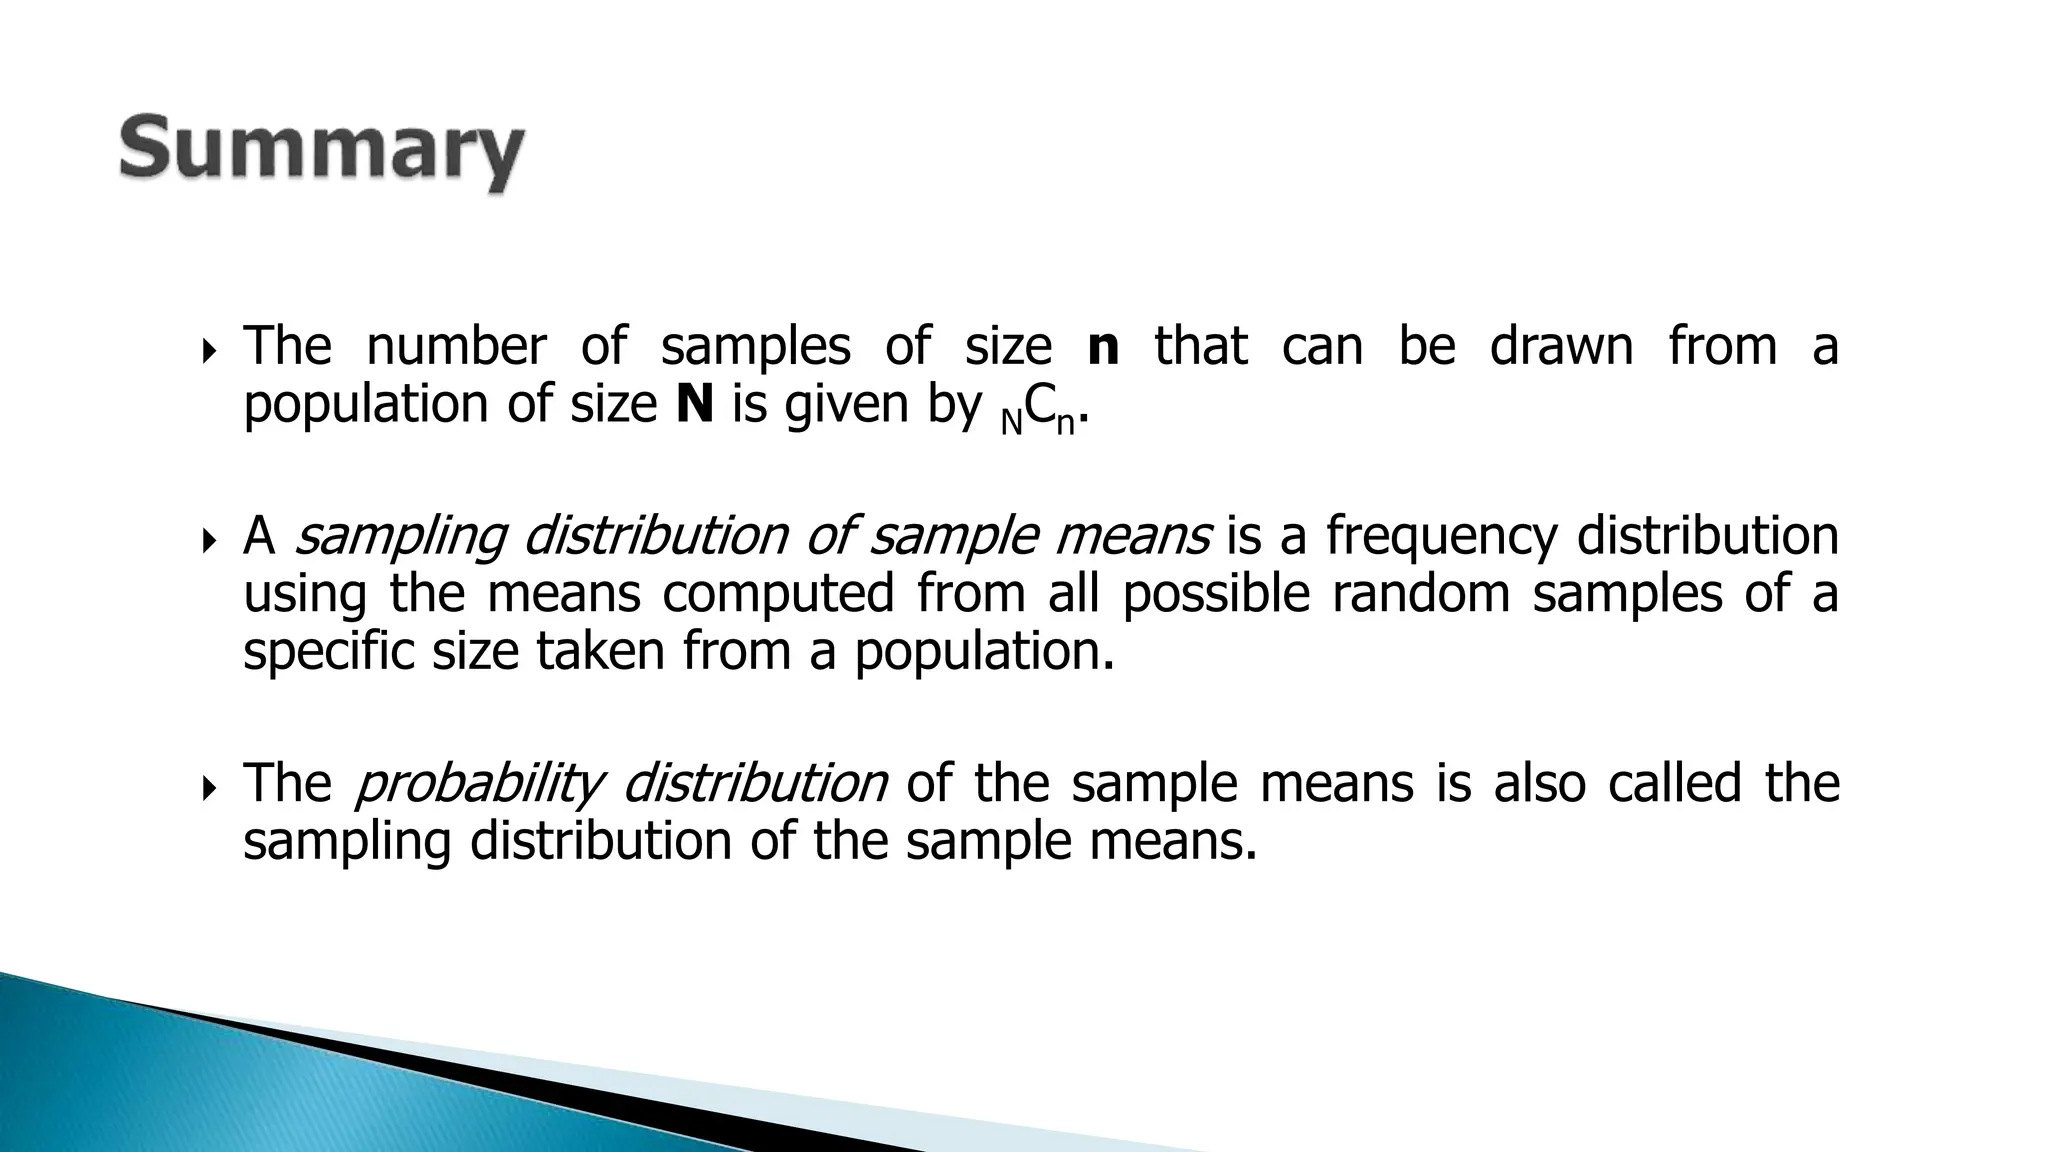
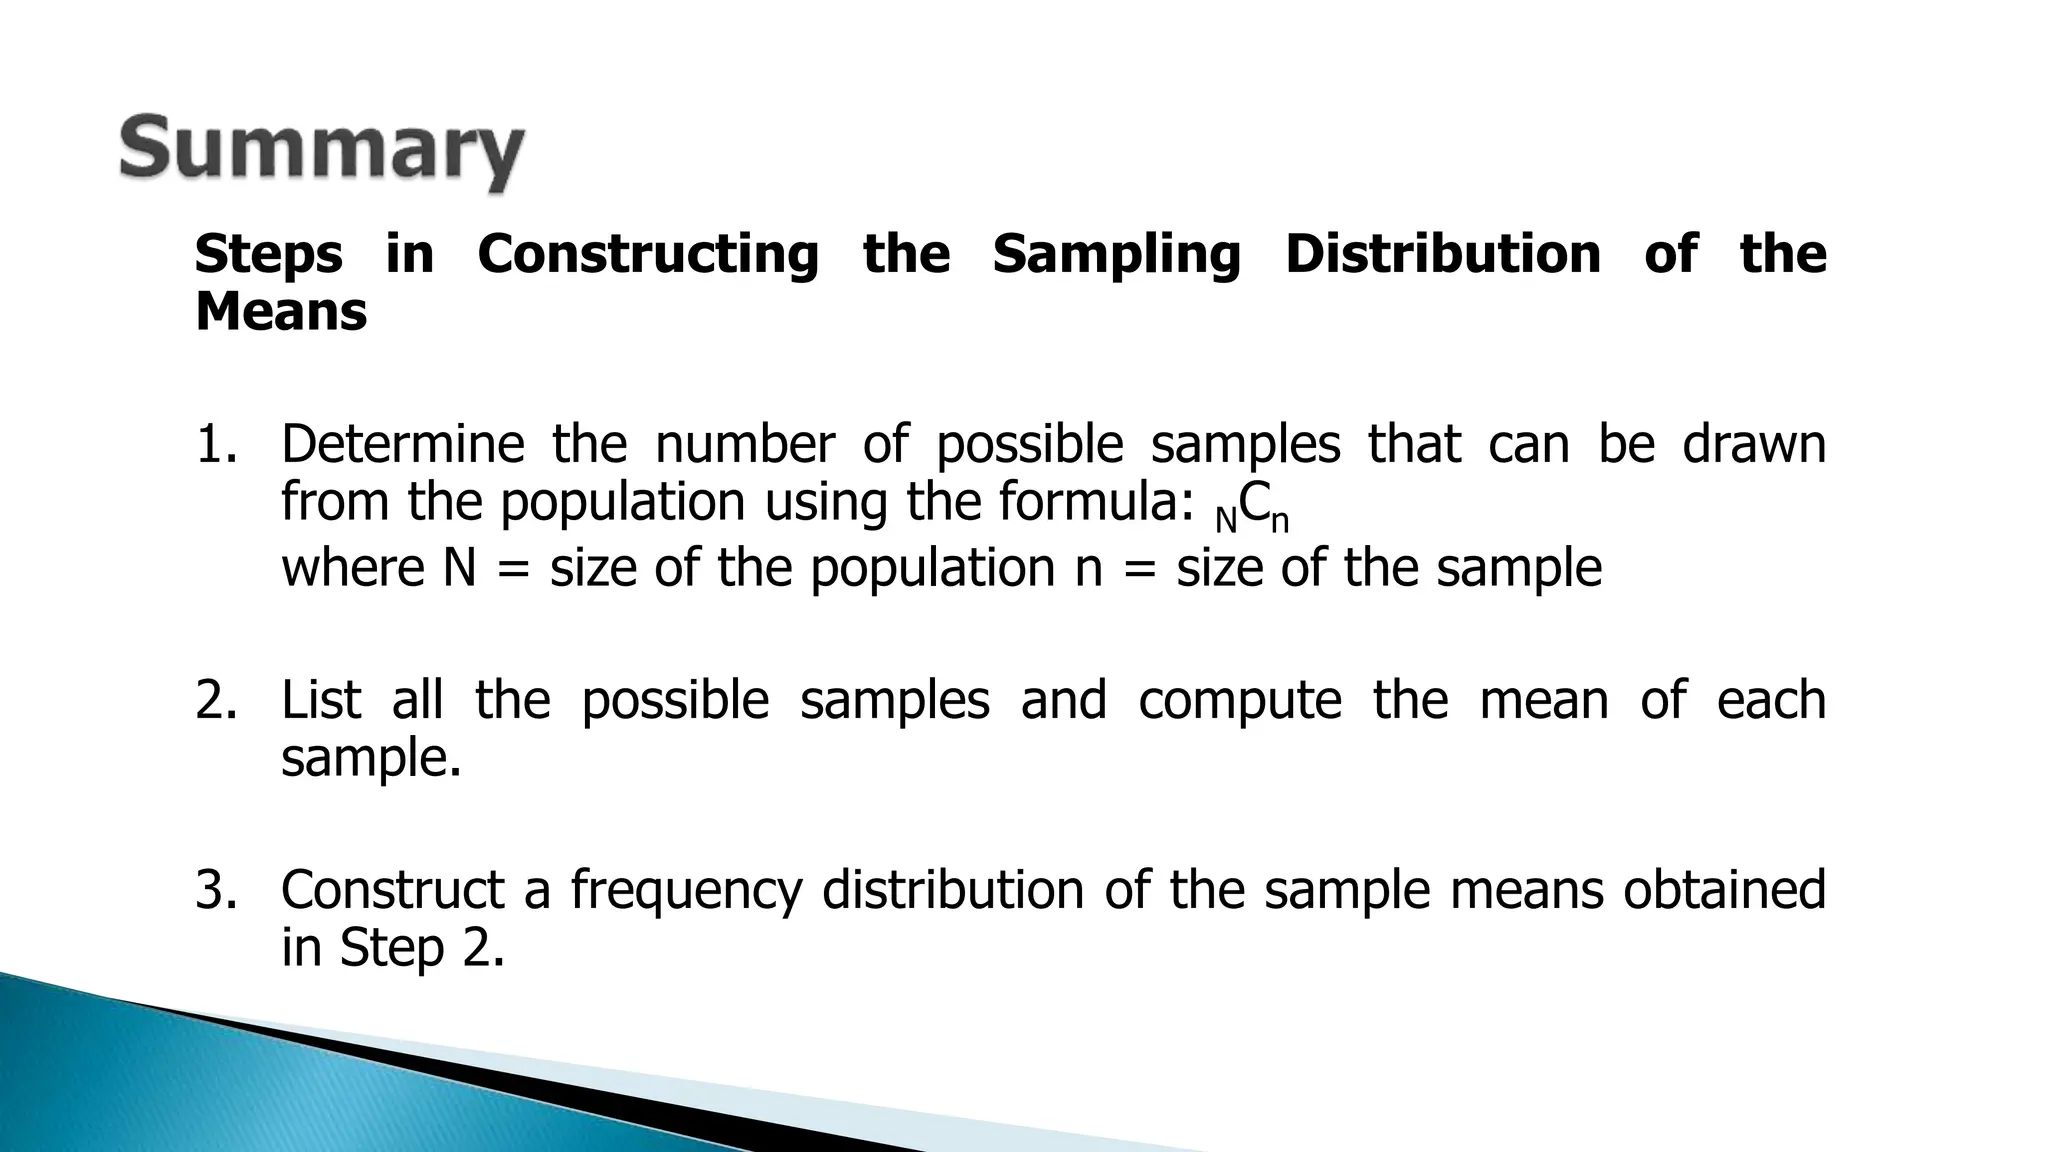
DOMINIC DALTON L. CALING
Statistics and Probability | Grade 11
At the end of this lesson, you are expected to:
 illustrate random sampling;
 distinguish between parameter and statistic; and
 construct sampling distribution of sample means.
BLOOD TYPE FREQUENCY
A
B
AB
O
5
N = 25
7
4
9
5.40
7.67
7.00
15.57
22.125
= 10
N𝐶𝑛 =
𝑁!
𝑛! 𝑁 − 𝑛 !
where 0 ≤ 𝑛 ≤ 𝑁 and
𝑁 = total number of objects in the set
𝑛 = number of choosing objects from the set
= 70
= 84
= 120
= 495
5𝐶3 =
5!
3! 5 − 3 !
=
5 𝑥 4 𝑥 3 𝑥 2 𝑥 1
3 𝑥 2 𝑥 1 2 !
=
5 𝑥 4 𝑥 3 𝑥 2 𝑥 1
(3 𝑥 2 𝑥 1) 2 𝑥 1
=
5 𝑥 4
2 𝑥 1
=
20
2
𝟓𝑪𝟑 = 𝟏𝟎
Researchers use sampling if taking a census of the entire population
is impractical. Data from the sample are used to calculate statistics,
which are estimates of the corresponding population parameters.
For instance, a sample might be drawn from the population, its mean
is calculated, and this value is used as a statistic or an estimate
for the population mean.
Thus, descriptive measures computed from a population are called
parameters while descriptive measures computed from a sample
are called statistics. We say that the sample mean is an estimate of
the population mean 𝜇.
Sampling Distribution of Sample Means
 The number of samples of size n that can be drawn from a
population of size N is given by NCn.
 A sampling distribution of sample means is a frequency distribution
using the means computed from all possible random samples of a
specific size taken from a population.
 The probability distribution of the sample means is also called the
sampling distribution of the sample means.
Steps in Constructing the Sampling Distribution of the
Means
1. Determine the number of possible samples that can be
drawn from the population using the formula: NCn where N =
size of the population n = size of the sample
2. List all the possible samples and compute the mean of each
sample.
3. Construct a frequency distribution of the sample means
obtained in Step 2.
A population consists of the numbers 2, 4, 9, 10, and 5.
a. List all possible samples of size 3 from this population.
b. Compute the mean of each sample.
c. Prepare a sampling distribution of the sample means.
a. The possible samples of size 3 from 2, 4, 9, 10, and 5 are…
b. The mean of each sample are as follows:
c. The sampling distribution of the sample means
Samples of seven cards are drawn at random from a population
of eight cards numbered from 1 to 8.
a. How many possible samples can be drawn? (8C7)
b. Construct the sampling distribution of sample means.
8𝐶7 =
8!
7! 8 − 7 !
=
8 𝑥 7 𝑥 6 𝑥 5 𝑥 4 𝑥 3 𝑥 2 𝑥 1
(7 𝑥 6 𝑥 5 𝑥 4 𝑥 3 𝑥 2 𝑥 1) 1
𝟖𝑪𝟕 =
𝟖
𝟏
= 𝟖
Sample Mean Sample Mean Frequency Probability P(X)
TOTAL
1, 2, 3, 4, 5, 6, 7
1, 2, 3, 4, 5, 6, 8
1, 2, 3, 4, 5, 7, 8
1, 2, 3, 4, 6, 7, 8
1, 2, 3, 5, 6, 7, 8
1, 2, 4, 5, 6, 7, 8
1, 3, 4, 5, 6, 7, 8
2, 3, 4, 5, 6, 7, 8
4.00
4.14
5.00
4.86
4.71
4.57
4.43
4.29
4.00
4.14
5.00
4.86
4.71
4.57
4.43
4.29
1
1
1
1
1
1
1
1
1
8
= 0.125
1
8
= 0.125
1
8
= 0.125
1
8
= 0.125
1
8
= 0.125
1
8
= 0.125
1
8
= 0.125
1
8
= 0.125
1.00
n = 8
A group of students got the following scores in a test: 6, 9, 12,
and 15. Consider samples of size 3 that can be drawn from this
population.
a. List all the possible samples and the corresponding mean.
b. Construct the sampling distribution of the sample means.
4𝐶3 =
4!
3! 4 − 3 !
=
4 𝑥 3 𝑥 2 𝑥 1
(3 𝑥 2 𝑥 1) 1
𝟒𝑪𝟑 =
𝟒
𝟏
= 𝟒
Sample Mean Sample Mean Frequency Probability P(X)
TOTAL
6, 9, 12
6, 9, 15
6, 12, 15
9, 12, 15
9.00
10.00
12.00
11.00
9.00
10.00
12.00
11.00
1
1
1
1
1
4
= 0.25
1
4
= 0.25
1
4
= 0.25
1
4
= 0.25
1.00
n = 4
A finite population consists of 4 elements.
10, 12, 18, 40
a. How many samples of size n = 2 can be drawn from this
population?
b. List all the possible samples and the corresponding means.
c. Construct the sampling distribution of the sample means.
4C2 = 6
Sample Mean Sample Mean Frequency Probability P(X)
TOTAL
10, 12
10, 18
10, 40
12, 18
11.00
14.00
15.00
25.00
11.00
14.00
25.00
15.00
1
1
1
1
1
6
= 0.17
1
6
= 0.17
1
6
= 0.17
1
6
= 0.17
1.02 ≈ 1.00
n = 6
12, 40
18, 40
26.00
29.00
26.00
29.00
1
1
1
6
= 0.17
1
6
= 0.17
A random variable is a function that associates a real
number to each element in the sample space. It is a variable
whose values are determined by chance.
 The number of samples of size n that can be drawn from a
population of size N is given by NCn.
 A sampling distribution of sample means is a frequency distribution
using the means computed from all possible random samples of a
specific size taken from a population.
 The probability distribution of the sample means is also called the
sampling distribution of the sample means.
Steps in Constructing the Sampling Distribution of the
Means
1. Determine the number of possible samples that can be drawn
from the population using the formula: NCn
where N = size of the population n = size of the sample
2. List all the possible samples and compute the mean of each
sample.
3. Construct a frequency distribution of the sample means obtained
in Step 2.
10-Sampling-Distribution-of-the-Sample-Means.pptx

10-Sampling-Distribution-of-the-Sample-Means.pptx

  • 1.
    DOMINIC DALTON L.CALING Statistics and Probability | Grade 11
  • 2.
    At the endof this lesson, you are expected to:  illustrate random sampling;  distinguish between parameter and statistic; and  construct sampling distribution of sample means.
  • 4.
  • 5.
  • 6.
    = 10 N𝐶𝑛 = 𝑁! 𝑛!𝑁 − 𝑛 ! where 0 ≤ 𝑛 ≤ 𝑁 and 𝑁 = total number of objects in the set 𝑛 = number of choosing objects from the set = 70 = 84 = 120 = 495 5𝐶3 = 5! 3! 5 − 3 ! = 5 𝑥 4 𝑥 3 𝑥 2 𝑥 1 3 𝑥 2 𝑥 1 2 ! = 5 𝑥 4 𝑥 3 𝑥 2 𝑥 1 (3 𝑥 2 𝑥 1) 2 𝑥 1 = 5 𝑥 4 2 𝑥 1 = 20 2 𝟓𝑪𝟑 = 𝟏𝟎
  • 7.
    Researchers use samplingif taking a census of the entire population is impractical. Data from the sample are used to calculate statistics, which are estimates of the corresponding population parameters. For instance, a sample might be drawn from the population, its mean is calculated, and this value is used as a statistic or an estimate for the population mean. Thus, descriptive measures computed from a population are called parameters while descriptive measures computed from a sample are called statistics. We say that the sample mean is an estimate of the population mean 𝜇.
  • 8.
    Sampling Distribution ofSample Means  The number of samples of size n that can be drawn from a population of size N is given by NCn.  A sampling distribution of sample means is a frequency distribution using the means computed from all possible random samples of a specific size taken from a population.  The probability distribution of the sample means is also called the sampling distribution of the sample means.
  • 9.
    Steps in Constructingthe Sampling Distribution of the Means 1. Determine the number of possible samples that can be drawn from the population using the formula: NCn where N = size of the population n = size of the sample 2. List all the possible samples and compute the mean of each sample. 3. Construct a frequency distribution of the sample means obtained in Step 2.
  • 10.
    A population consistsof the numbers 2, 4, 9, 10, and 5. a. List all possible samples of size 3 from this population. b. Compute the mean of each sample. c. Prepare a sampling distribution of the sample means.
  • 11.
    a. The possiblesamples of size 3 from 2, 4, 9, 10, and 5 are…
  • 12.
    b. The meanof each sample are as follows:
  • 13.
    c. The samplingdistribution of the sample means
  • 14.
    Samples of sevencards are drawn at random from a population of eight cards numbered from 1 to 8. a. How many possible samples can be drawn? (8C7) b. Construct the sampling distribution of sample means. 8𝐶7 = 8! 7! 8 − 7 ! = 8 𝑥 7 𝑥 6 𝑥 5 𝑥 4 𝑥 3 𝑥 2 𝑥 1 (7 𝑥 6 𝑥 5 𝑥 4 𝑥 3 𝑥 2 𝑥 1) 1 𝟖𝑪𝟕 = 𝟖 𝟏 = 𝟖
  • 15.
    Sample Mean SampleMean Frequency Probability P(X) TOTAL 1, 2, 3, 4, 5, 6, 7 1, 2, 3, 4, 5, 6, 8 1, 2, 3, 4, 5, 7, 8 1, 2, 3, 4, 6, 7, 8 1, 2, 3, 5, 6, 7, 8 1, 2, 4, 5, 6, 7, 8 1, 3, 4, 5, 6, 7, 8 2, 3, 4, 5, 6, 7, 8 4.00 4.14 5.00 4.86 4.71 4.57 4.43 4.29 4.00 4.14 5.00 4.86 4.71 4.57 4.43 4.29 1 1 1 1 1 1 1 1 1 8 = 0.125 1 8 = 0.125 1 8 = 0.125 1 8 = 0.125 1 8 = 0.125 1 8 = 0.125 1 8 = 0.125 1 8 = 0.125 1.00 n = 8
  • 16.
    A group ofstudents got the following scores in a test: 6, 9, 12, and 15. Consider samples of size 3 that can be drawn from this population. a. List all the possible samples and the corresponding mean. b. Construct the sampling distribution of the sample means. 4𝐶3 = 4! 3! 4 − 3 ! = 4 𝑥 3 𝑥 2 𝑥 1 (3 𝑥 2 𝑥 1) 1 𝟒𝑪𝟑 = 𝟒 𝟏 = 𝟒
  • 17.
    Sample Mean SampleMean Frequency Probability P(X) TOTAL 6, 9, 12 6, 9, 15 6, 12, 15 9, 12, 15 9.00 10.00 12.00 11.00 9.00 10.00 12.00 11.00 1 1 1 1 1 4 = 0.25 1 4 = 0.25 1 4 = 0.25 1 4 = 0.25 1.00 n = 4
  • 18.
    A finite populationconsists of 4 elements. 10, 12, 18, 40 a. How many samples of size n = 2 can be drawn from this population? b. List all the possible samples and the corresponding means. c. Construct the sampling distribution of the sample means. 4C2 = 6
  • 19.
    Sample Mean SampleMean Frequency Probability P(X) TOTAL 10, 12 10, 18 10, 40 12, 18 11.00 14.00 15.00 25.00 11.00 14.00 25.00 15.00 1 1 1 1 1 6 = 0.17 1 6 = 0.17 1 6 = 0.17 1 6 = 0.17 1.02 ≈ 1.00 n = 6 12, 40 18, 40 26.00 29.00 26.00 29.00 1 1 1 6 = 0.17 1 6 = 0.17
  • 20.
    A random variableis a function that associates a real number to each element in the sample space. It is a variable whose values are determined by chance.
  • 21.
     The numberof samples of size n that can be drawn from a population of size N is given by NCn.  A sampling distribution of sample means is a frequency distribution using the means computed from all possible random samples of a specific size taken from a population.  The probability distribution of the sample means is also called the sampling distribution of the sample means.
  • 22.
    Steps in Constructingthe Sampling Distribution of the Means 1. Determine the number of possible samples that can be drawn from the population using the formula: NCn where N = size of the population n = size of the sample 2. List all the possible samples and compute the mean of each sample. 3. Construct a frequency distribution of the sample means obtained in Step 2.